|
|
||||||||
|
||||||||

Gene summary for TGFB1 |
| Gene Symbol | TGFB1 | Gene ID | 7040 |
| Gene name | transforming growth factor beta 1 |
| Synonyms | TGFBETA;DPD1;CED;TGFB |
| Type of gene | protein_coding |
| UniProtAcc | P01137 |
| GO ID | GO term |
| GO:0010629 | negative regulation of gene expression |
| GO:0071456 | cellular response to hypoxia |
| GO:0010628 | positive regulation of gene expression |
| GO:0045893 | positive regulation of DNA-templated transcription |
| GO:0045944 | positive regulation of transcription by RNA polymerase II |
| GO:0051781 | positive regulation of cell division |
| GO:0045892 | negative regulation of DNA-templated transcription |
| GO:0000122 | negative regulation of transcription by RNA polymerase II |
| GO:0000902 | cell morphogenesis |
| GO:0001570 | vasculogenesis |
| GO:0001657 | ureteric bud development |
| GO:0001666 | response to hypoxia |
| GO:0001763 | morphogenesis of a branching structure |
| GO:0001775 | cell activation |
| GO:0001837 | epithelial to mesenchymal transition |
| GO:0001843 | neural tube closure |
| GO:0002028 | regulation of sodium ion transport |
| GO:0002069 | columnar/cuboidal epithelial cell maturation |
| GO:0002460 | adaptive immune response based on somatic recombination of immune receptors built from immunoglobulin superfamily domains |
| GO:0002513 | tolerance induction to self antigen |
| GO:0003179 | heart valve morphogenesis |
| GO:0003180 | aortic valve morphogenesis |
| GO:0006874 | cellular calcium ion homeostasis |
| GO:0006954 | inflammatory response |
| GO:0007179 | transforming growth factor beta receptor signaling pathway |
| GO:0007219 | Notch signaling pathway |
| GO:0007406 | negative regulation of neuroblast proliferation |
| GO:0007492 | endoderm development |
| GO:0007507 | heart development |
| GO:0007565 | female pregnancy |
| GO:0008283 | cell population proliferation |
| GO:0008354 | germ cell migration |
| GO:0009410 | response to xenobiotic stimulus |
| GO:0009749 | response to glucose |
| GO:0010033 | response to organic substance |
| GO:0010467 | gene expression |
| GO:0010468 | regulation of gene expression |
| GO:0010718 | positive regulation of epithelial to mesenchymal transition |
| GO:0010763 | positive regulation of fibroblast migration |
| GO:0014003 | oligodendrocyte development |
| GO:0014008 | positive regulation of microglia differentiation |
| GO:0014070 | response to organic cyclic compound |
| GO:0016202 | regulation of striated muscle tissue development |
| GO:0021915 | neural tube development |
| GO:0030217 | T cell differentiation |
| GO:0030279 | negative regulation of ossification |
| GO:0030308 | negative regulation of cell growth |
| GO:0030316 | osteoclast differentiation |
| GO:0030879 | mammary gland development |
| GO:0031065 | positive regulation of histone deacetylation |
| GO:0031100 | animal organ regeneration |
| GO:0031536 | positive regulation of exit from mitosis |
| GO:0032355 | response to estradiol |
| GO:0032667 | regulation of interleukin-23 production |
| GO:0032700 | negative regulation of interleukin-17 production |
| GO:0032740 | positive regulation of interleukin-17 production |
| GO:0032943 | mononuclear cell proliferation |
| GO:0032956 | regulation of actin cytoskeleton organization |
| GO:0032967 | positive regulation of collagen biosynthetic process |
| GO:0033280 | response to vitamin D |
| GO:0034616 | response to laminar fluid shear stress |
| GO:0035066 | positive regulation of histone acetylation |
| GO:0035902 | response to immobilization stress |
| GO:0042098 | T cell proliferation |
| GO:0042110 | T cell activation |
| GO:0042127 | regulation of cell population proliferation |
| GO:0042130 | negative regulation of T cell proliferation |
| GO:0042306 | regulation of protein import into nucleus |
| GO:0042475 | odontogenesis of dentin-containing tooth |
| GO:0042482 | positive regulation of odontogenesis |
| GO:0042552 | myelination |
| GO:0043029 | T cell homeostasis |
| GO:0043065 | positive regulation of apoptotic process |
| GO:0043129 | surfactant homeostasis |
| GO:0045066 | regulatory T cell differentiation |
| GO:0045589 | regulation of regulatory T cell differentiation |
| GO:0045591 | positive regulation of regulatory T cell differentiation |
| GO:0046716 | muscle cell cellular homeostasis |
| GO:0048146 | positive regulation of fibroblast proliferation |
| GO:0048286 | lung alveolus development |
| GO:0048535 | lymph node development |
| GO:0048565 | digestive tract development |
| GO:0048839 | inner ear development |
| GO:0050673 | epithelial cell proliferation |
| GO:0050679 | positive regulation of epithelial cell proliferation |
| GO:0050680 | negative regulation of epithelial cell proliferation |
| GO:0050765 | negative regulation of phagocytosis |
| GO:0050832 | defense response to fungus |
| GO:0050868 | negative regulation of T cell activation |
| GO:0051152 | positive regulation of smooth muscle cell differentiation |
| GO:0051280 | negative regulation of release of sequestered calcium ion into cytosol |
| GO:0051402 | neuron apoptotic process |
| GO:0051726 | regulation of cell cycle |
| GO:0055010 | ventricular cardiac muscle tissue morphogenesis |
| GO:0055091 | phospholipid homeostasis |
| GO:0060070 | canonical Wnt signaling pathway |
| GO:0060325 | face morphogenesis |
| GO:0060364 | frontal suture morphogenesis |
| GO:0060391 | positive regulation of SMAD protein signal transduction |
| GO:0060435 | bronchiole development |
| GO:0060744 | mammary gland branching involved in thelarche |
| GO:0060751 | branch elongation involved in mammary gland duct branching |
| GO:0060762 | regulation of branching involved in mammary gland duct morphogenesis |
| GO:0061035 | regulation of cartilage development |
| GO:0061298 | retina vasculature development in camera-type eye |
| GO:0061448 | connective tissue development |
| GO:0061520 | Langerhans cell differentiation |
| GO:0070168 | negative regulation of biomineral tissue development |
| GO:0070173 | regulation of enamel mineralization |
| GO:0070306 | lens fiber cell differentiation |
| GO:0071260 | cellular response to mechanical stimulus |
| GO:0071333 | cellular response to glucose stimulus |
| GO:0071363 | cellular response to growth factor stimulus |
| GO:0071479 | cellular response to ionizing radiation |
| GO:0071549 | cellular response to dexamethasone stimulus |
| GO:0071560 | cellular response to transforming growth factor beta stimulus |
| GO:0071677 | positive regulation of mononuclear cell migration |
| GO:0071895 | odontoblast differentiation |
| GO:0072089 | stem cell proliferation |
| GO:0085029 | extracellular matrix assembly |
| GO:0090190 | positive regulation of branching involved in ureteric bud morphogenesis |
| GO:0097421 | liver regeneration |
| GO:0098586 | cellular response to virus |
| GO:1900182 | positive regulation of protein localization to nucleus |
| GO:1901203 | positive regulation of extracellular matrix assembly |
| GO:1902074 | response to salt |
| GO:1990314 | cellular response to insulin-like growth factor stimulus |
| GO:1990402 | embryonic liver development |
| GO:2000648 | positive regulation of stem cell proliferation |
| GO:0008284 | positive regulation of cell population proliferation |
| GO:0070374 | positive regulation of ERK1 and ERK2 cascade |
| GO:0051897 | positive regulation of protein kinase B signaling |
| GO:0030335 | positive regulation of cell migration |
| GO:0031334 | positive regulation of protein-containing complex assembly |
| GO:0032755 | positive regulation of interleukin-6 production |
| GO:0032760 | positive regulation of tumor necrosis factor production |
| GO:0050729 | positive regulation of inflammatory response |
| GO:0045599 | negative regulation of fat cell differentiation |
| GO:0043117 | positive regulation of vascular permeability |
| GO:0045662 | negative regulation of myoblast differentiation |
| GO:0043123 | positive regulation of I-kappaB kinase/NF-kappaB signaling |
| GO:0050921 | positive regulation of chemotaxis |
| GO:0002062 | chondrocyte differentiation |
| GO:0001933 | negative regulation of protein phosphorylation |
| GO:0006796 | phosphate-containing compound metabolic process |
| GO:1902895 | positive regulation of miRNA transcription |
| GO:0002040 | sprouting angiogenesis |
| GO:0008285 | negative regulation of cell population proliferation |
| GO:0017015 | regulation of transforming growth factor beta receptor signaling pathway |
| GO:0097191 | extrinsic apoptotic signaling pathway |
| GO:0051247 | positive regulation of protein metabolic process |
| GO:0050731 | positive regulation of peptidyl-tyrosine phosphorylation |
| GO:0043536 | positive regulation of blood vessel endothelial cell migration |
| GO:0030214 | hyaluronan catabolic process |
| GO:0043410 | positive regulation of MAPK cascade |
| GO:0048298 | positive regulation of isotype switching to IgA isotypes |
| GO:0010742 | macrophage derived foam cell differentiation |
| GO:0048642 | negative regulation of skeletal muscle tissue development |
| GO:0042307 | positive regulation of protein import into nucleus |
| GO:0071404 | cellular response to low-density lipoprotein particle stimulus |
| GO:0002244 | hematopoietic progenitor cell differentiation |
| GO:1900126 | negative regulation of hyaluronan biosynthetic process |
| GO:0009611 | response to wounding |
| GO:0045742 | positive regulation of epidermal growth factor receptor signaling pathway |
| GO:0010575 | positive regulation of vascular endothelial growth factor production |
| GO:0010716 | negative regulation of extracellular matrix disassembly |
| GO:0048661 | positive regulation of smooth muscle cell proliferation |
| GO:0090263 | positive regulation of canonical Wnt signaling pathway |
| GO:0002248 | connective tissue replacement involved in inflammatory response wound healing |
| GO:0002859 | negative regulation of natural killer cell mediated cytotoxicity directed against tumor cell target |
| GO:0006611 | protein export from nucleus |
| GO:0006754 | ATP biosynthetic process |
| GO:0007435 | salivary gland morphogenesis |
| GO:0010936 | negative regulation of macrophage cytokine production |
| GO:0022408 | negative regulation of cell-cell adhesion |
| GO:0030334 | regulation of cell migration |
| GO:0031293 | membrane protein intracellular domain proteolysis |
| GO:0032570 | response to progesterone |
| GO:0032801 | receptor catabolic process |
| GO:0032930 | positive regulation of superoxide anion generation |
| GO:0035307 | positive regulation of protein dephosphorylation |
| GO:0036446 | myofibroblast differentiation |
| GO:0043537 | negative regulation of blood vessel endothelial cell migration |
| GO:0045216 | cell-cell junction organization |
| GO:0045596 | negative regulation of cell differentiation |
| GO:0045786 | negative regulation of cell cycle |
| GO:0050714 | positive regulation of protein secretion |
| GO:0060312 | regulation of blood vessel remodeling |
| GO:0070723 | response to cholesterol |
| GO:1902462 | positive regulation of mesenchymal stem cell proliferation |
| GO:1902894 | negative regulation of miRNA transcription |
| GO:1903077 | negative regulation of protein localization to plasma membrane |
| GO:1904018 | positive regulation of vasculature development |
| GO:1904894 | positive regulation of receptor signaling pathway via STAT |
| GO:2000343 | positive regulation of chemokine (C-X-C motif) ligand 2 production |
| GO:2000353 | positive regulation of endothelial cell apoptotic process |
| GO:2000636 | positive regulation of primary miRNA processing |
| GO:2000727 | positive regulation of cardiac muscle cell differentiation |
| GO:0007165 | signal transduction |
Top |
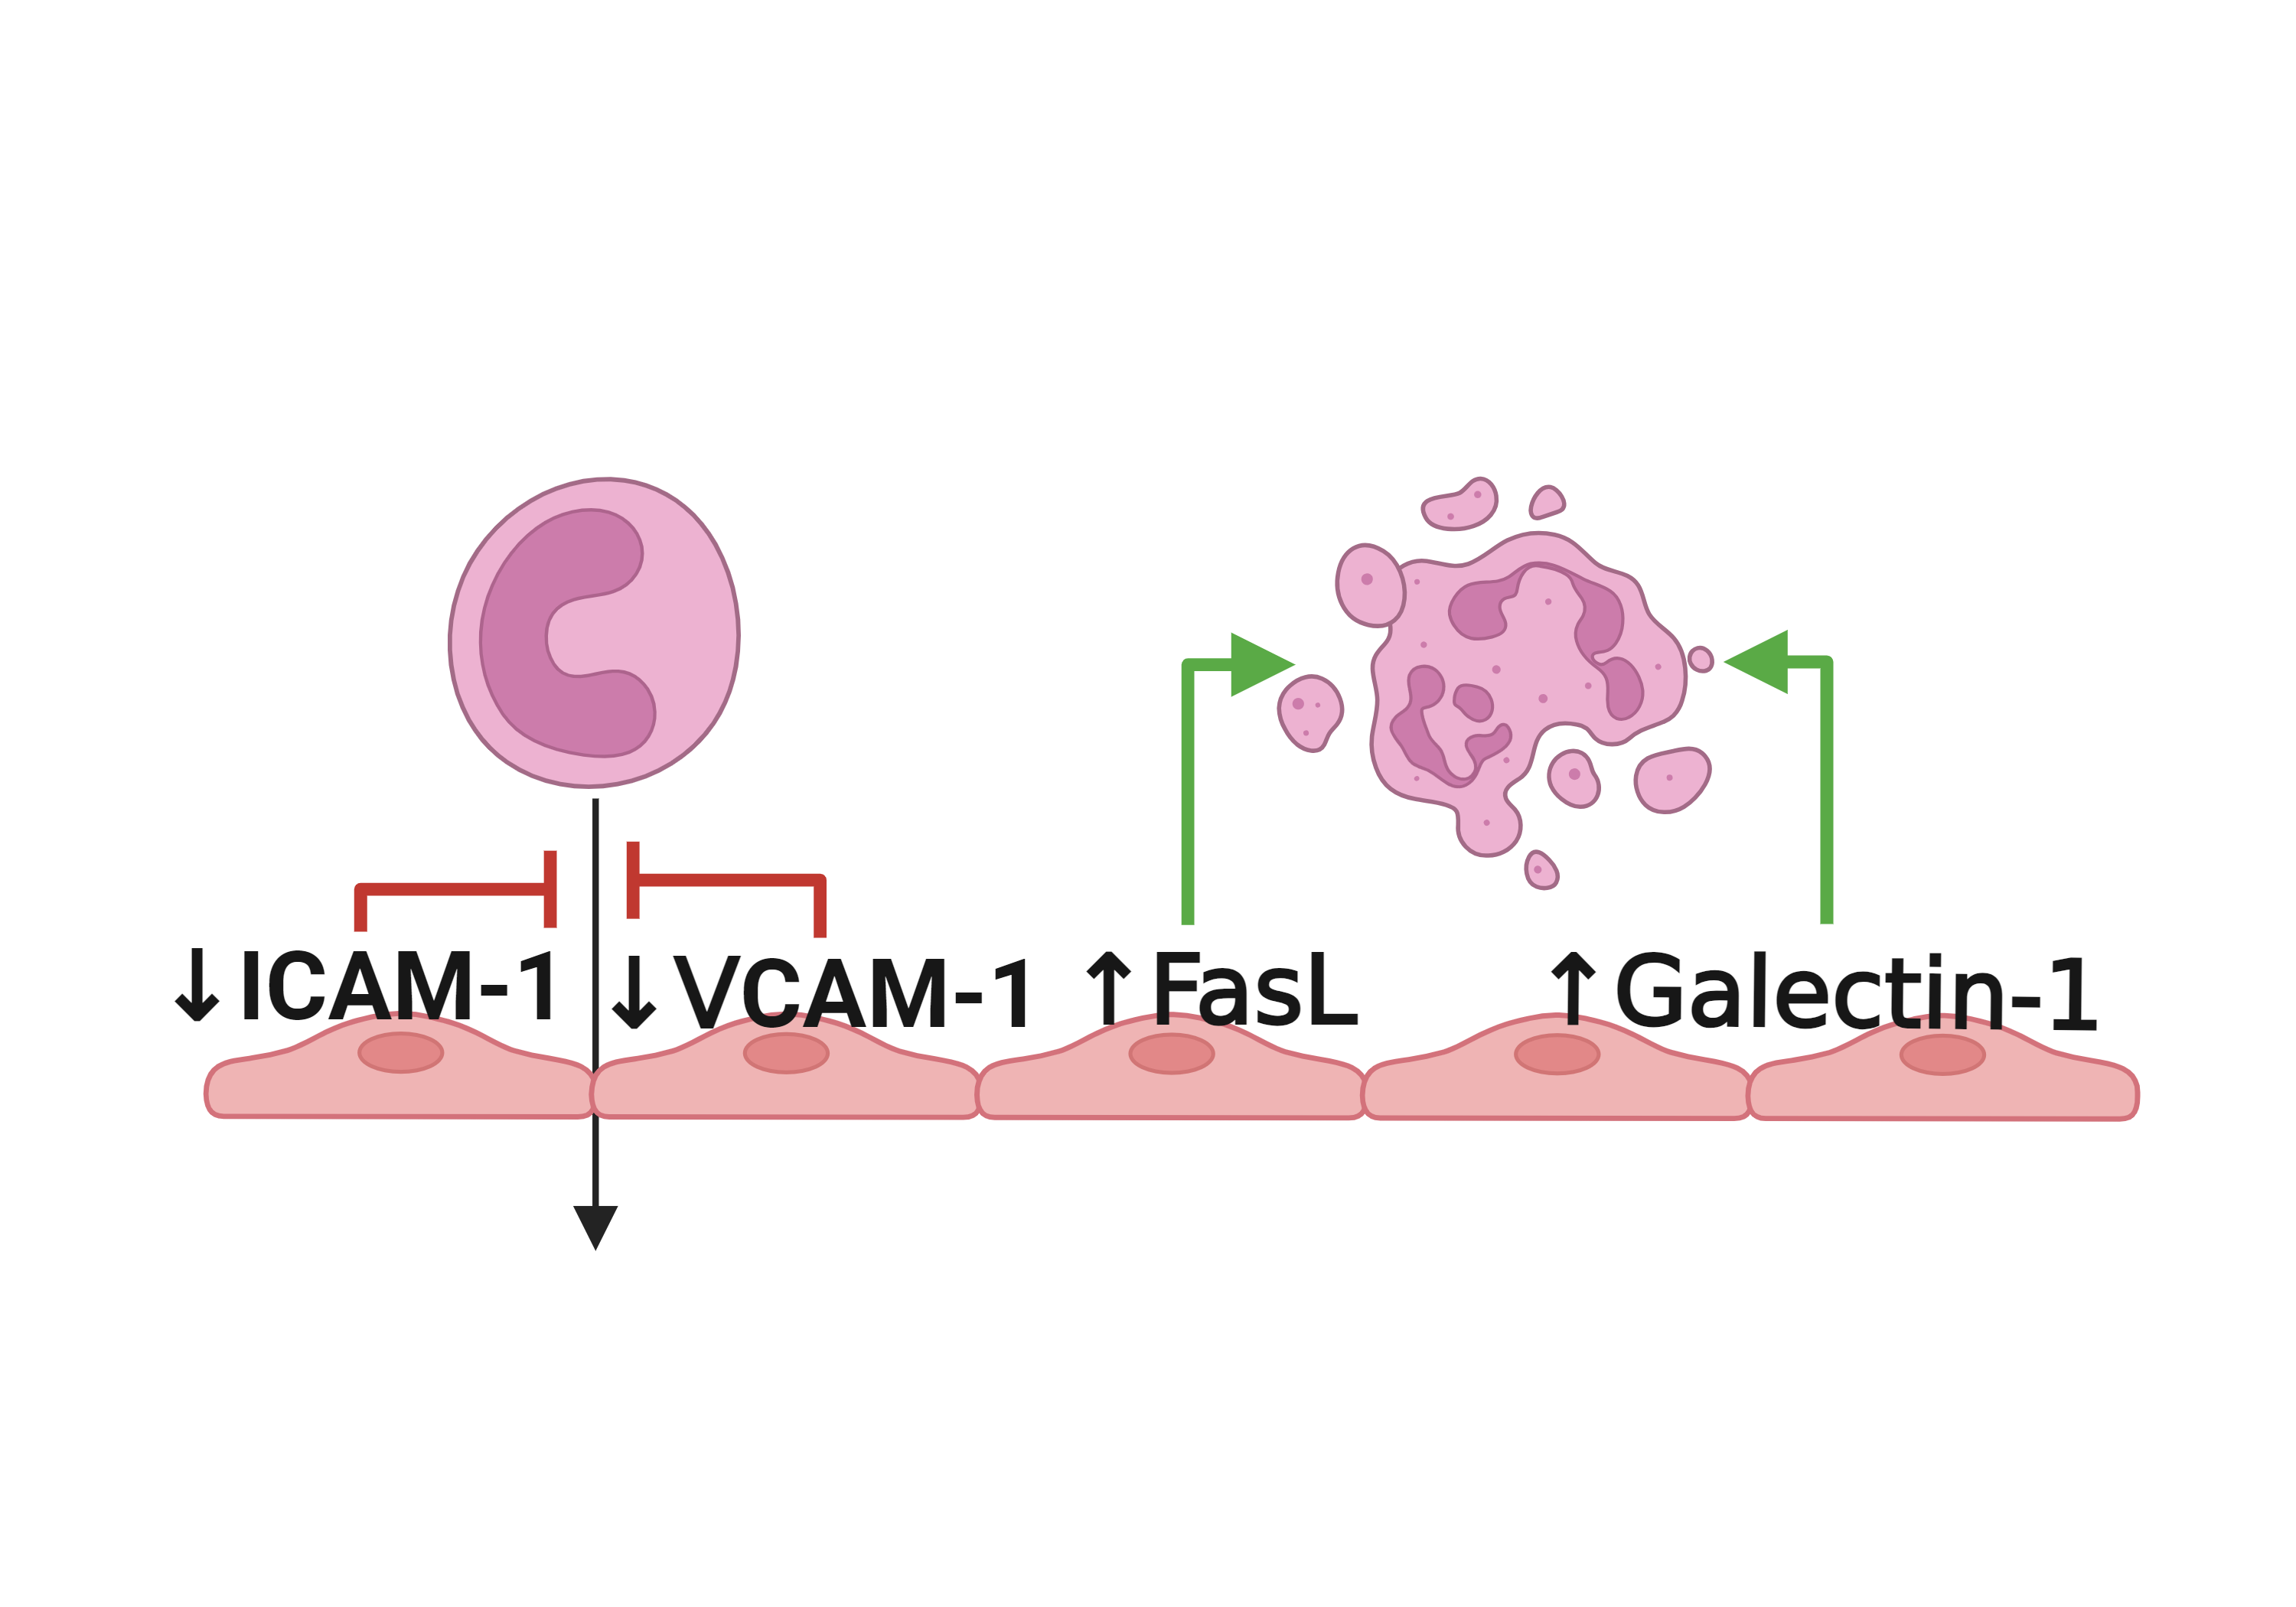
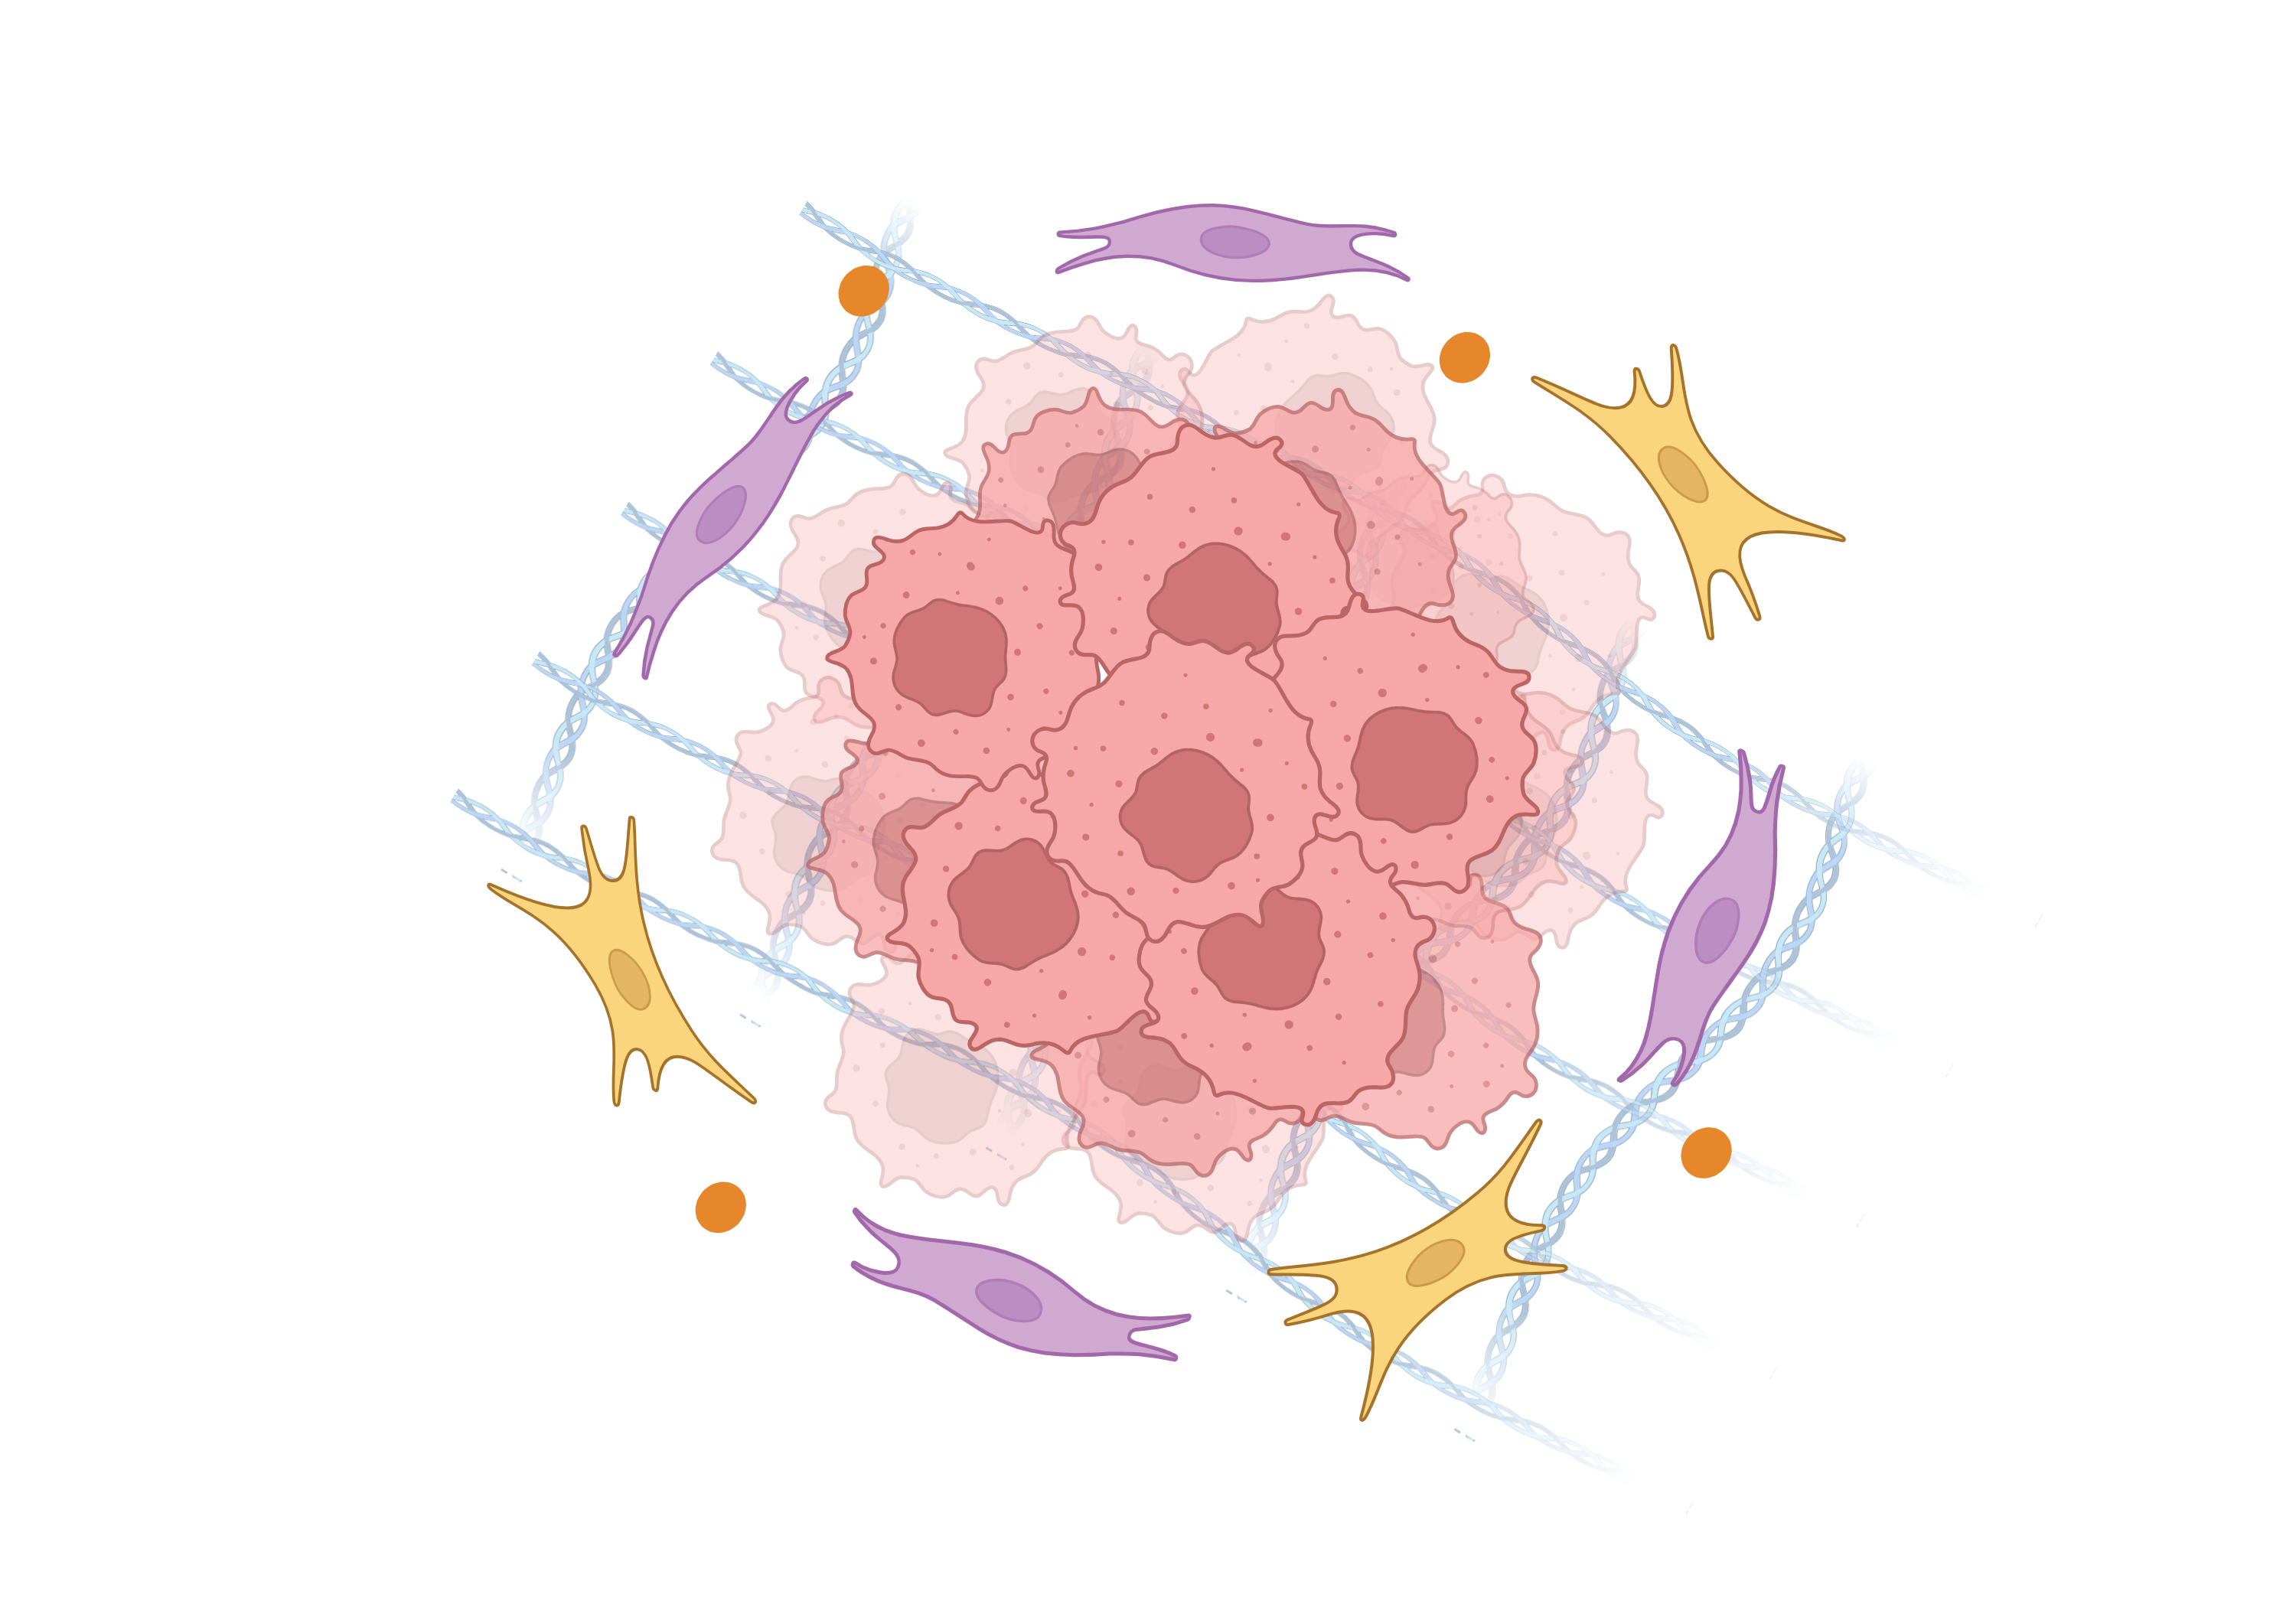
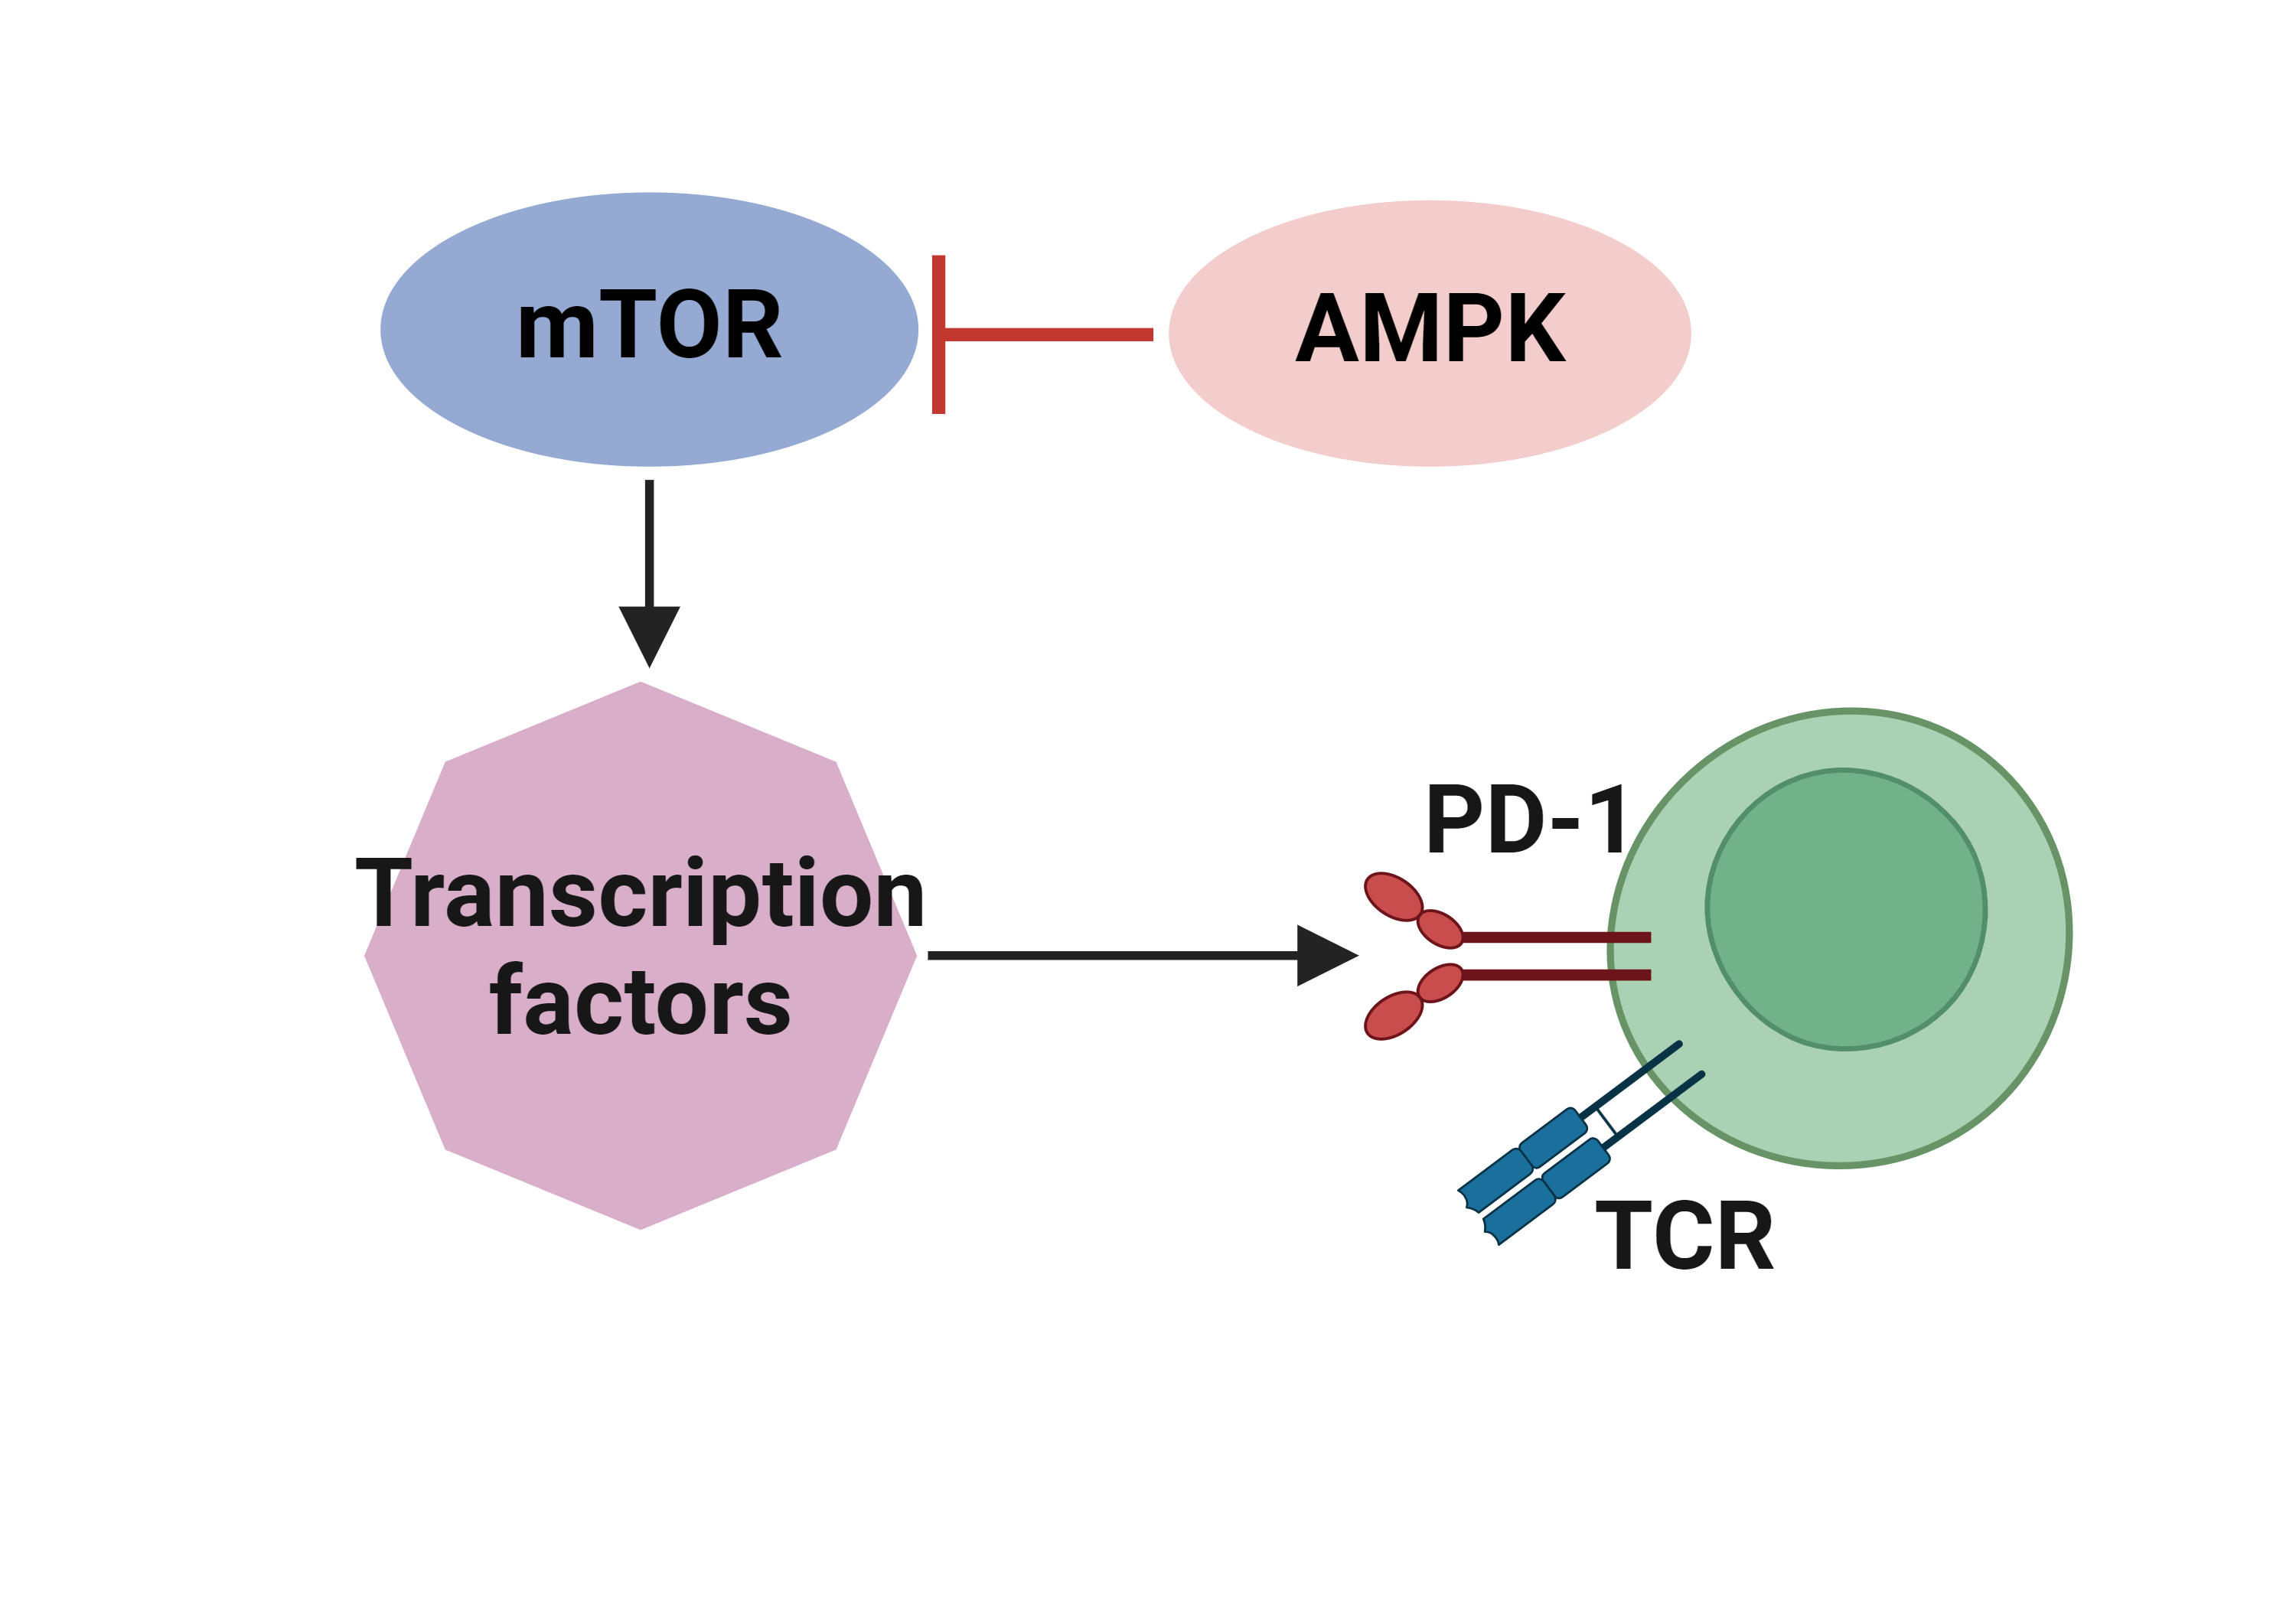
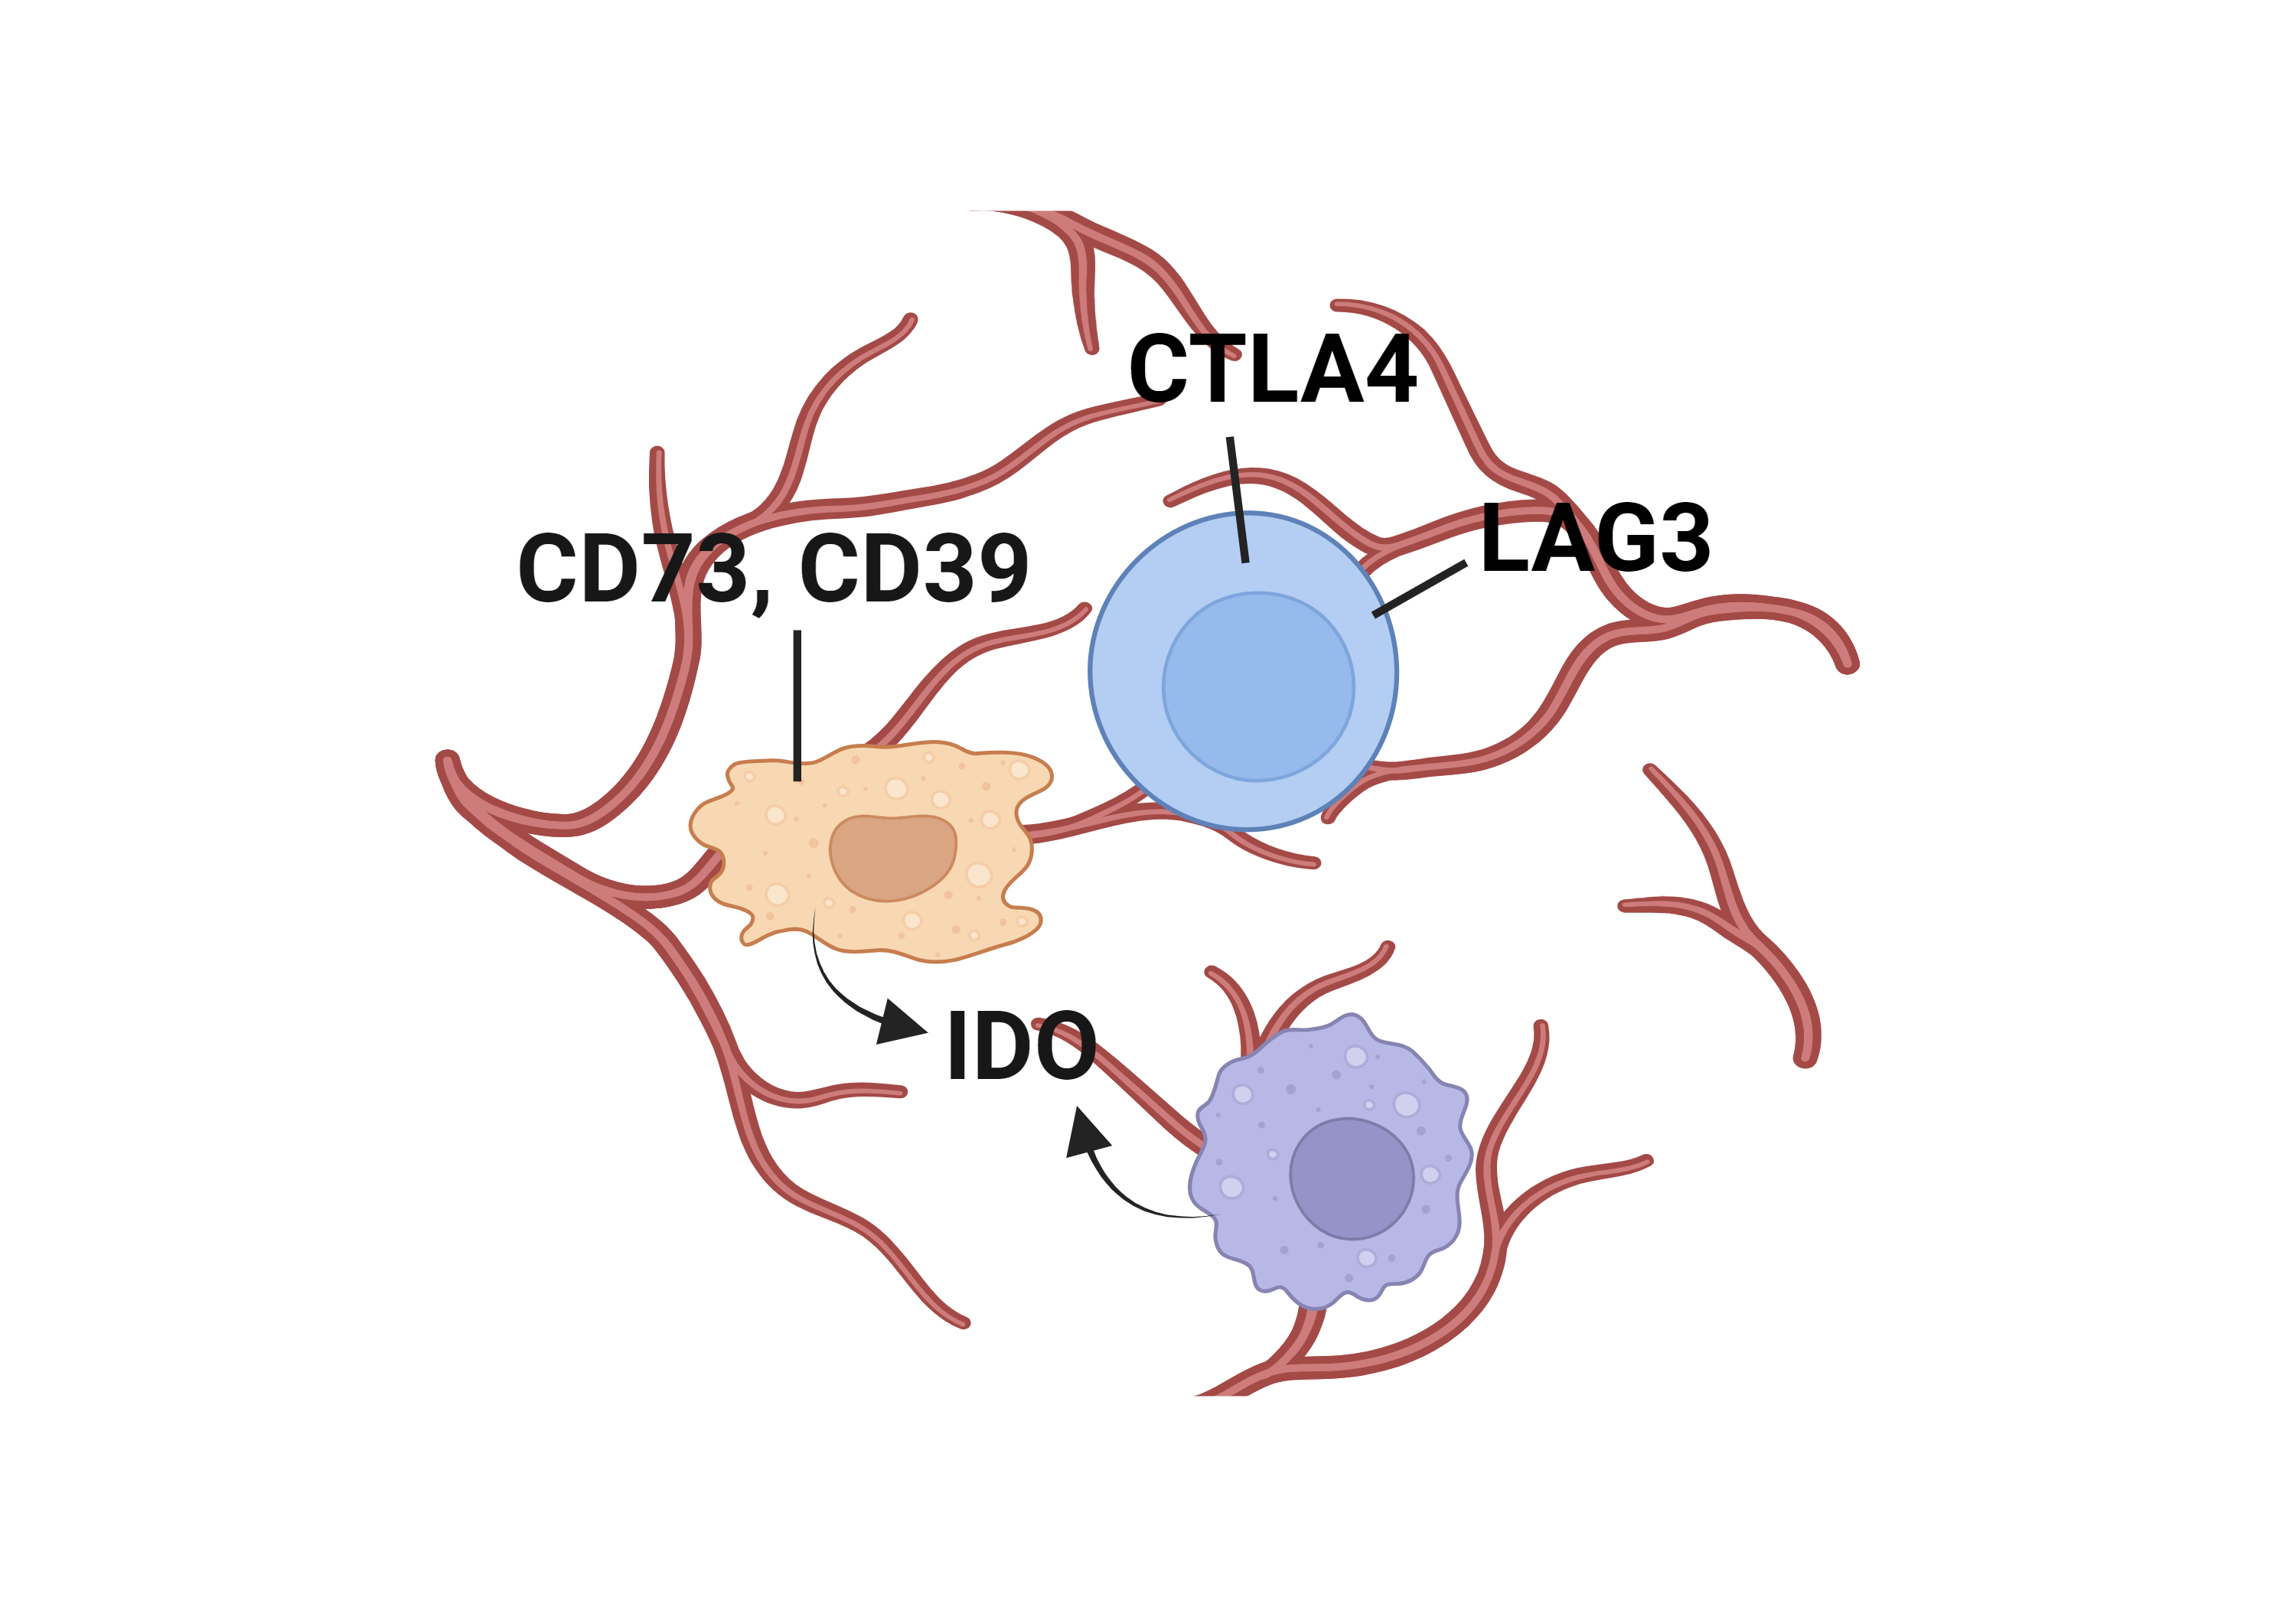
Literatures describing the association of TGFB1 and immune escape mechanisms |
Top |
Comparison of the TGFB1 expression level between tumor and normal groups |
Top |
Comparison of the TGFB1 methylation level between tumor and normal groups |
No significant differences were found in TGFB1 methylation in promoter region.
No significant differences were found in TGFB1 methylation in genebody region.
Top |
Summary of the copy number in TCGA tumor samples |
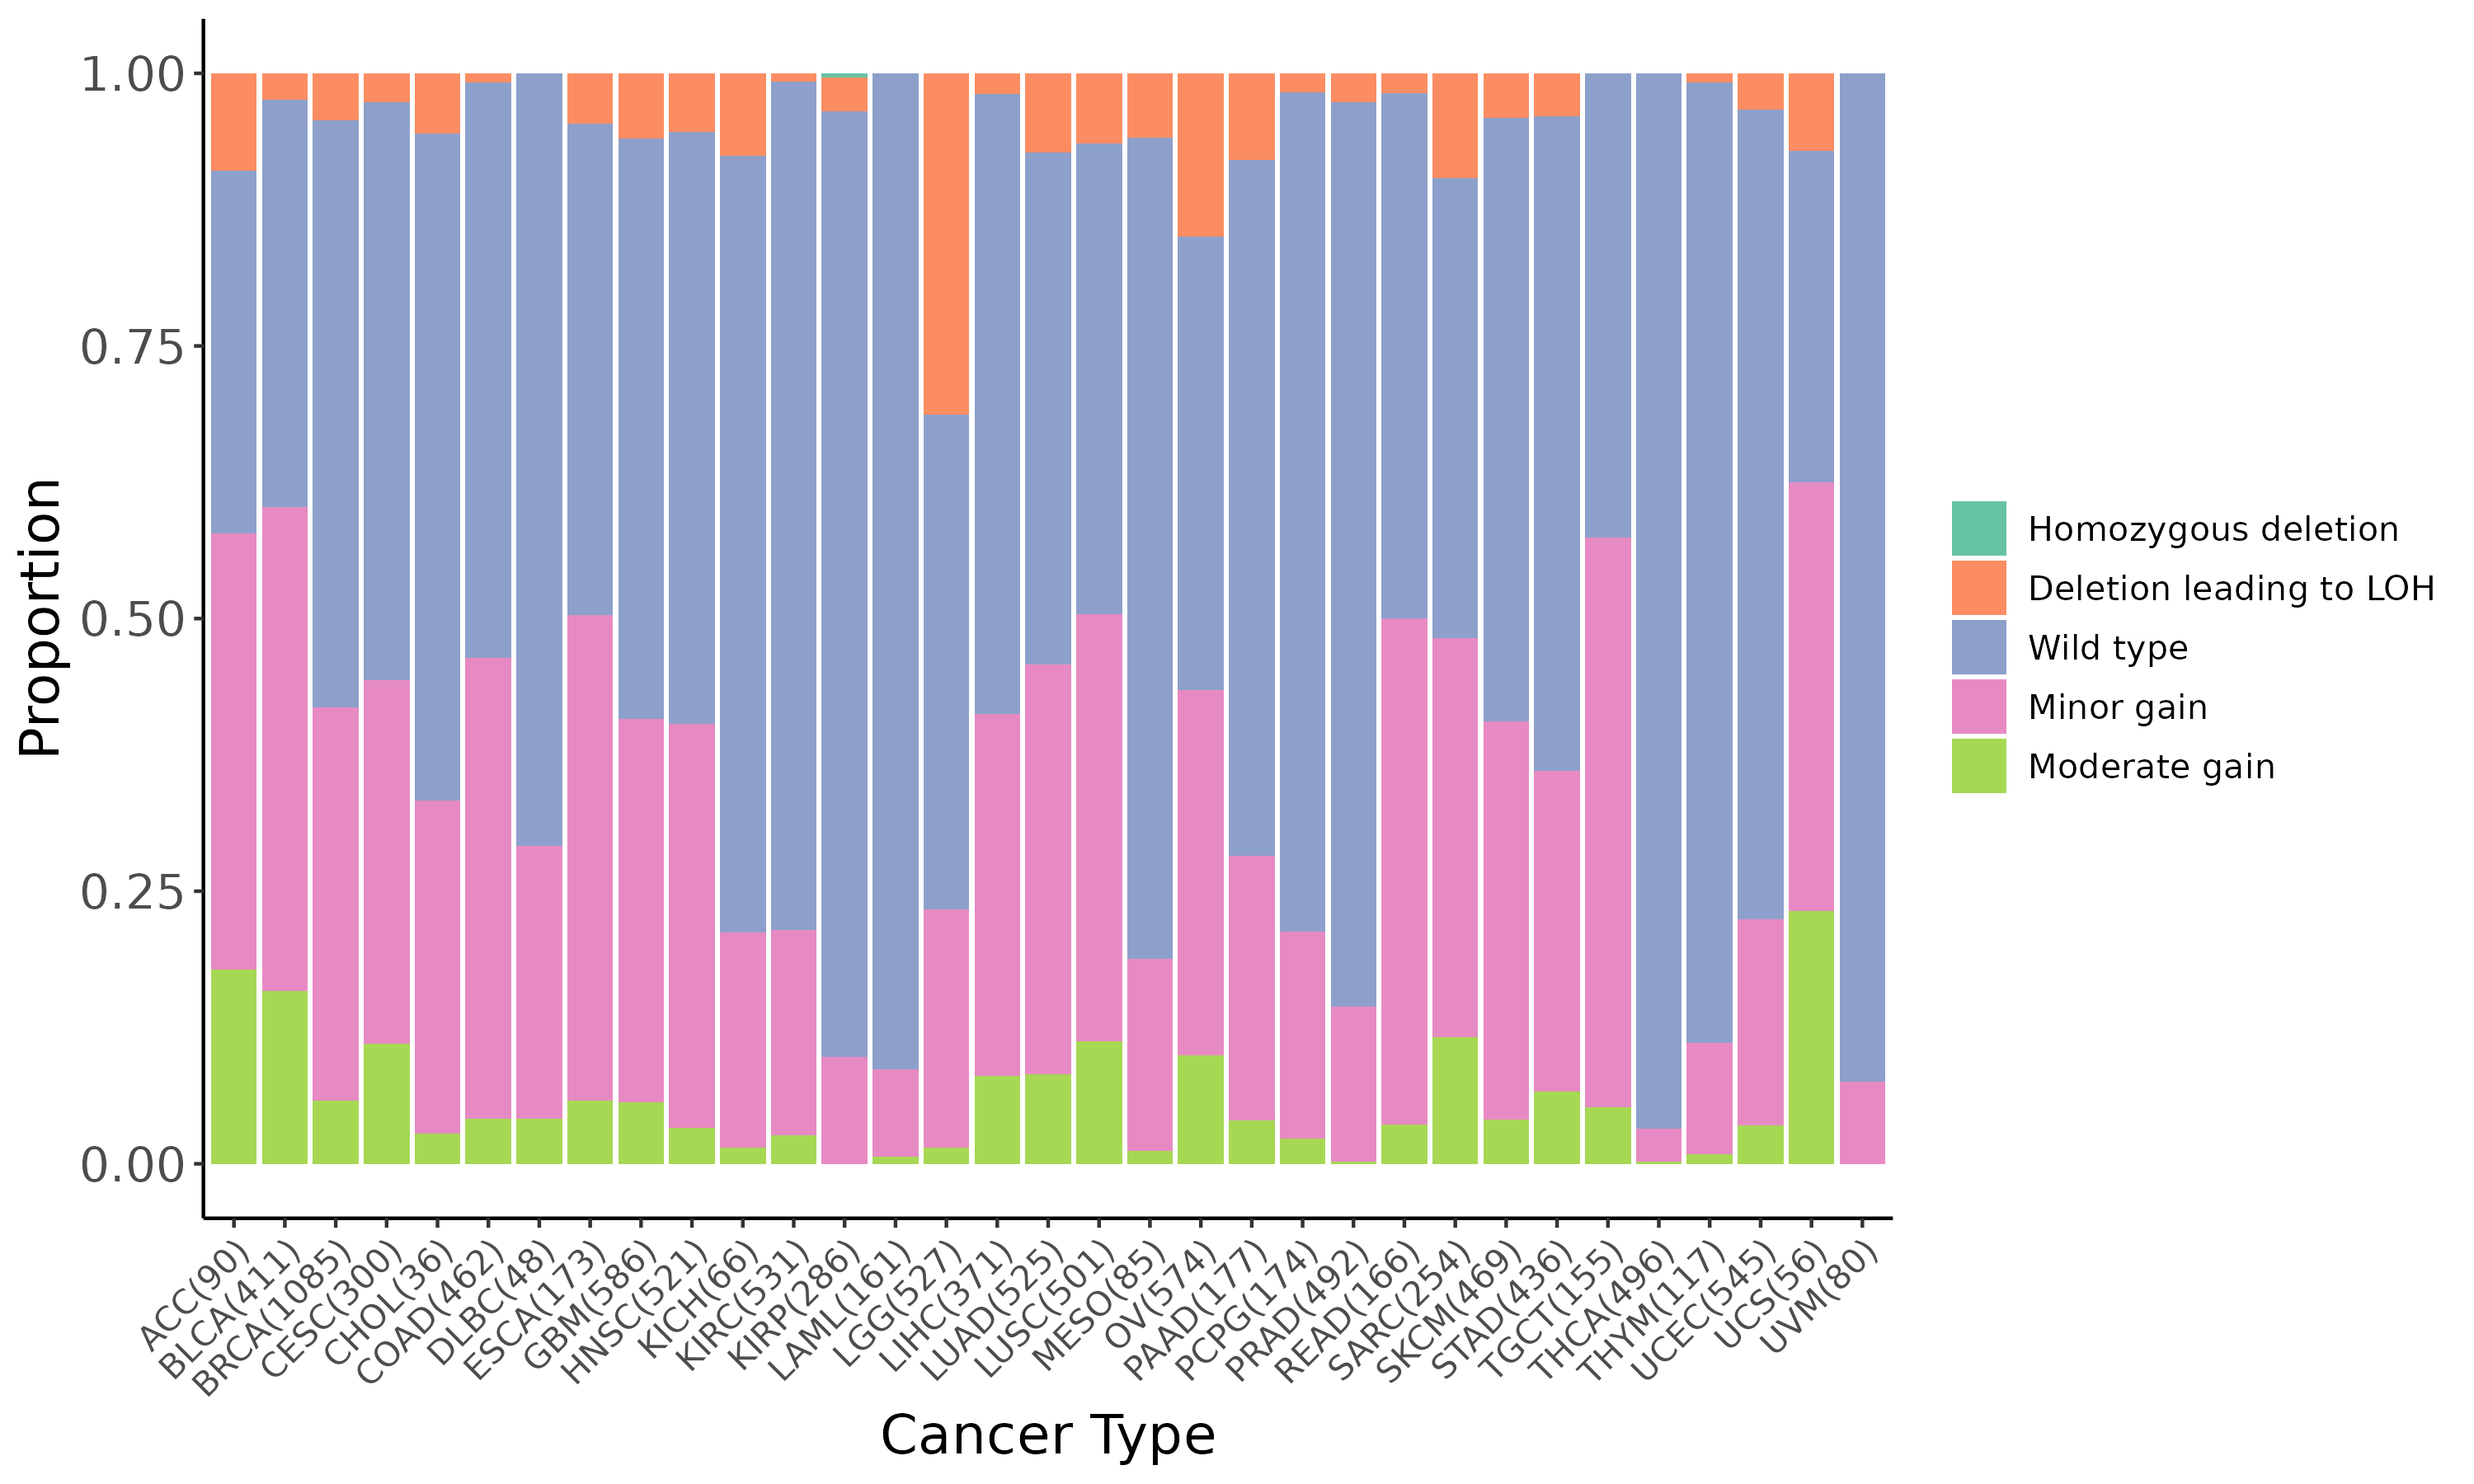 |
Top |
DEGs and the enrichment analysis between the mutated and wild type groups |
| Gene ID | Symbol | Log2 Fold Change | P-value | Adjusted P-value |
|---|---|---|---|---|
| ENSG00000156284 | CLDN8 | -6.80e+00 | 3.74e-04 | 3.95e-02 |
| ENSG00000141316 | SPACA3 | -3.76e+00 | 3.77e-04 | 3.96e-02 |
| ENSG00000188459 | WASF4P | 2.25e+00 | 3.82e-04 | 3.99e-02 |
| ENSG00000204386 | NEU1 | -1.28e+00 | 3.91e-04 | 4.07e-02 |
| ENSG00000225706 | PTPRD-AS1 | -2.70e+00 | 3.92e-04 | 4.07e-02 |
| ENSG00000072195 | SPEG | -2.78e+00 | 3.95e-04 | 4.09e-02 |
| ENSG00000071909 | MYO3B | -2.69e+00 | 3.99e-04 | 4.09e-02 |
| ENSG00000115263 | GCG | -5.17e+00 | 3.98e-04 | 4.09e-02 |
| ENSG00000078328 | RBFOX1 | -4.07e+00 | 4.05e-04 | 4.09e-02 |
| ENSG00000104435 | STMN2 | -2.80e+00 | 4.05e-04 | 4.09e-02 |
| ENSG00000112902 | SEMA5A | -1.67e+00 | 4.03e-04 | 4.09e-02 |
| ENSG00000214417 | KRT18P13 | 2.12e+00 | 4.05e-04 | 4.09e-02 |
| ENSG00000048540 | LMO3 | -3.00e+00 | 4.07e-04 | 4.10e-02 |
| ENSG00000156298 | TSPAN7 | -1.94e+00 | 4.16e-04 | 4.16e-02 |
| ENSG00000163435 | ELF3 | -1.05e+00 | 4.17e-04 | 4.16e-02 |
| ENSG00000113805 | CNTN3 | -3.17e+00 | 4.24e-04 | 4.21e-02 |
| ENSG00000185915 | KLHL34 | -4.35e+00 | 4.25e-04 | 4.21e-02 |
| ENSG00000164326 | CARTPT | -5.63e+00 | 4.31e-04 | 4.25e-02 |
| ENSG00000241635 | UGT1A1 | -2.79e+00 | 4.36e-04 | 4.29e-02 |
| ENSG00000234678 | RP11-465N4.4 | -1.04e+00 | 4.41e-04 | 4.31e-02 |
| Page: 1 2 ... 10 11 12 13 14 ... 14 15 |
Down-regulated KEGG pathways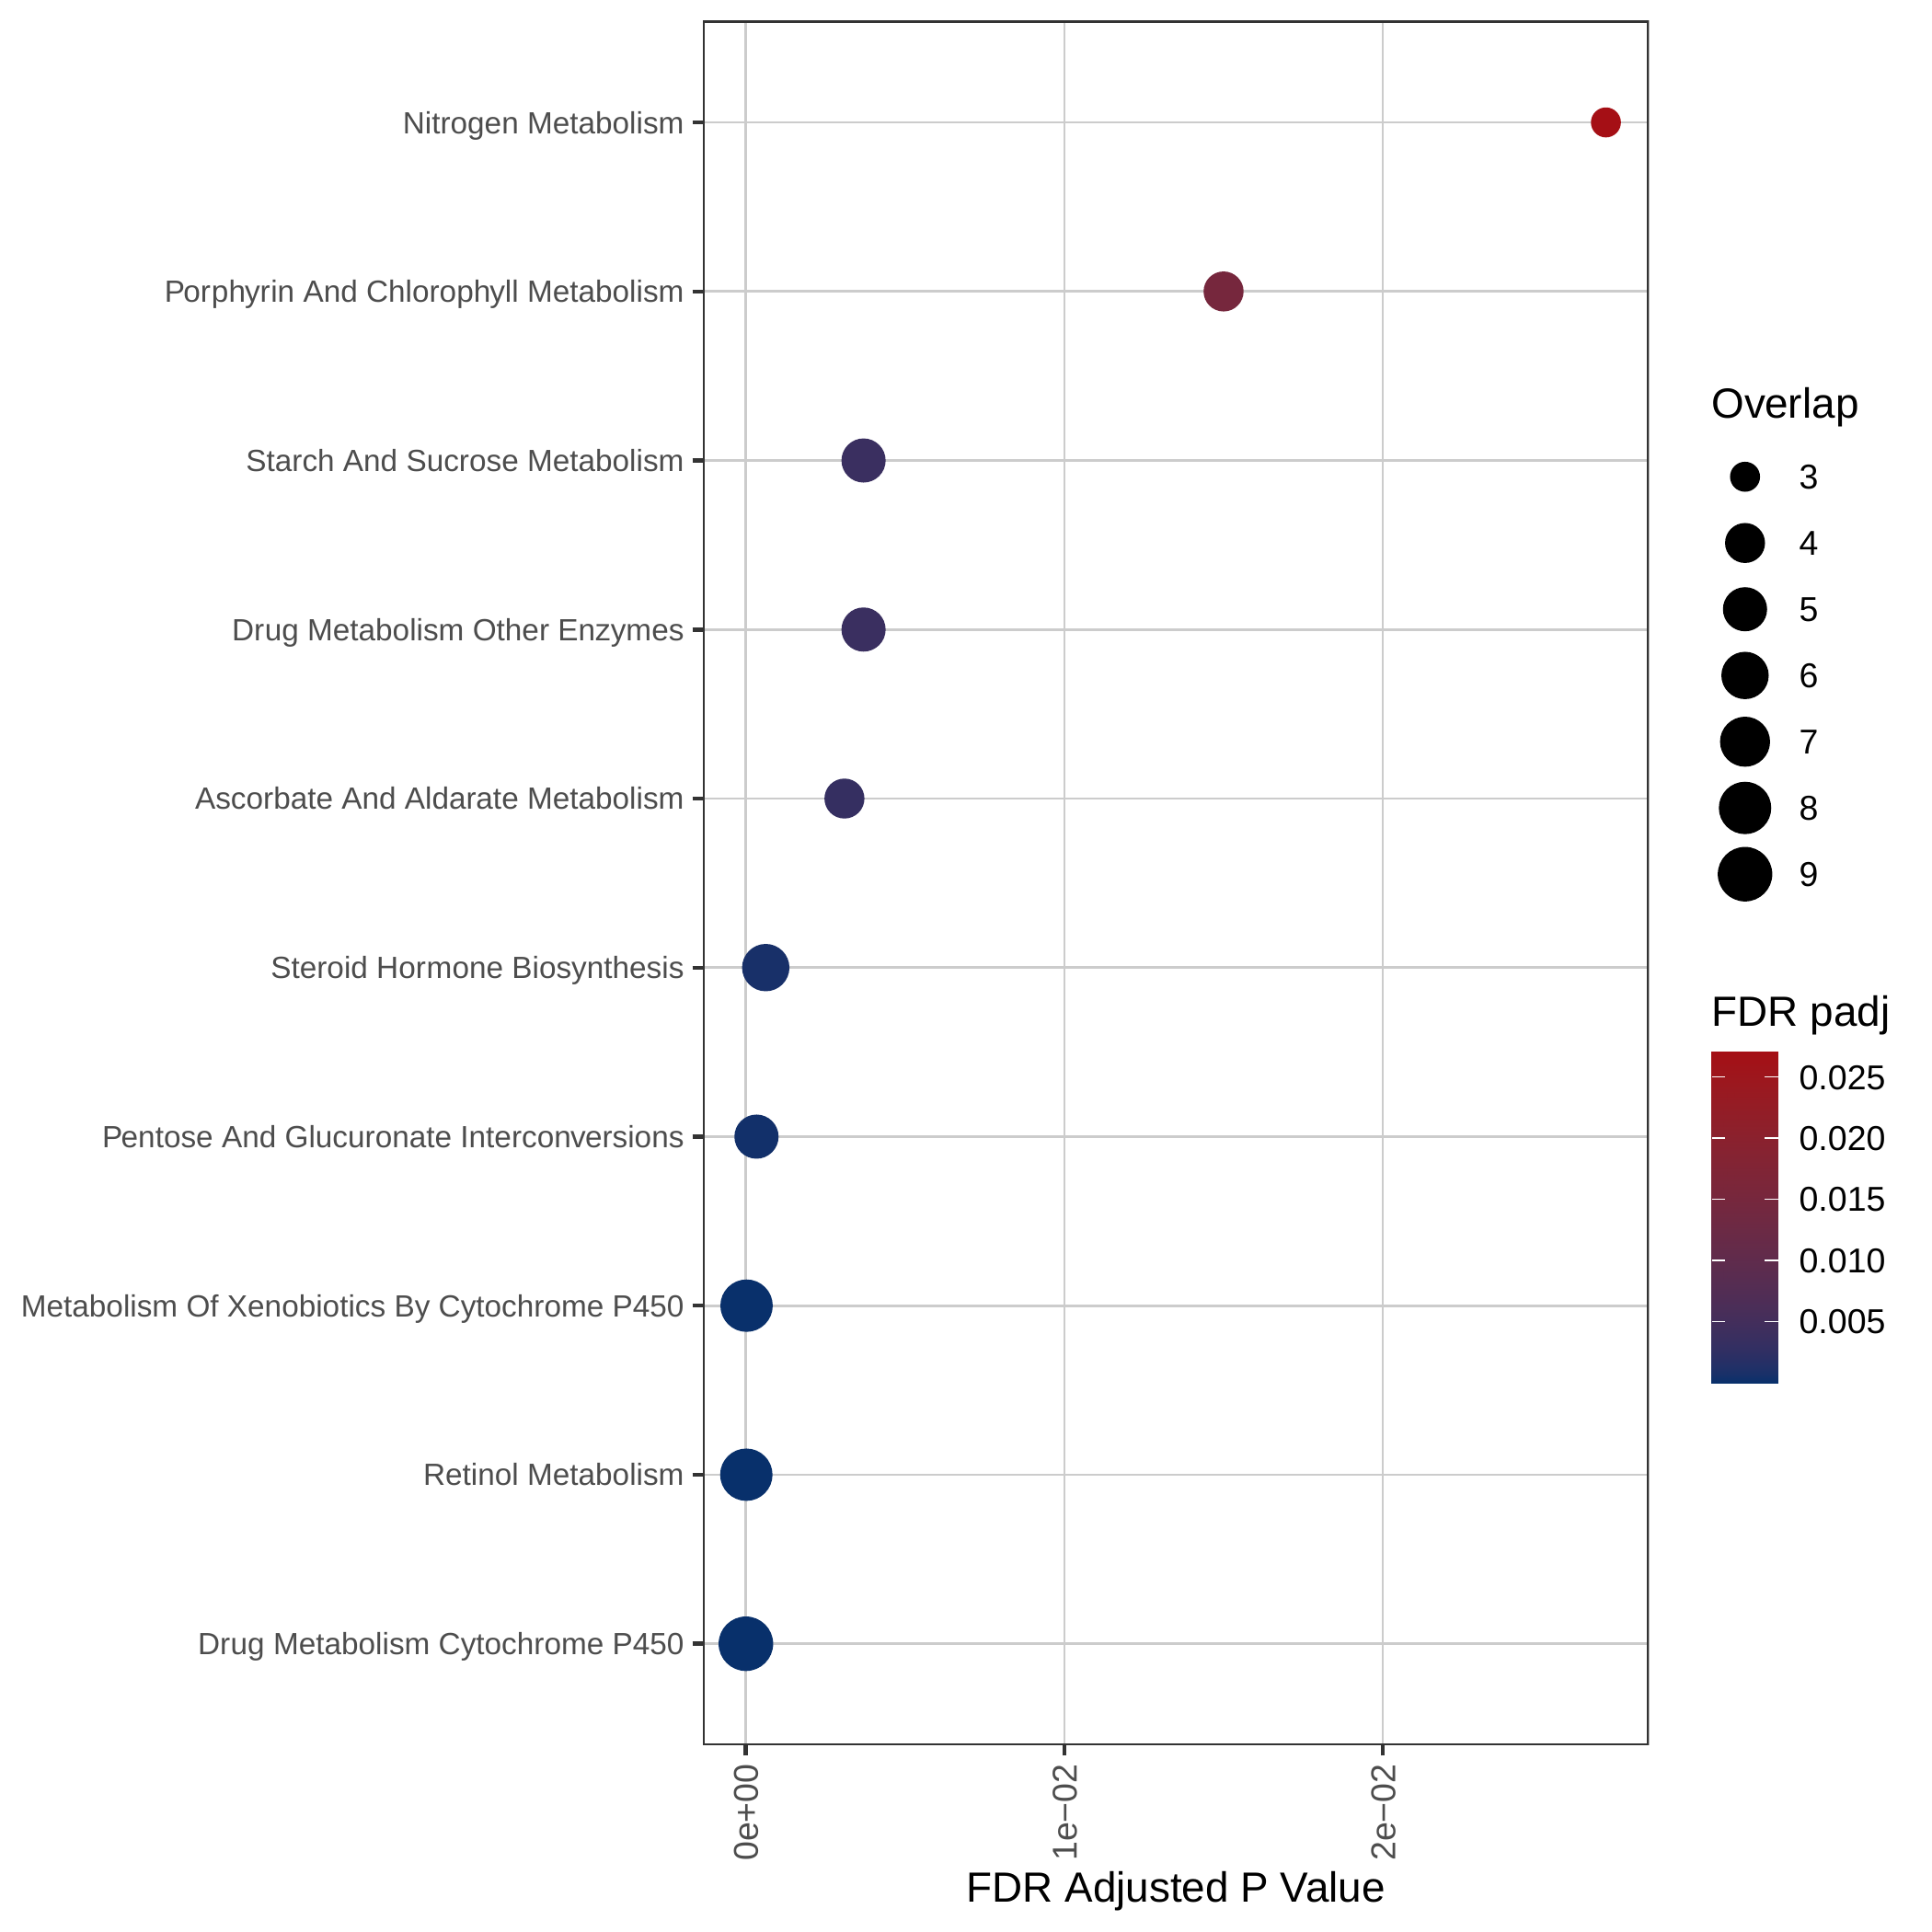 | Down-regulated GOBP pathways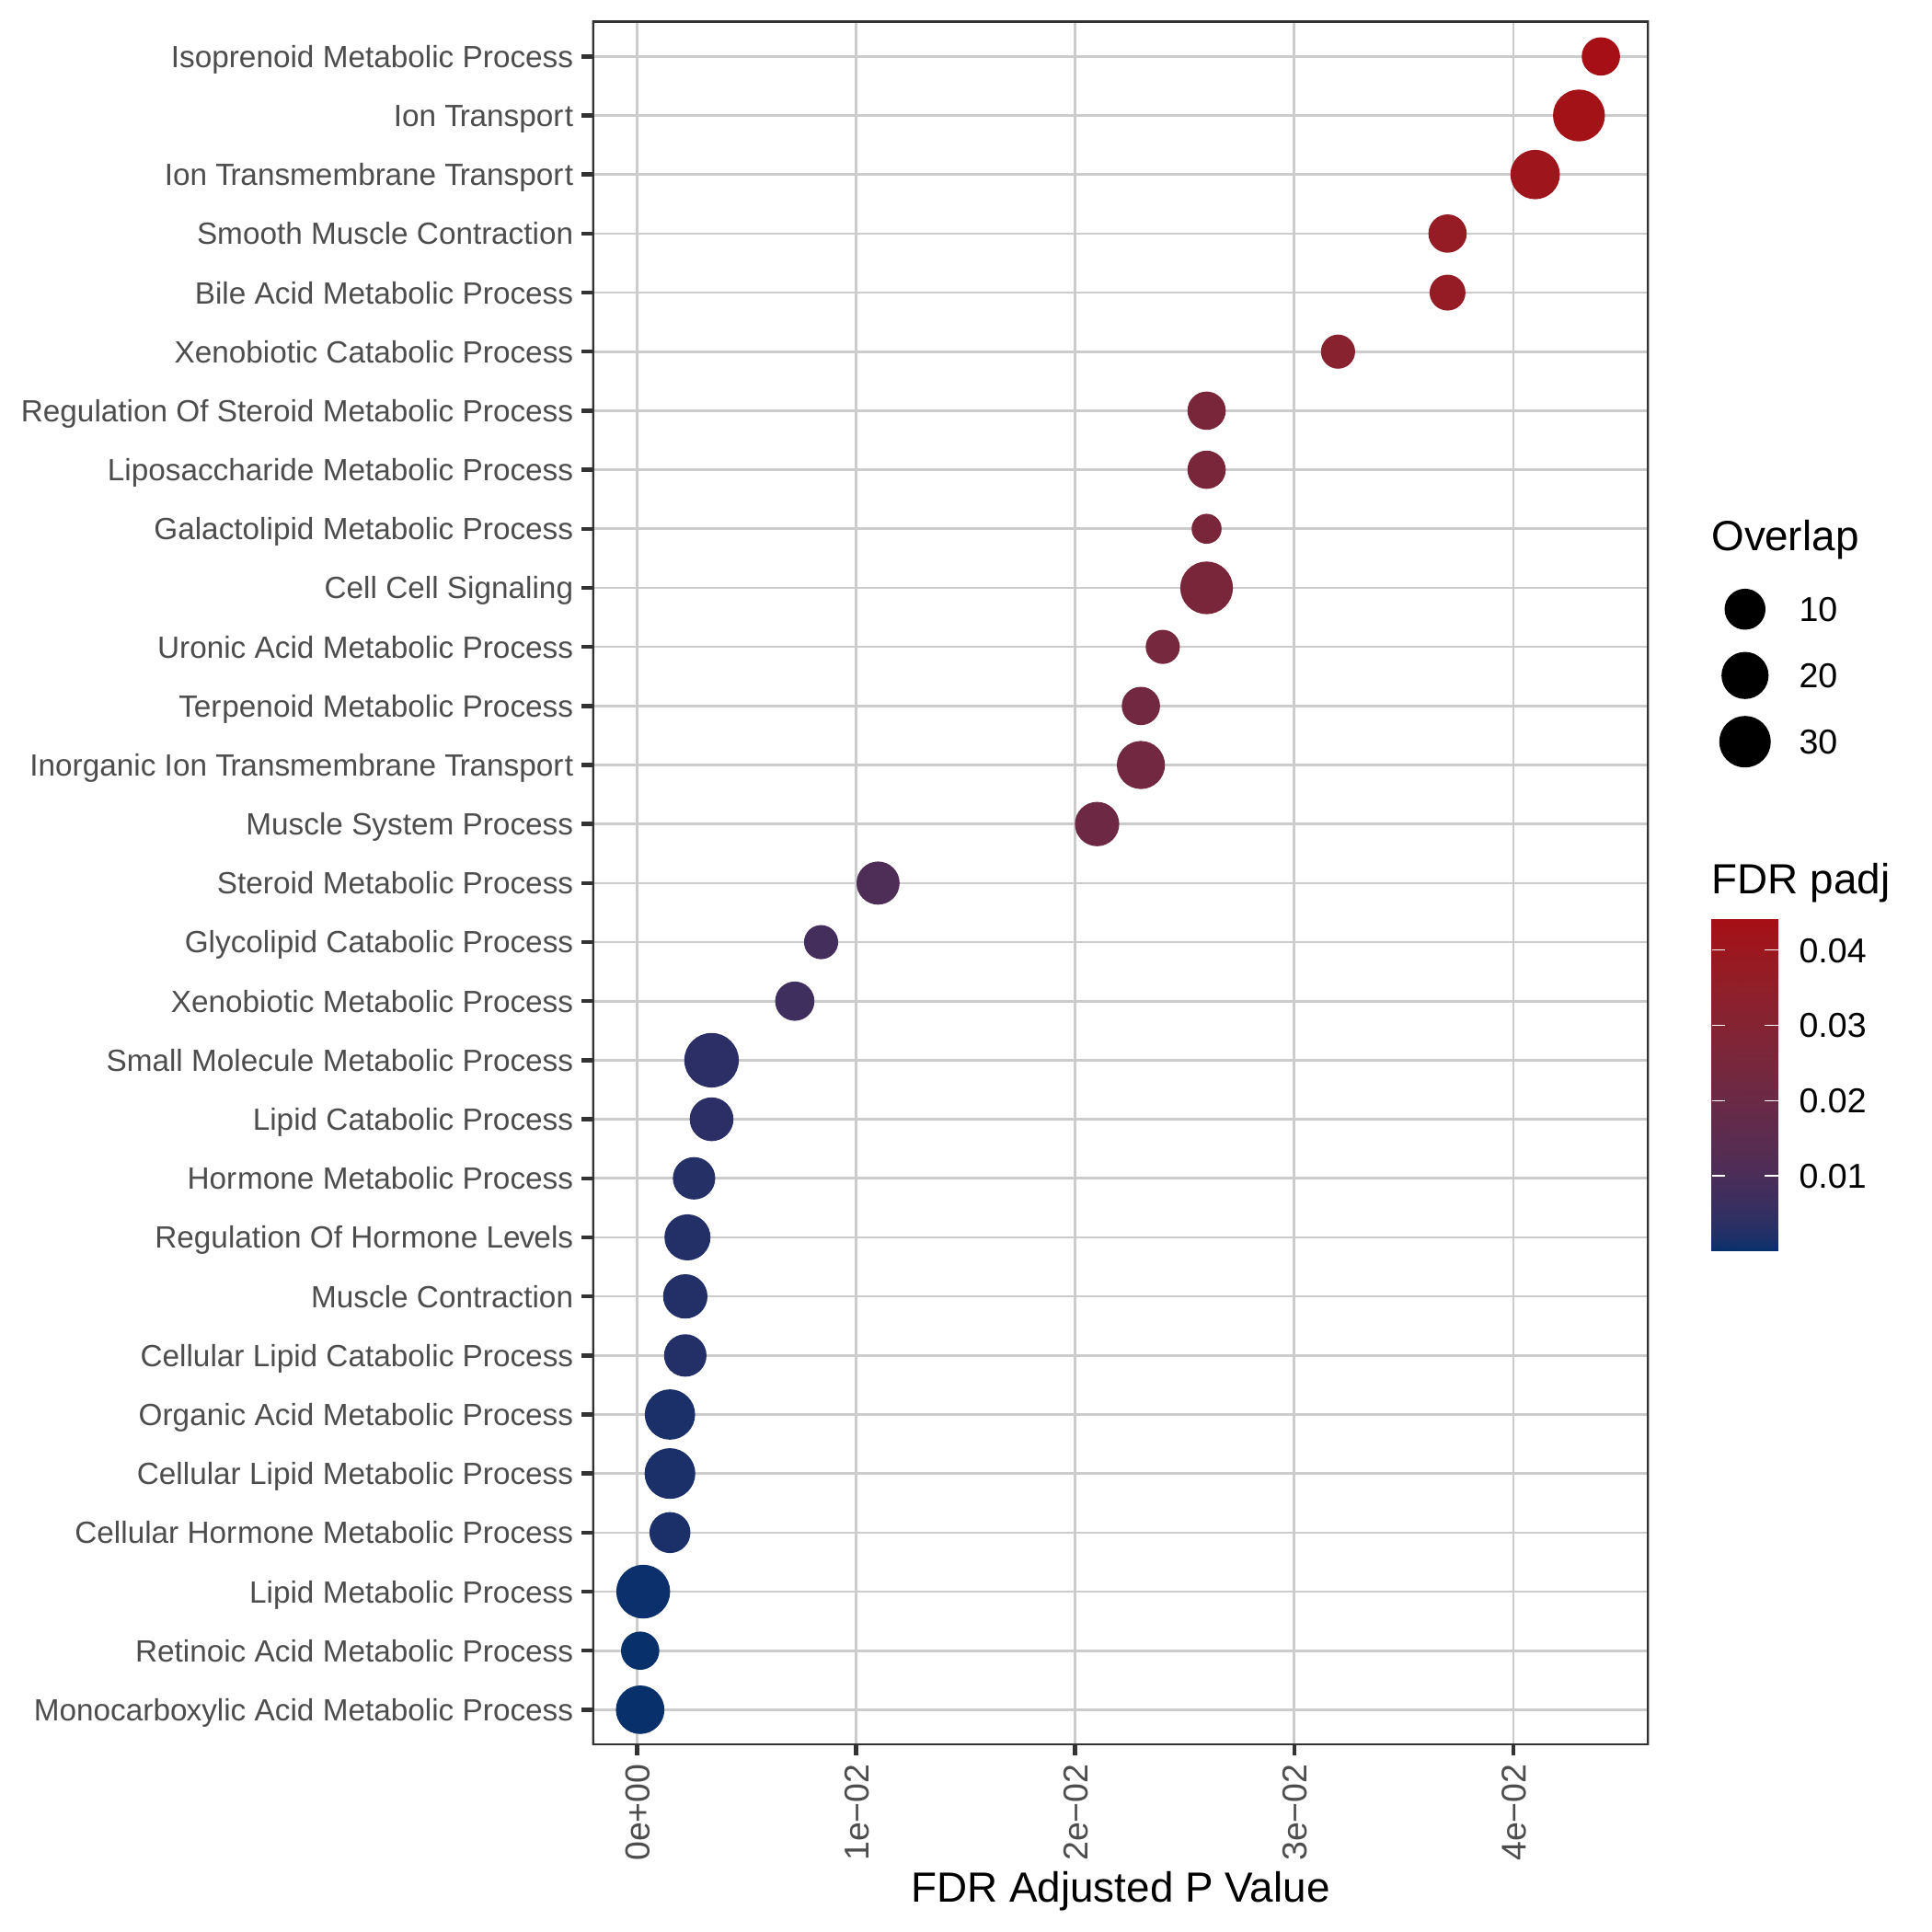 | Down-regulated Hallmark pathways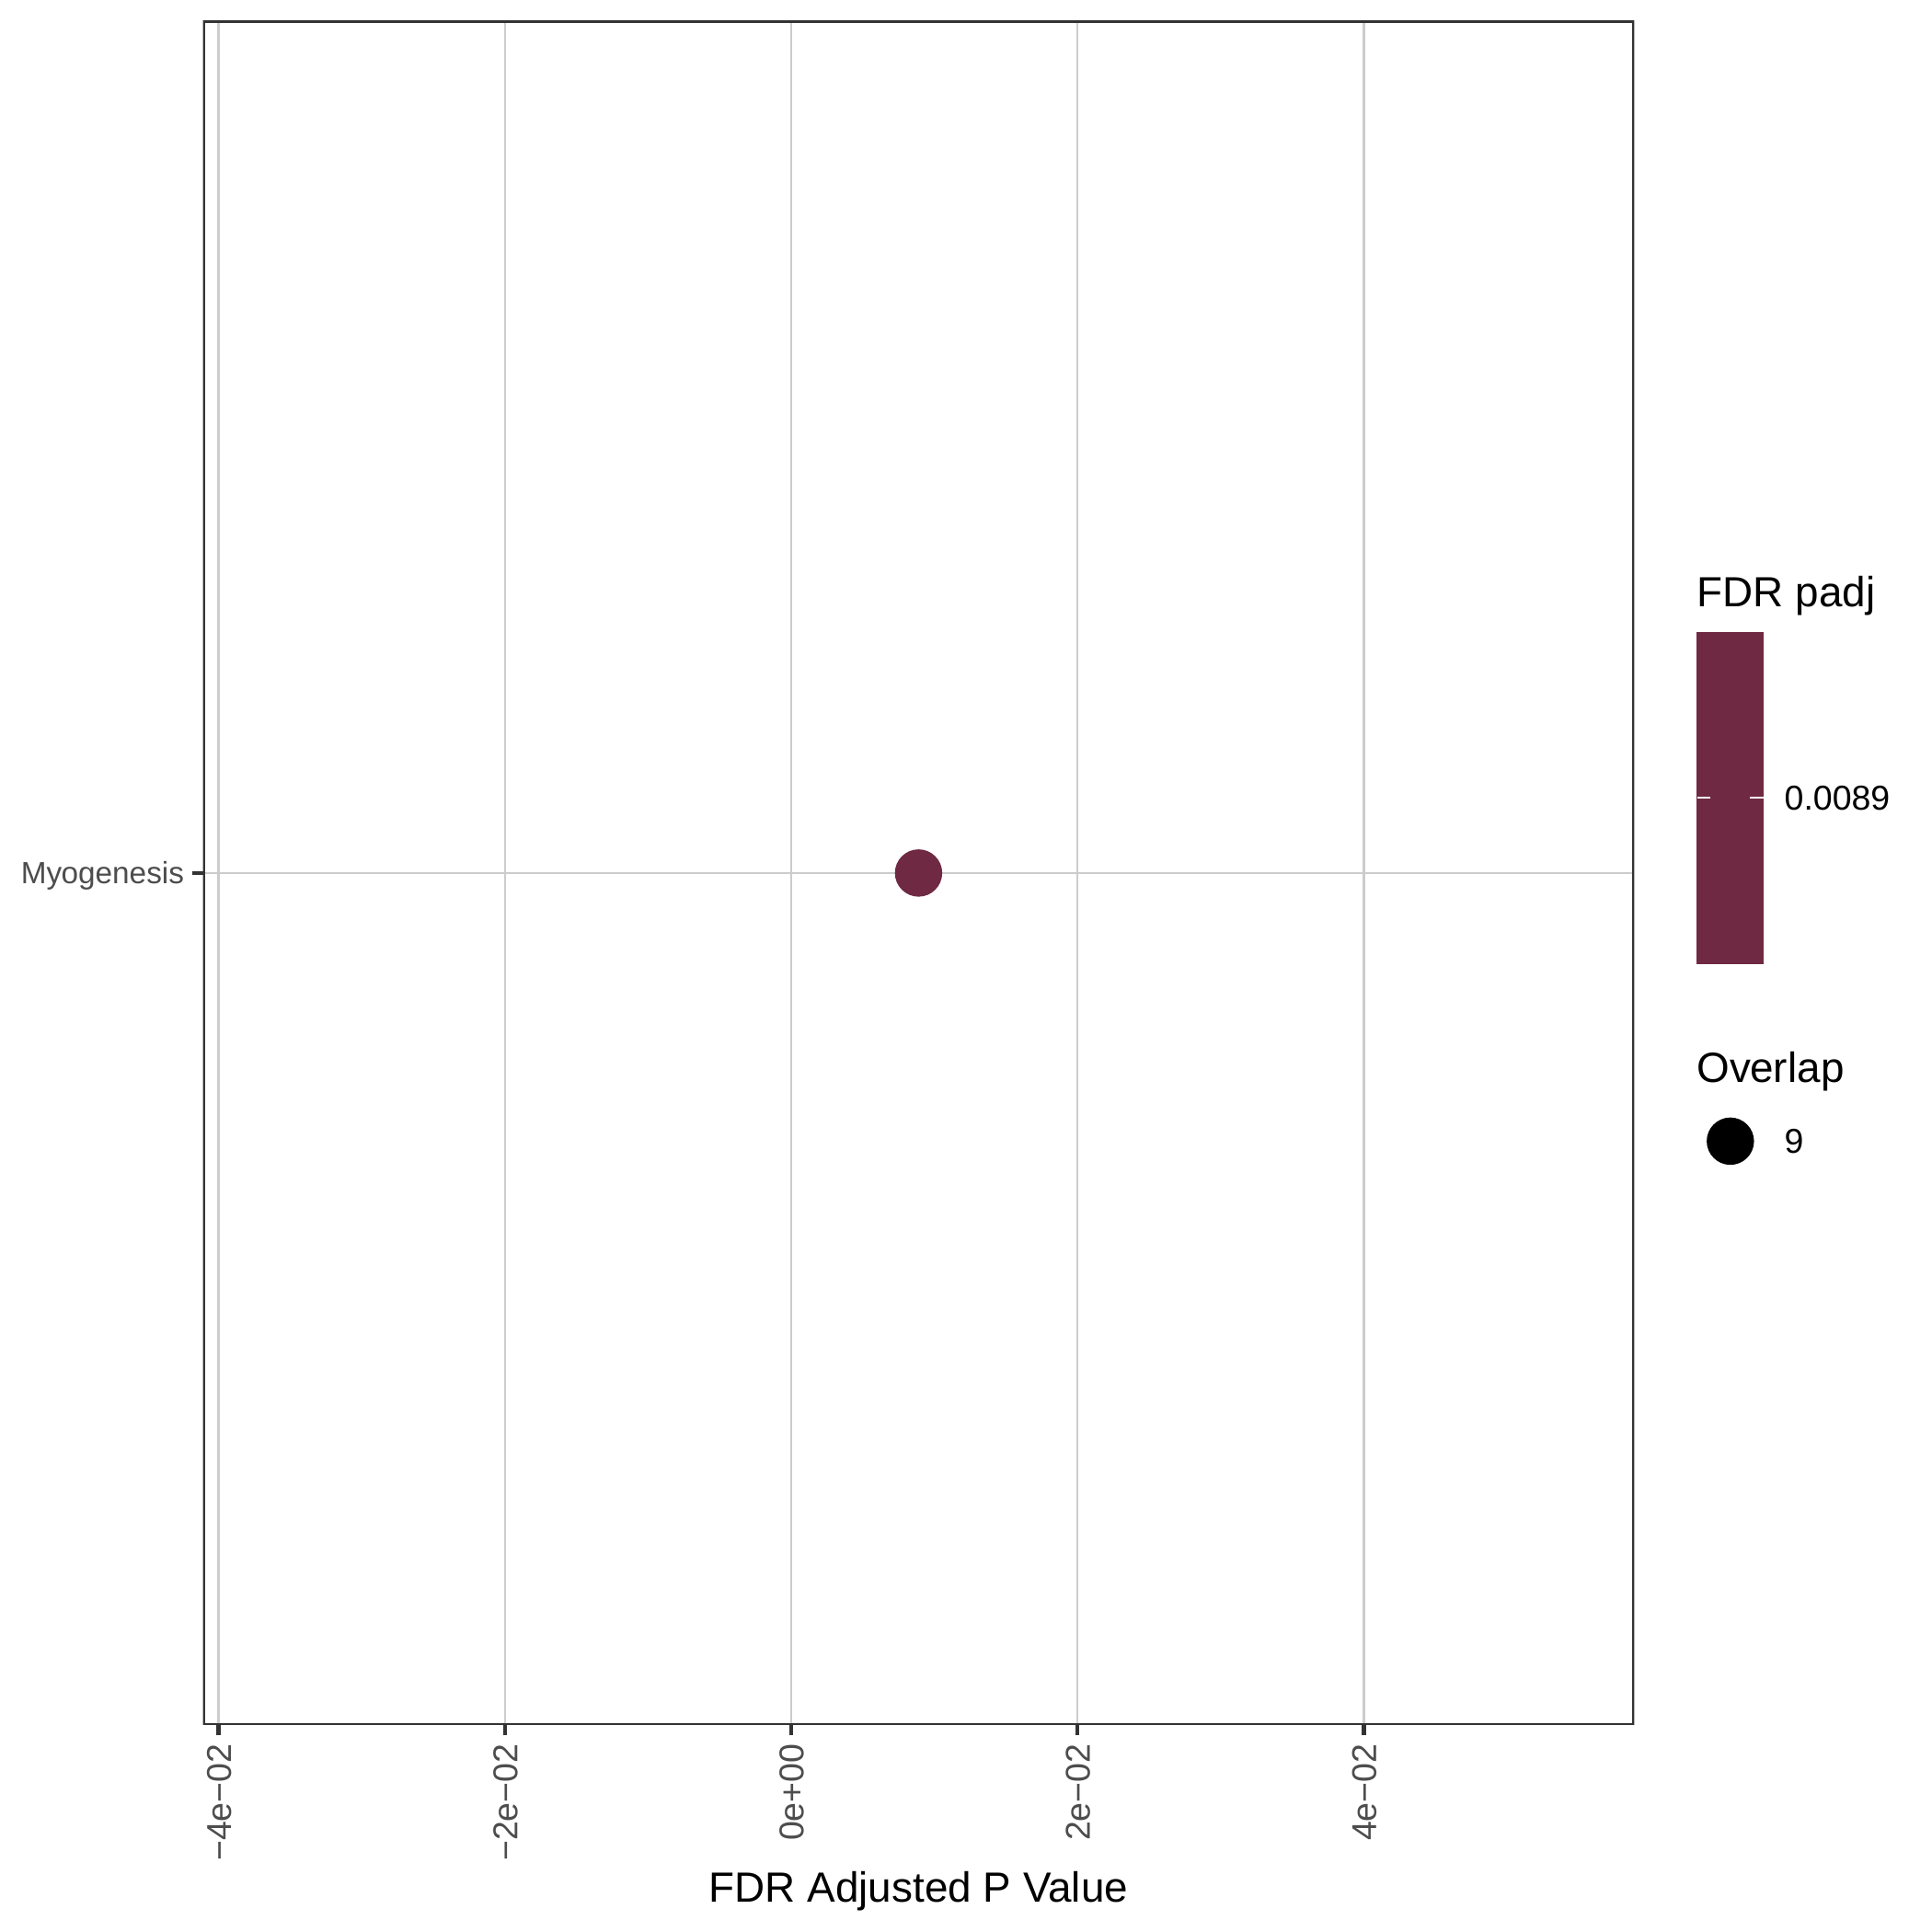 |
Gene expression and mutation differences between non-responders and responders after immunotherapy |
| Expression | Mutation |
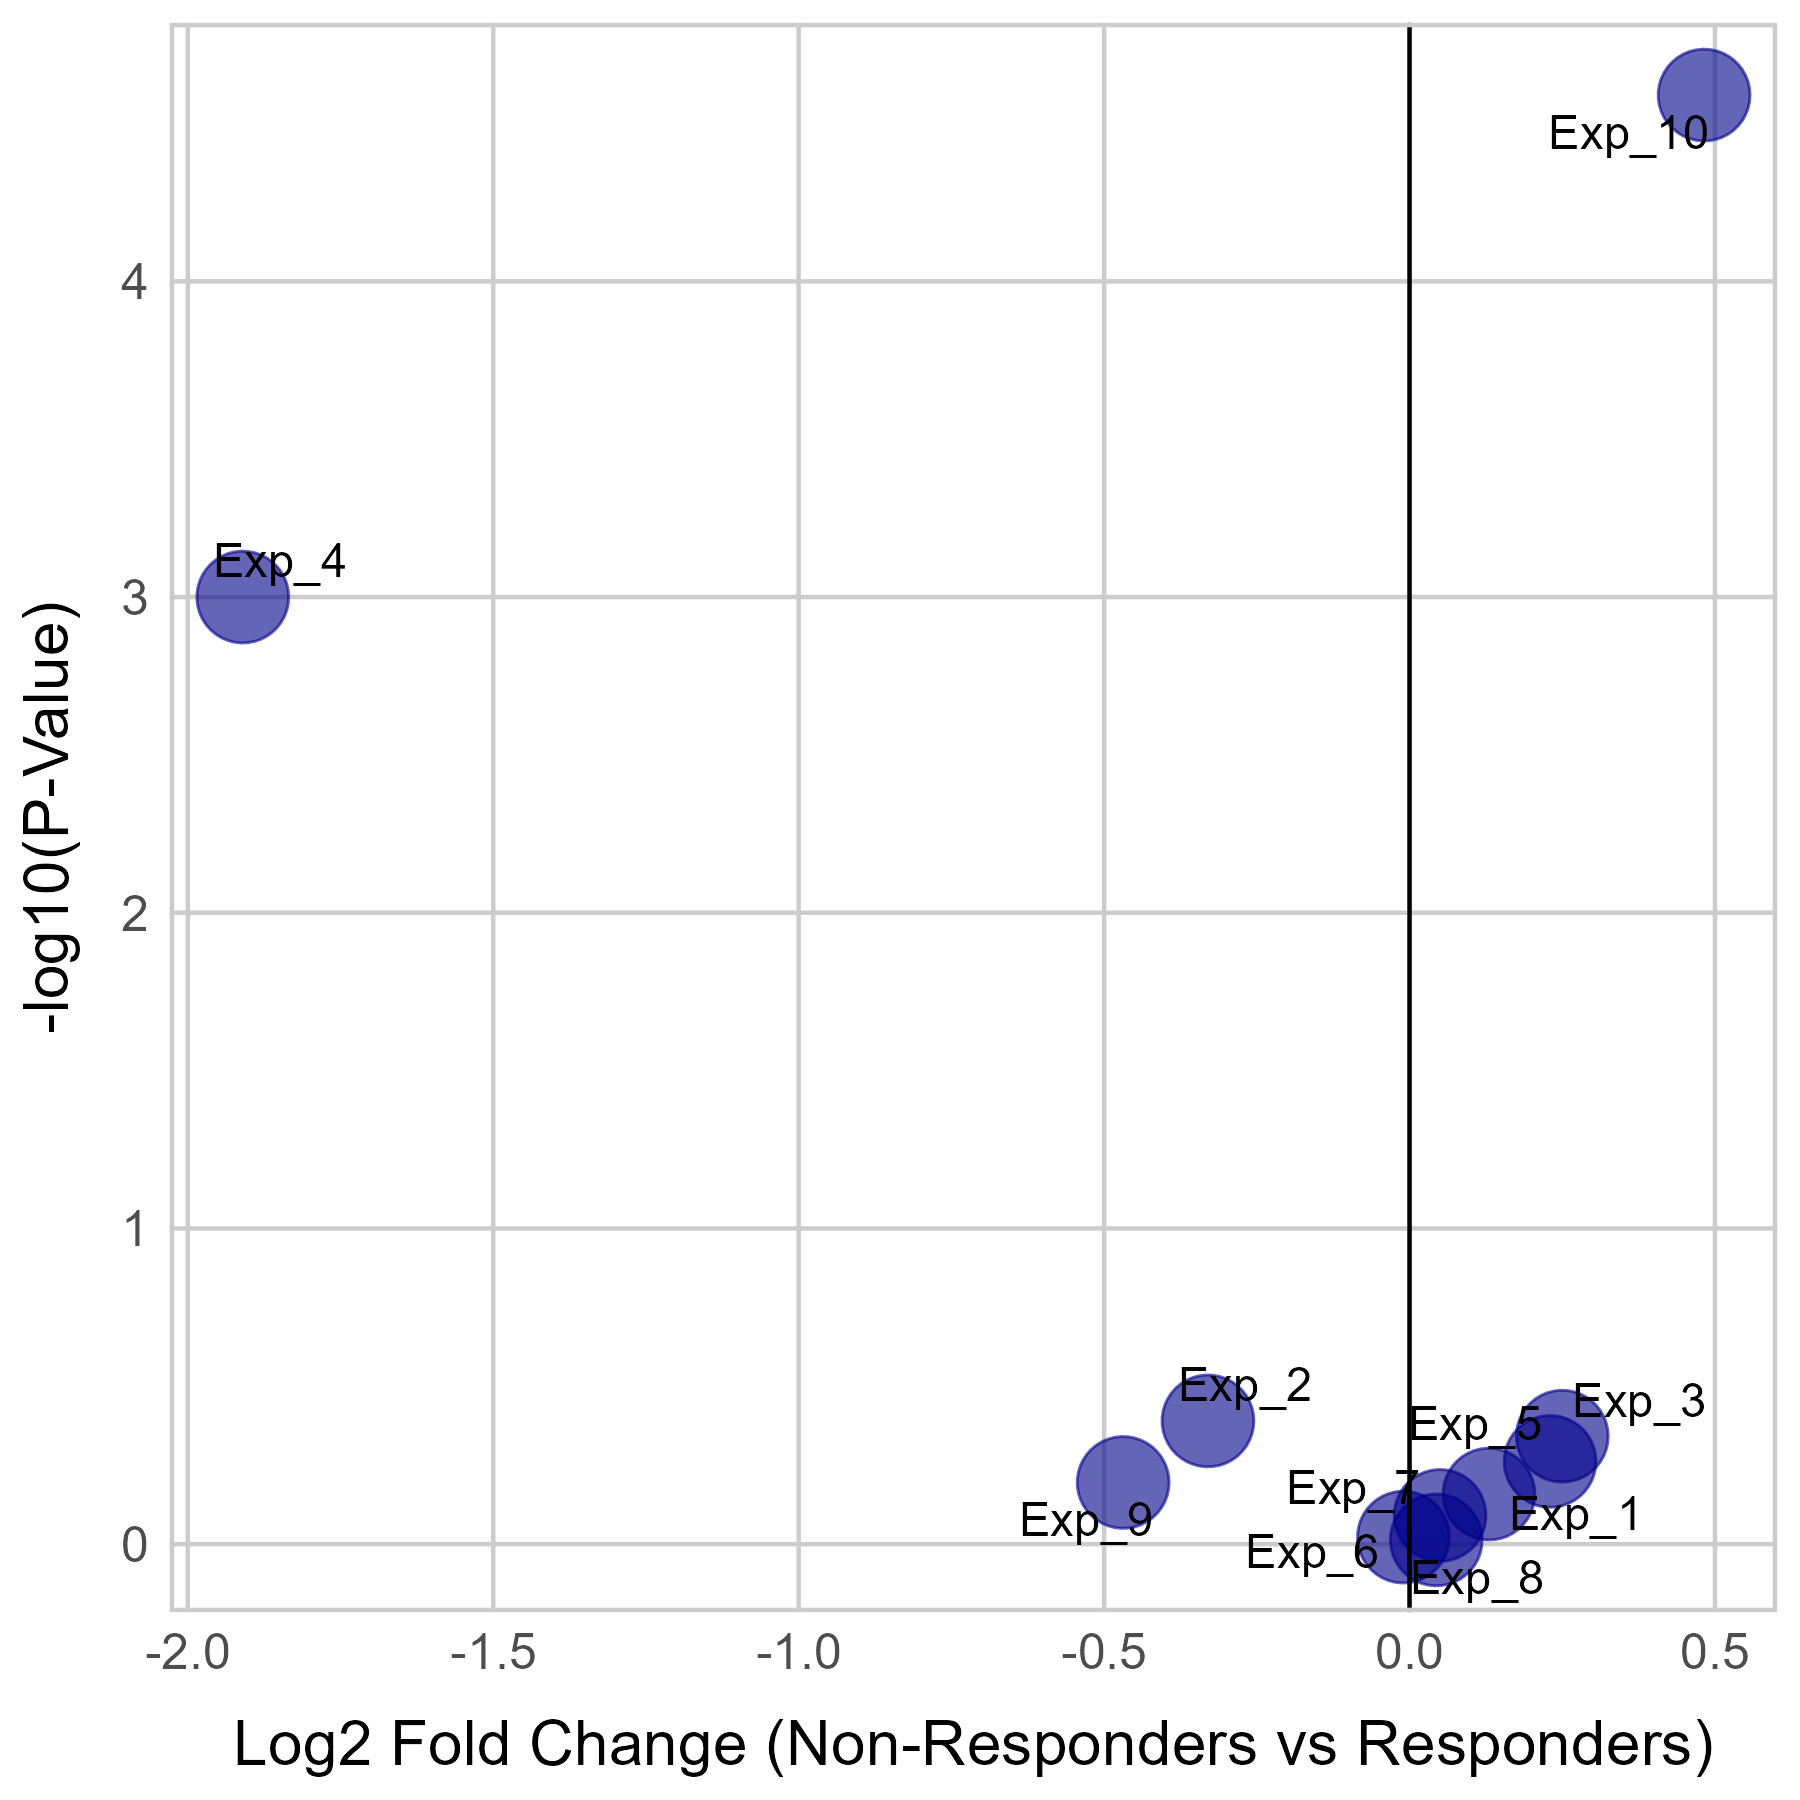 | 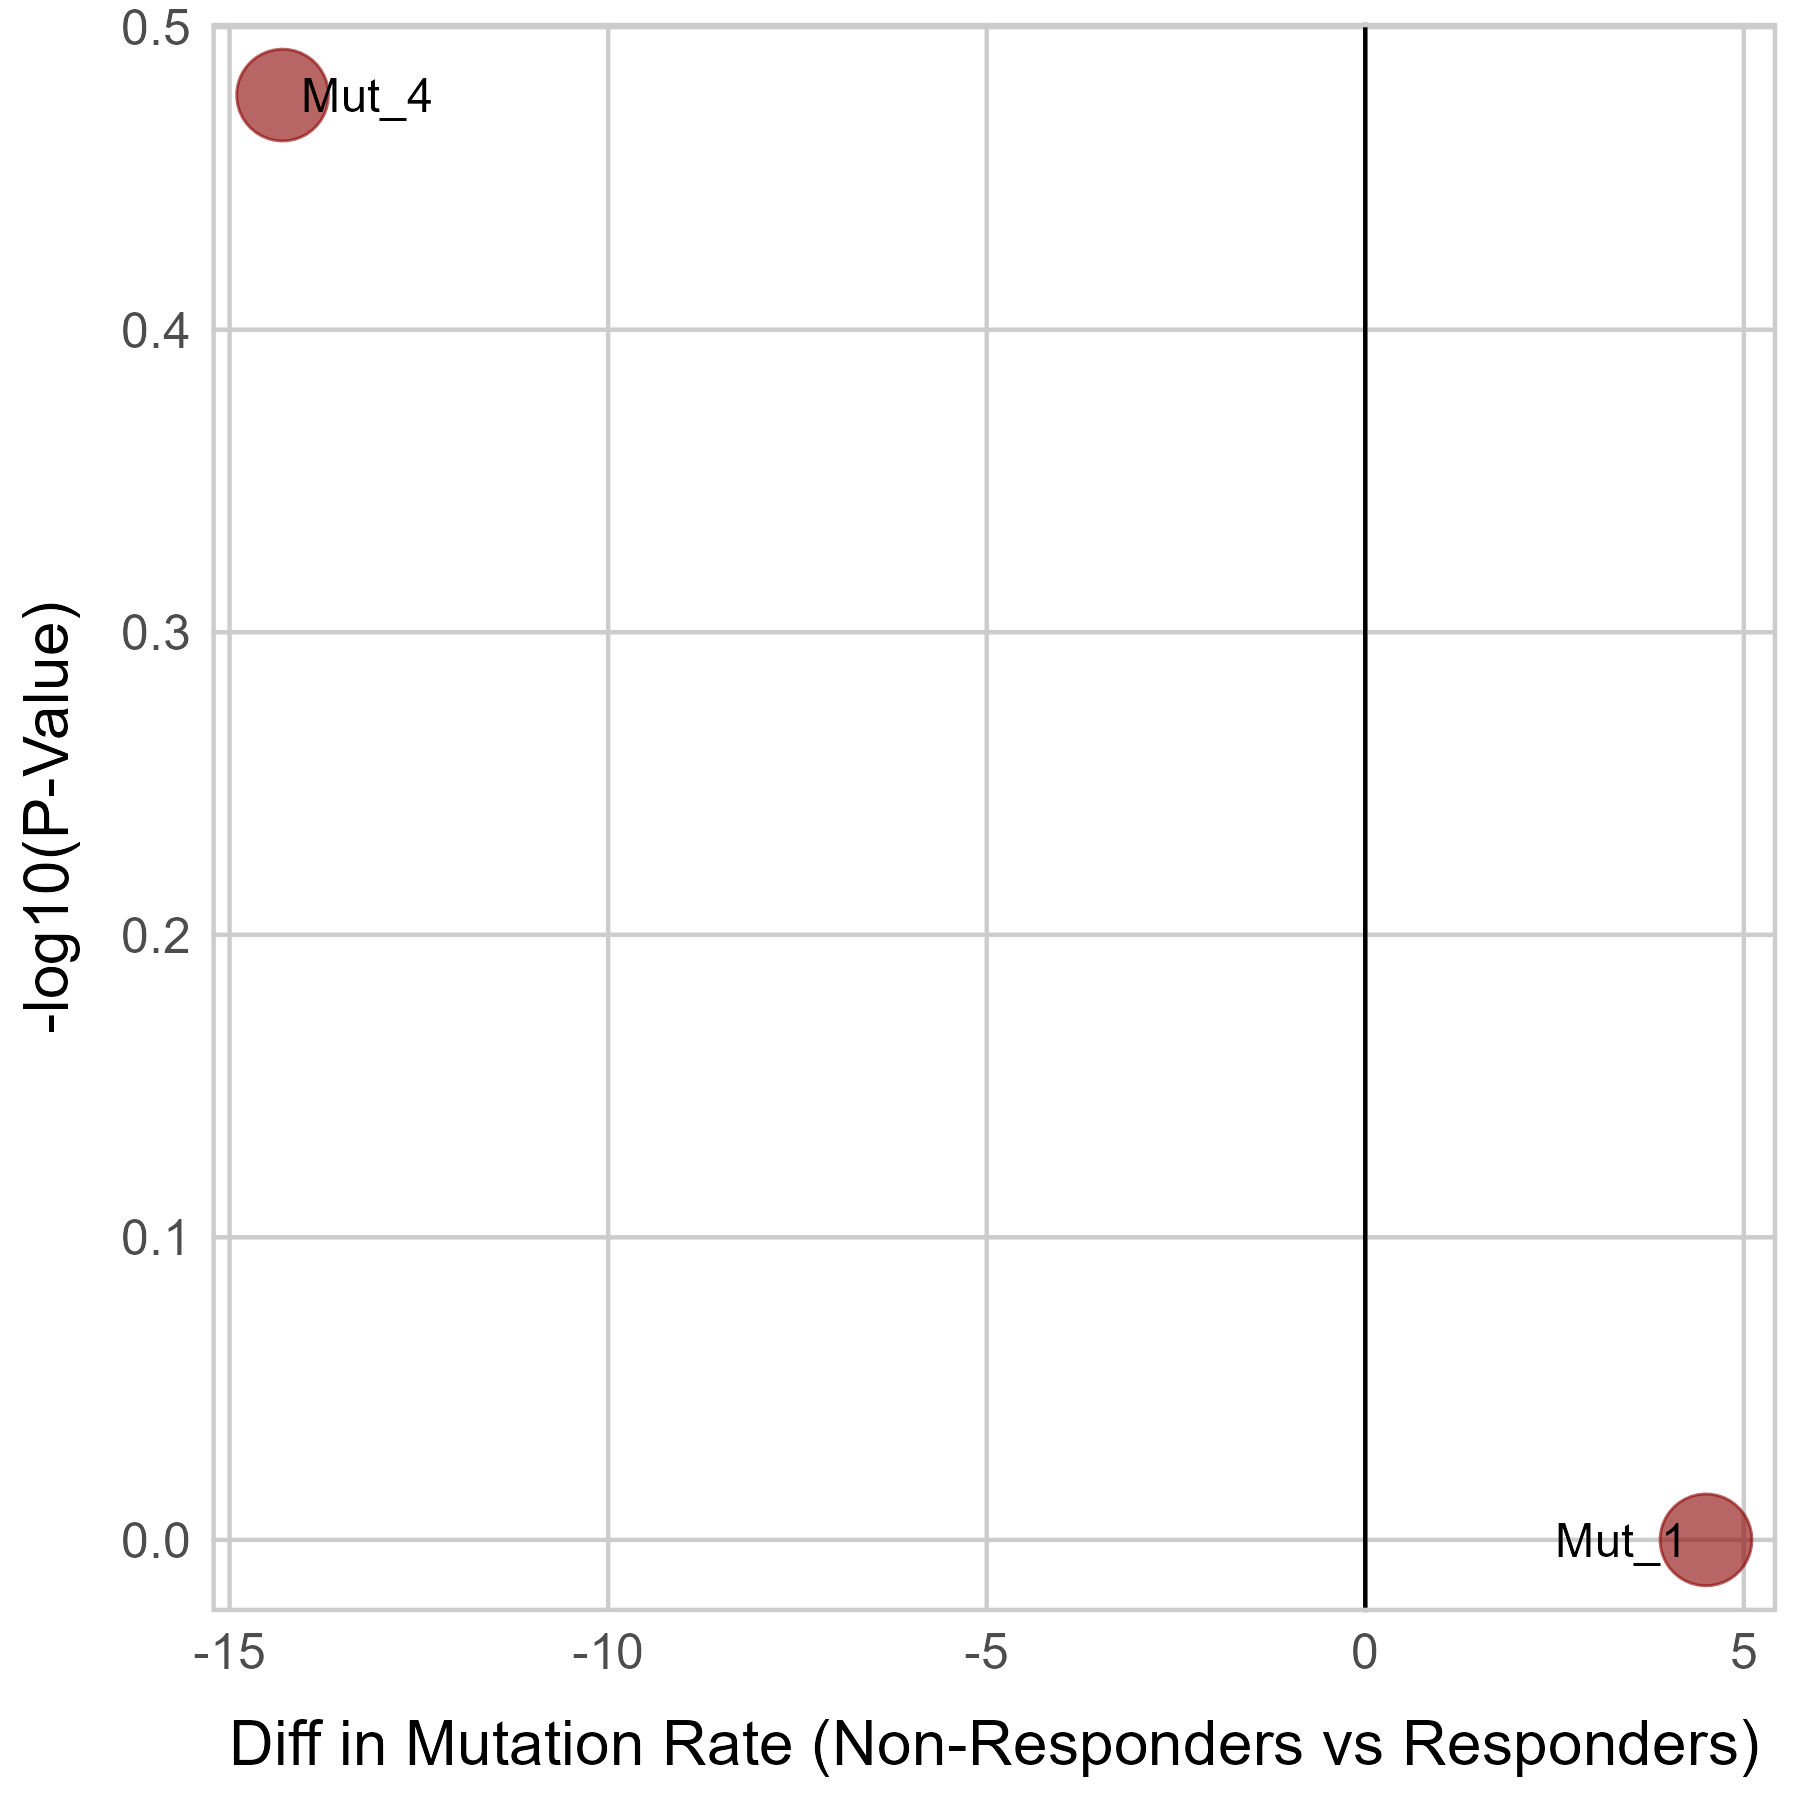 |
No significant differences were found in TGFB1 mutation.
Top |
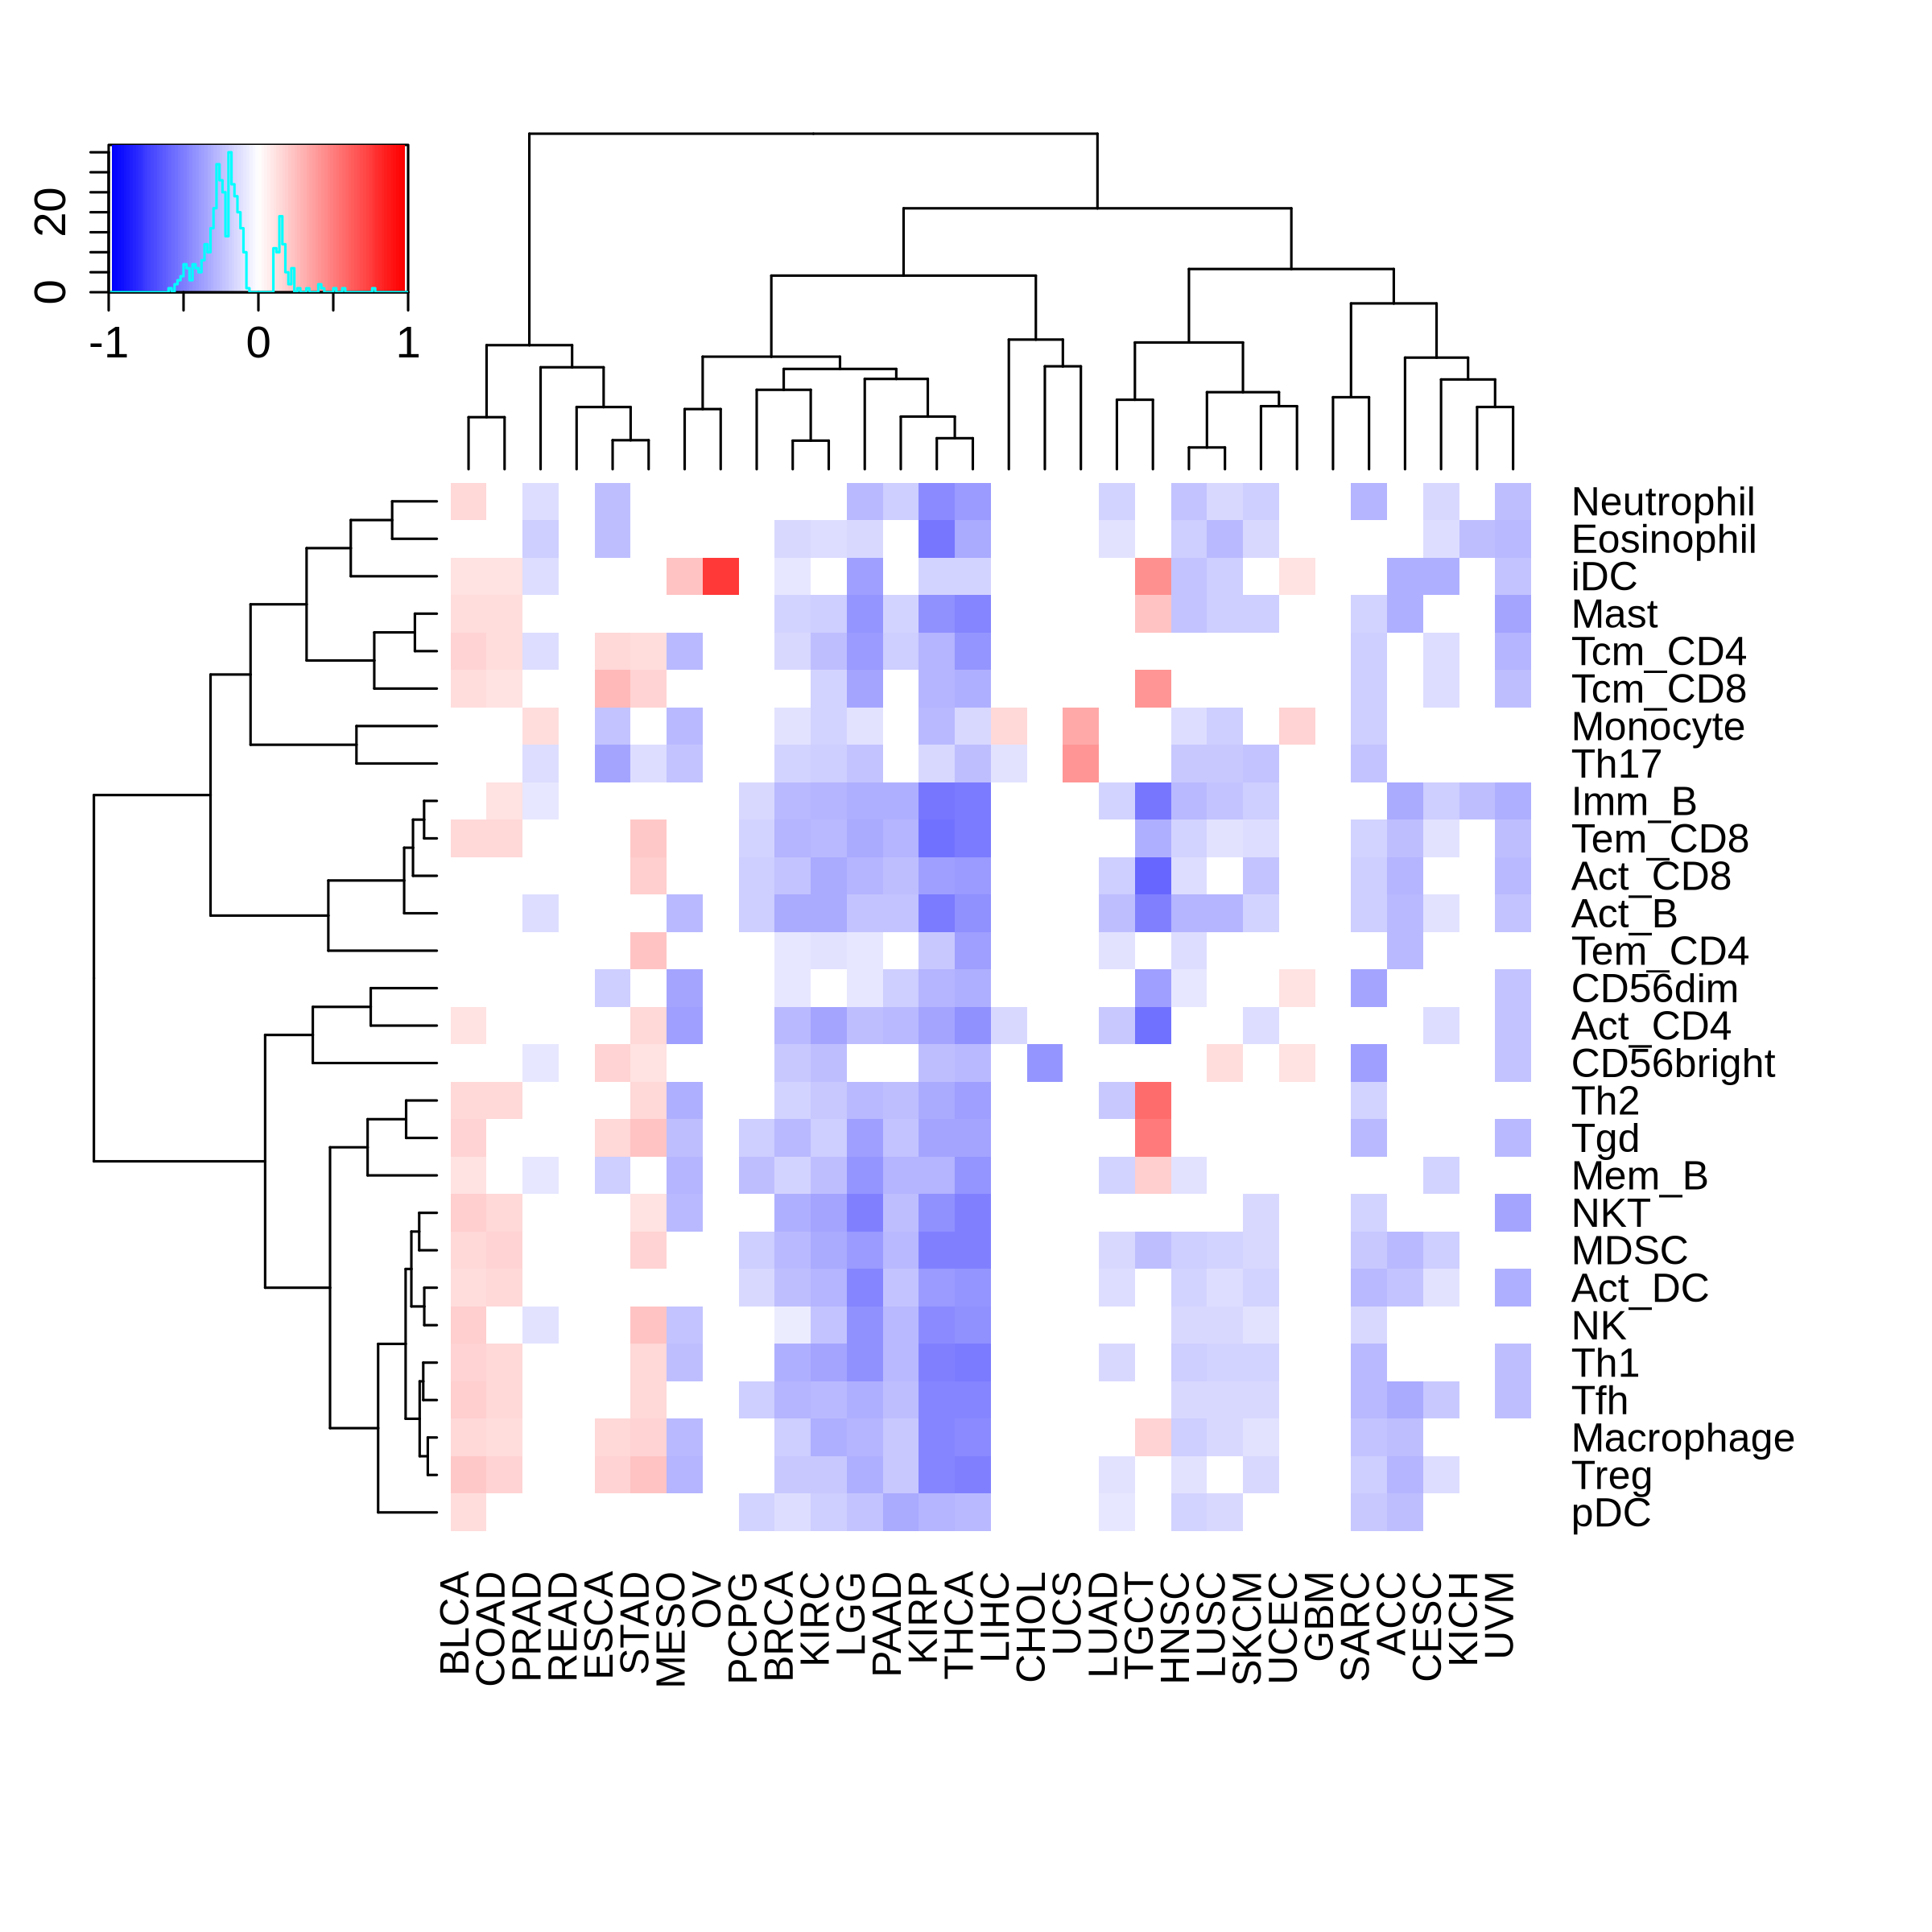
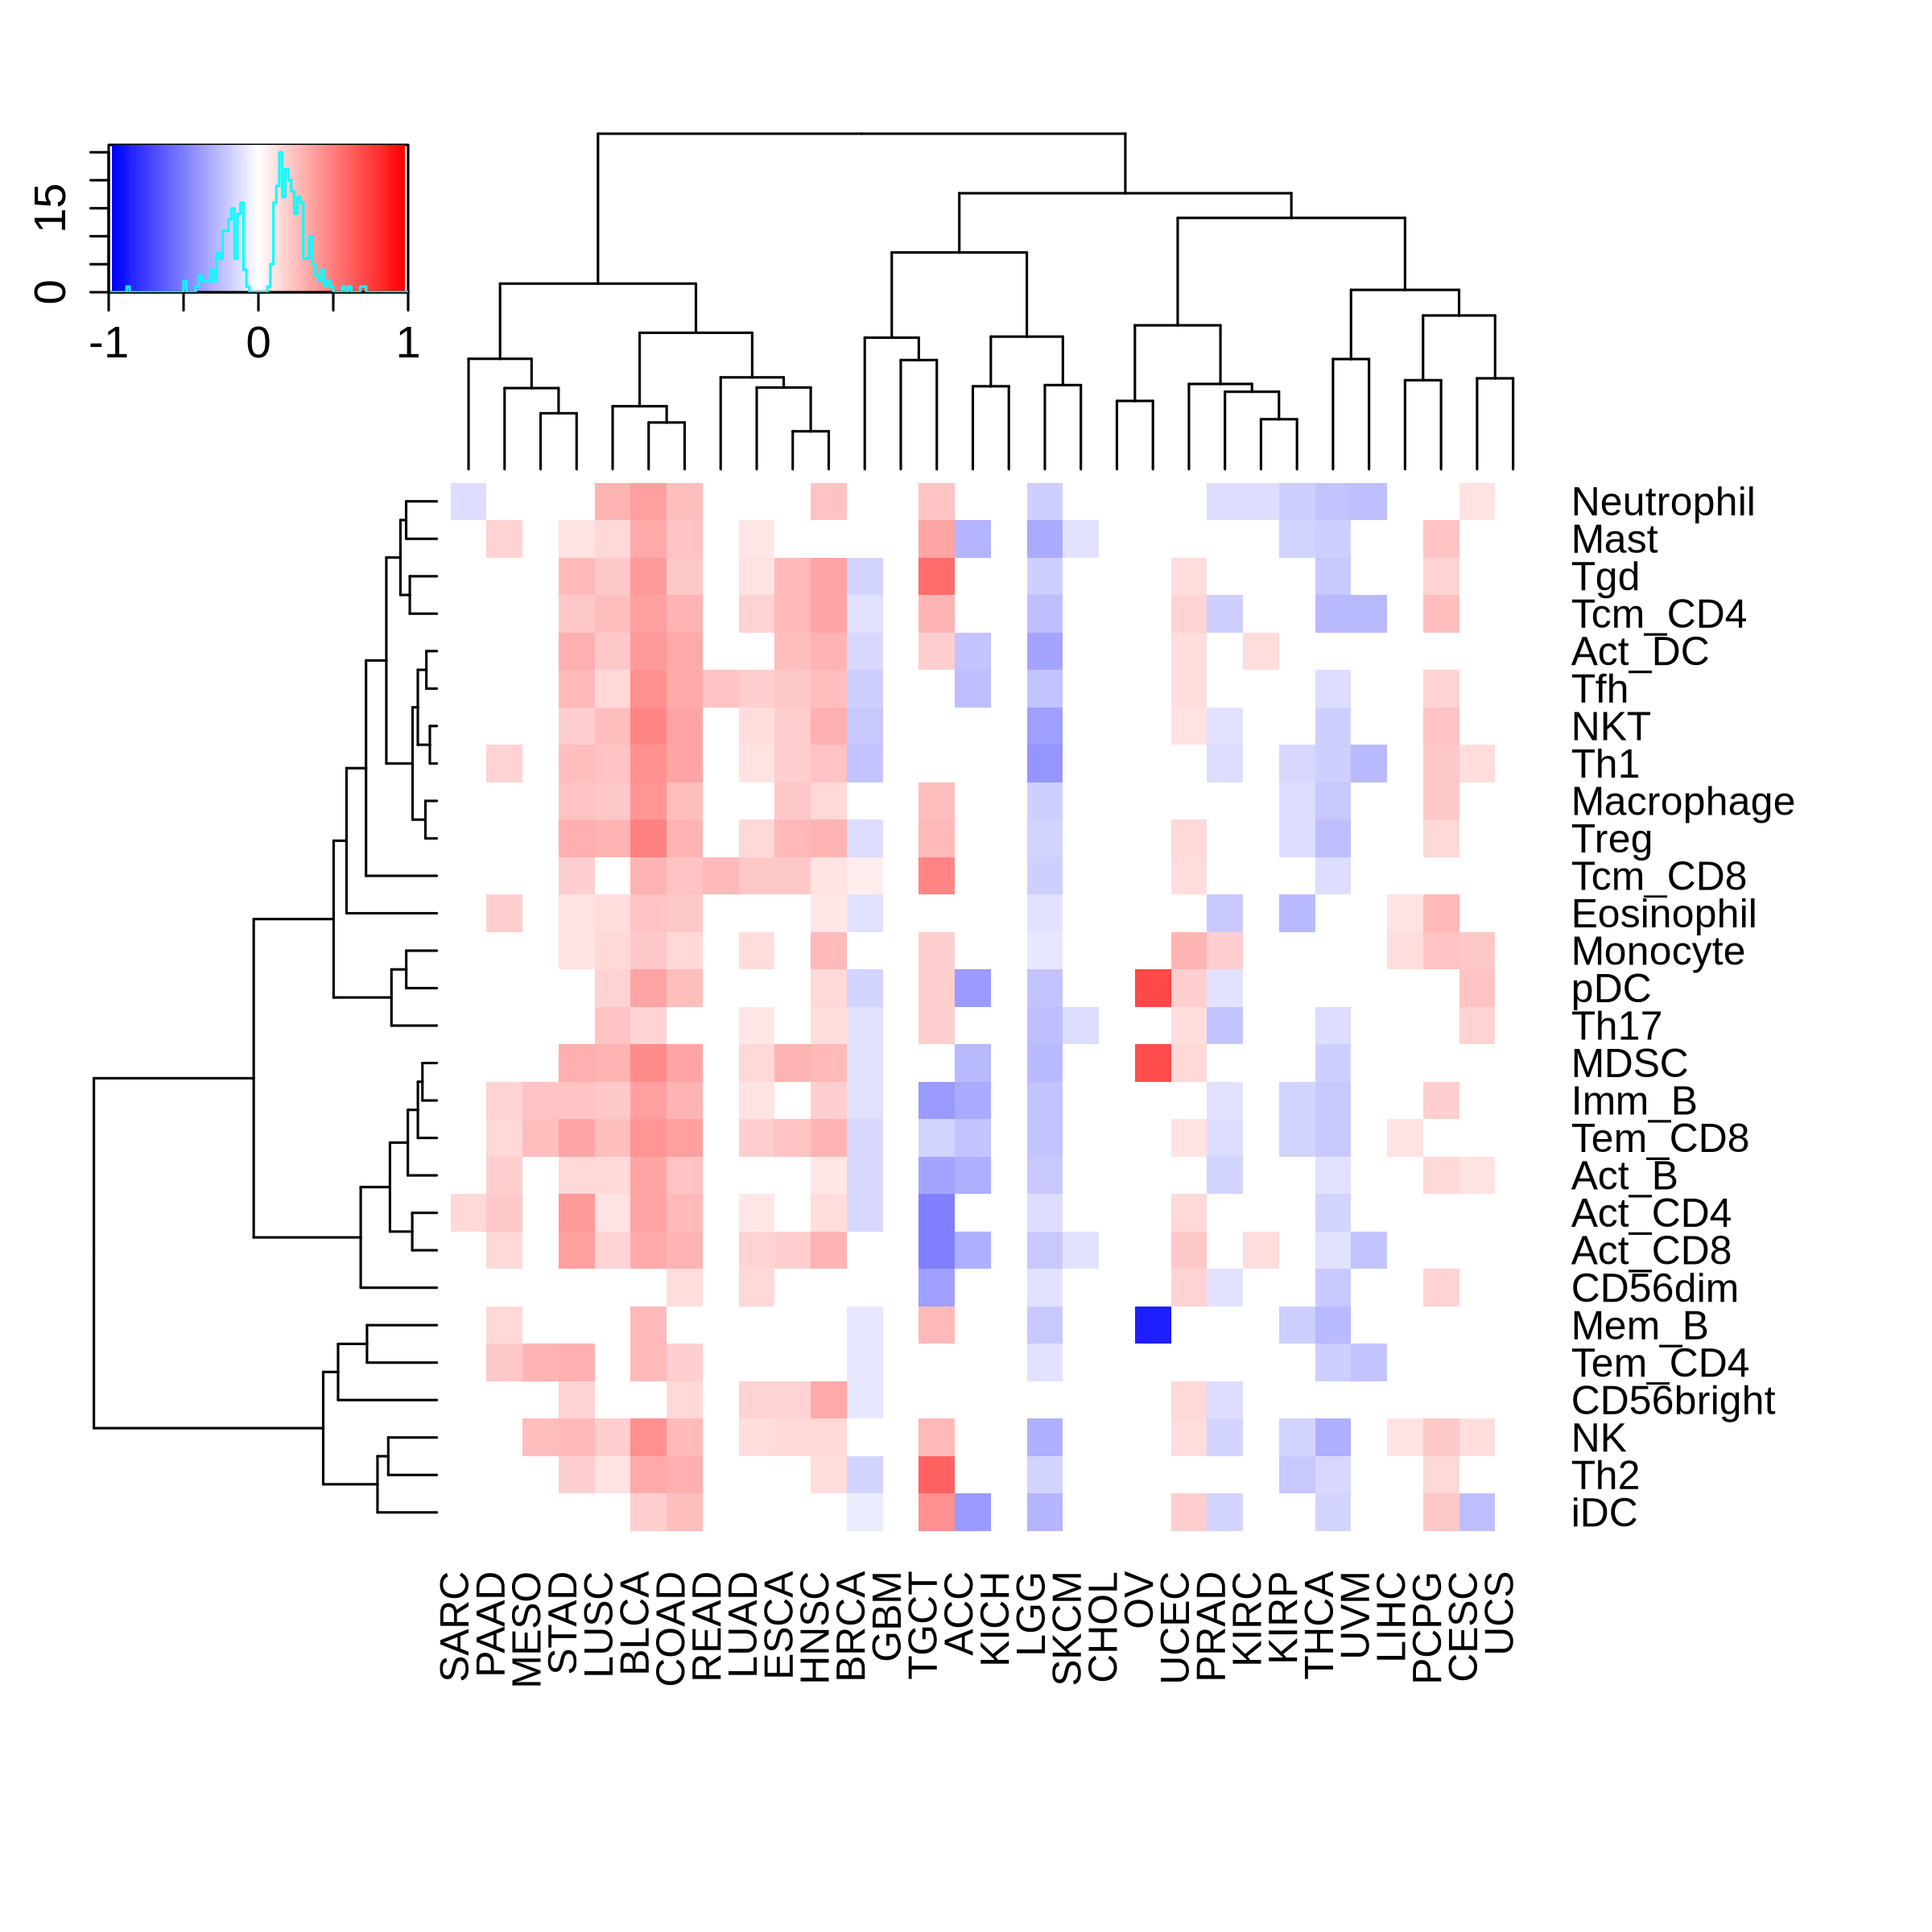
Correlation between the composition of TIL and gene expression, methylation and CNV |
| Expression | Copy number variation |
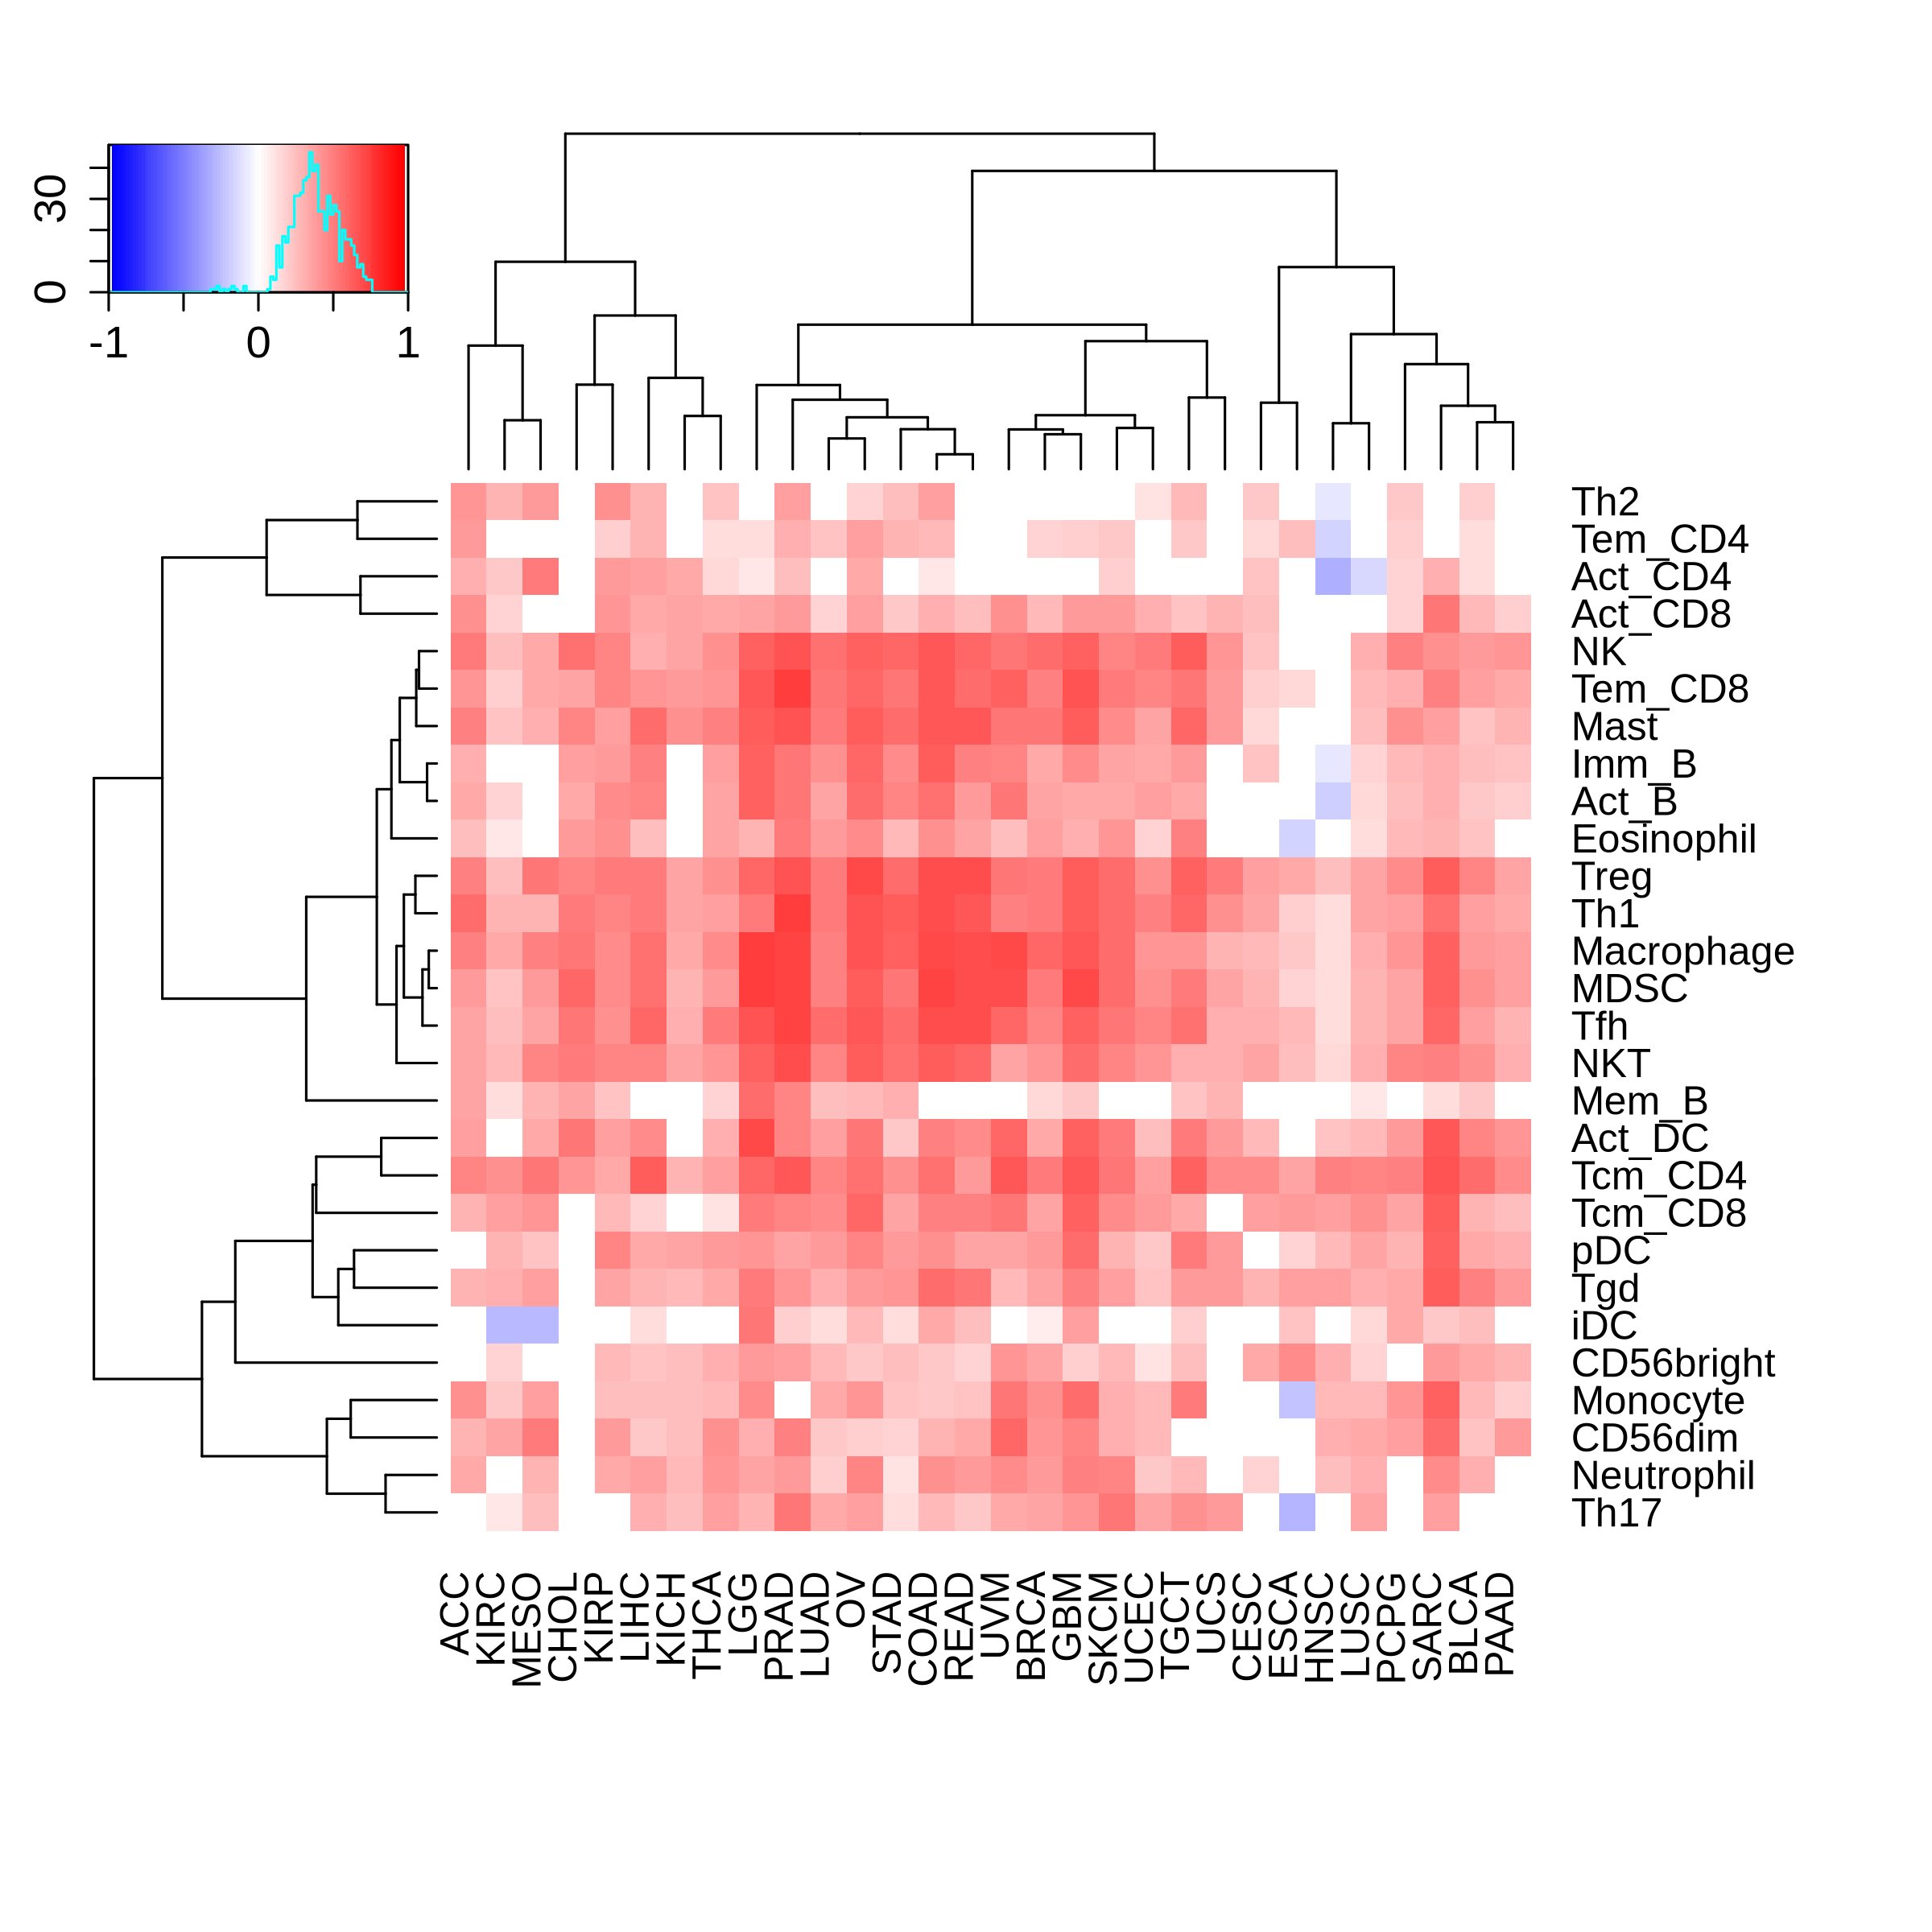 | 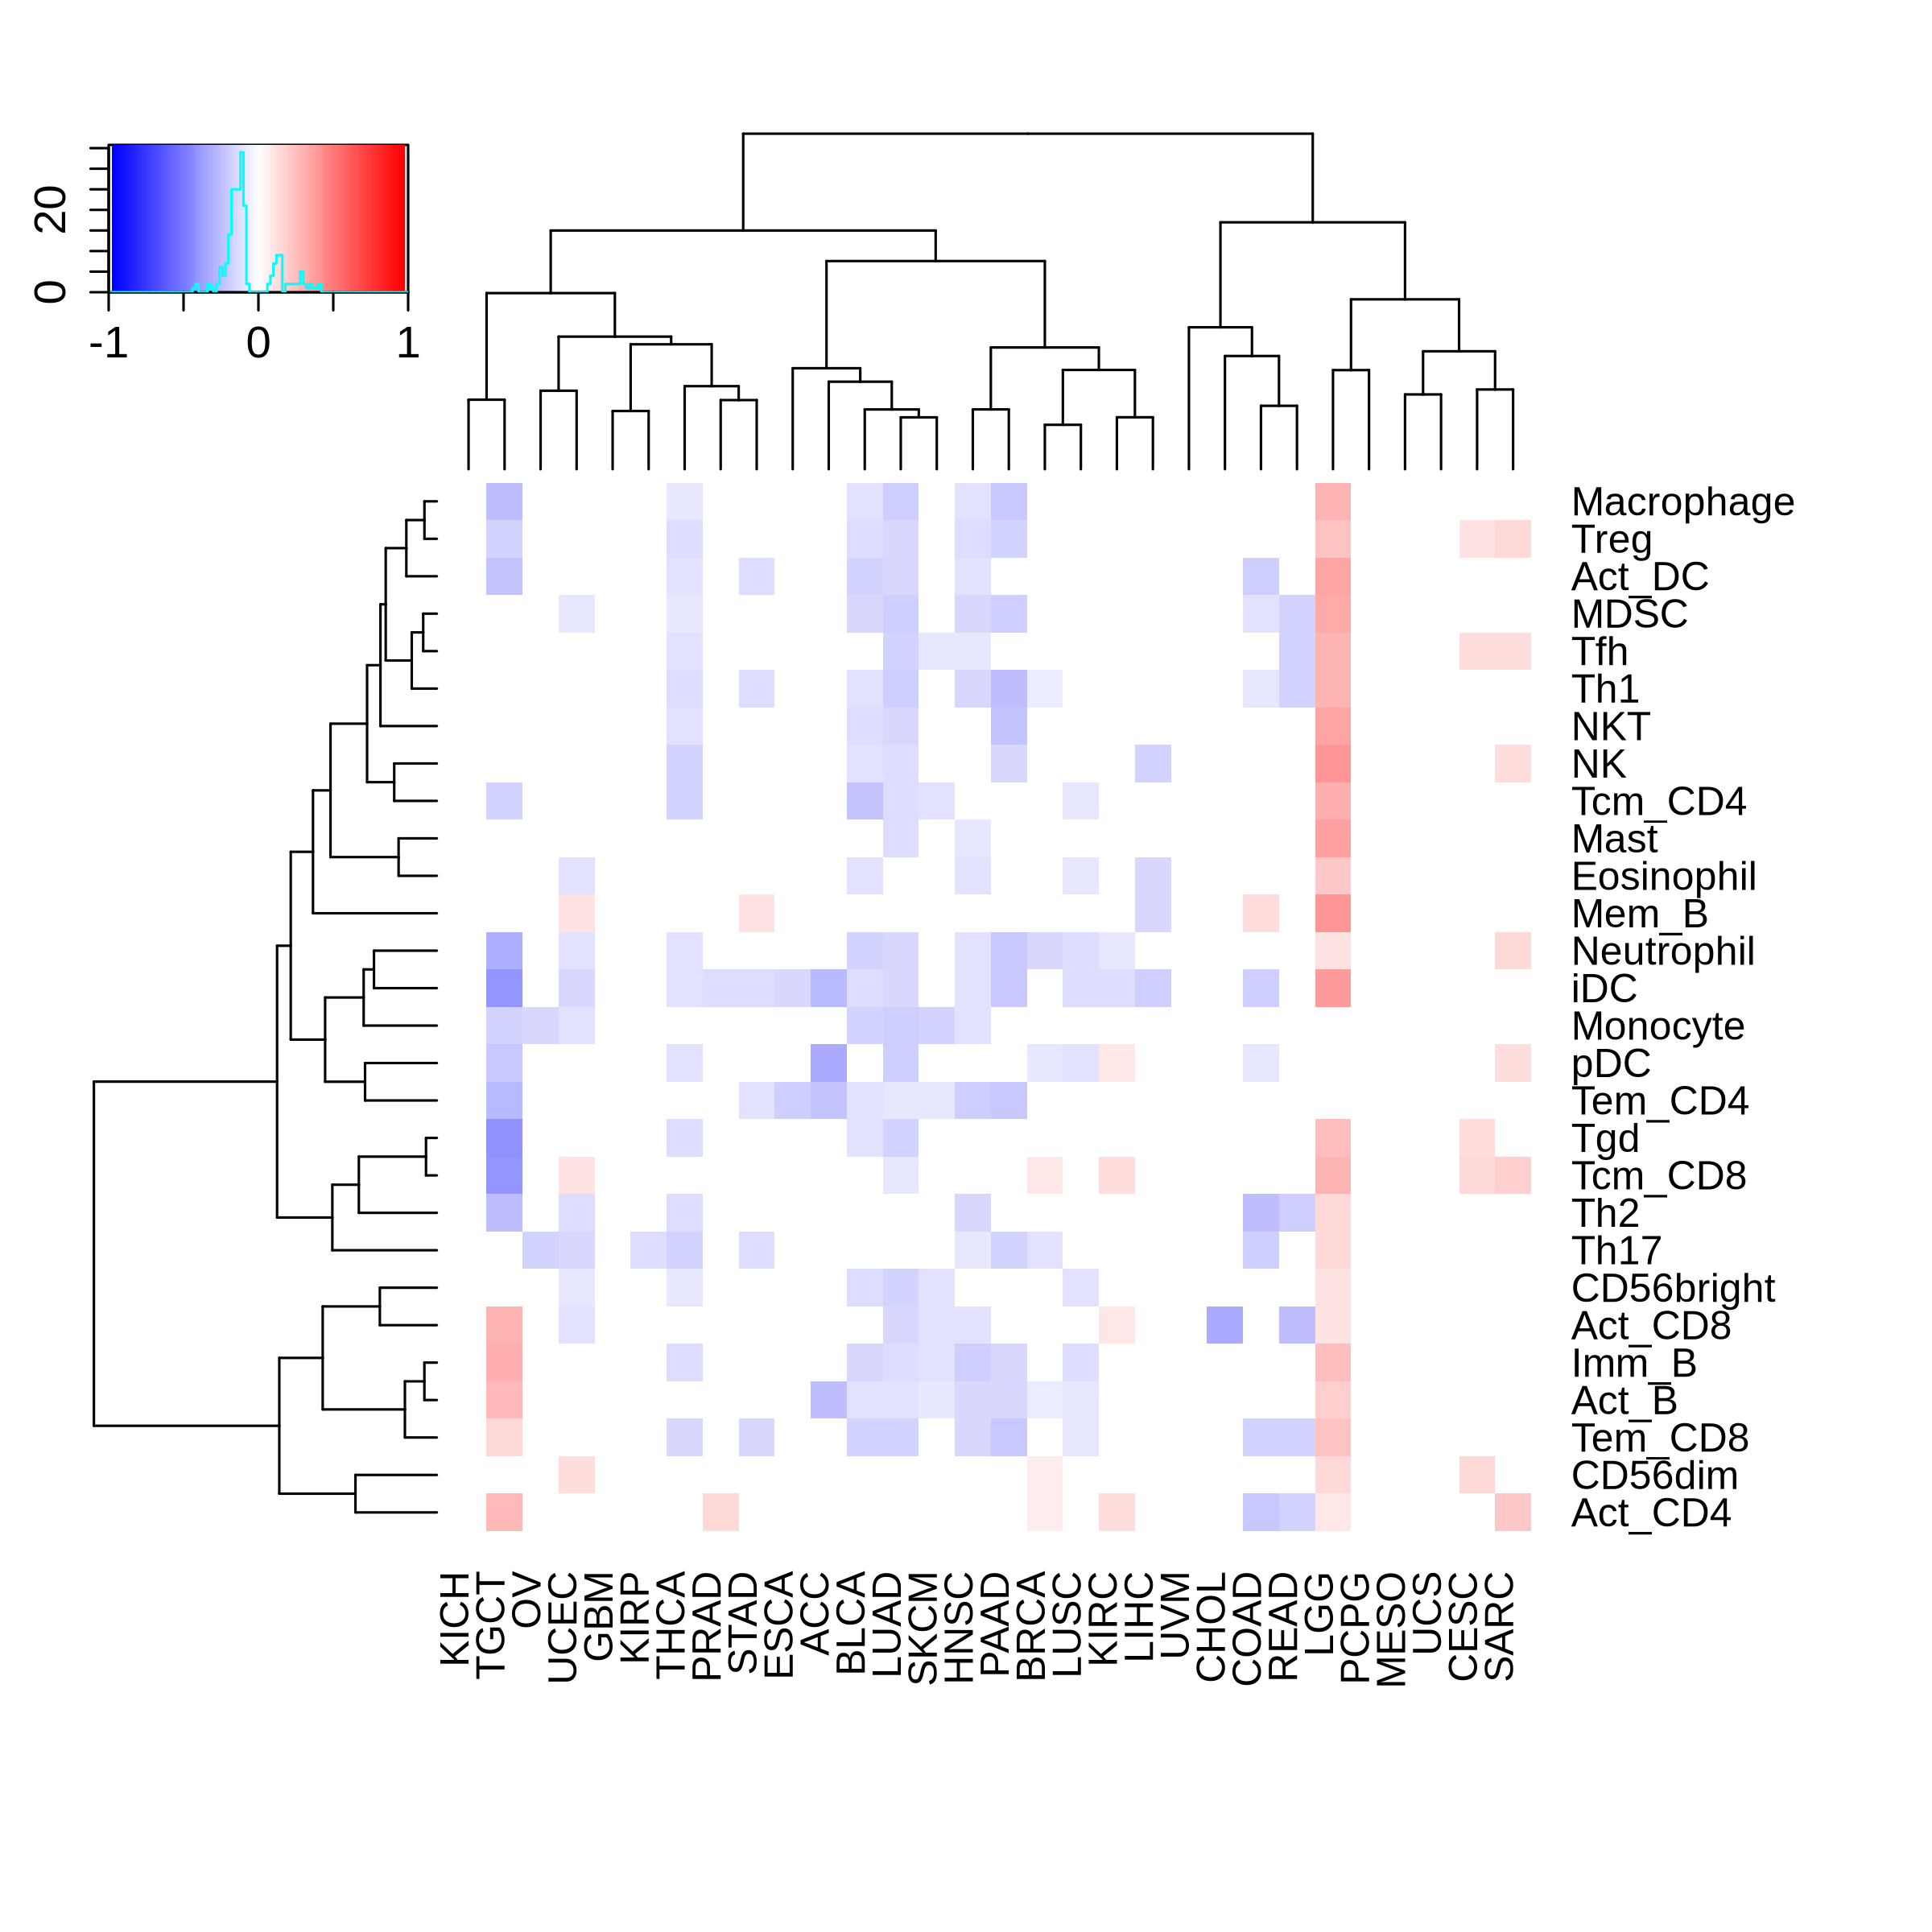 |
| Promoter methylation | Genebody methylation |
 |  |
Top |
The association between TGFB1 expression and immune subtypes/status |
Top |
Drugs targeting TGFB1 and diseases related to TGFB1. |
| Drug-gene interaction | Disease-gene association |
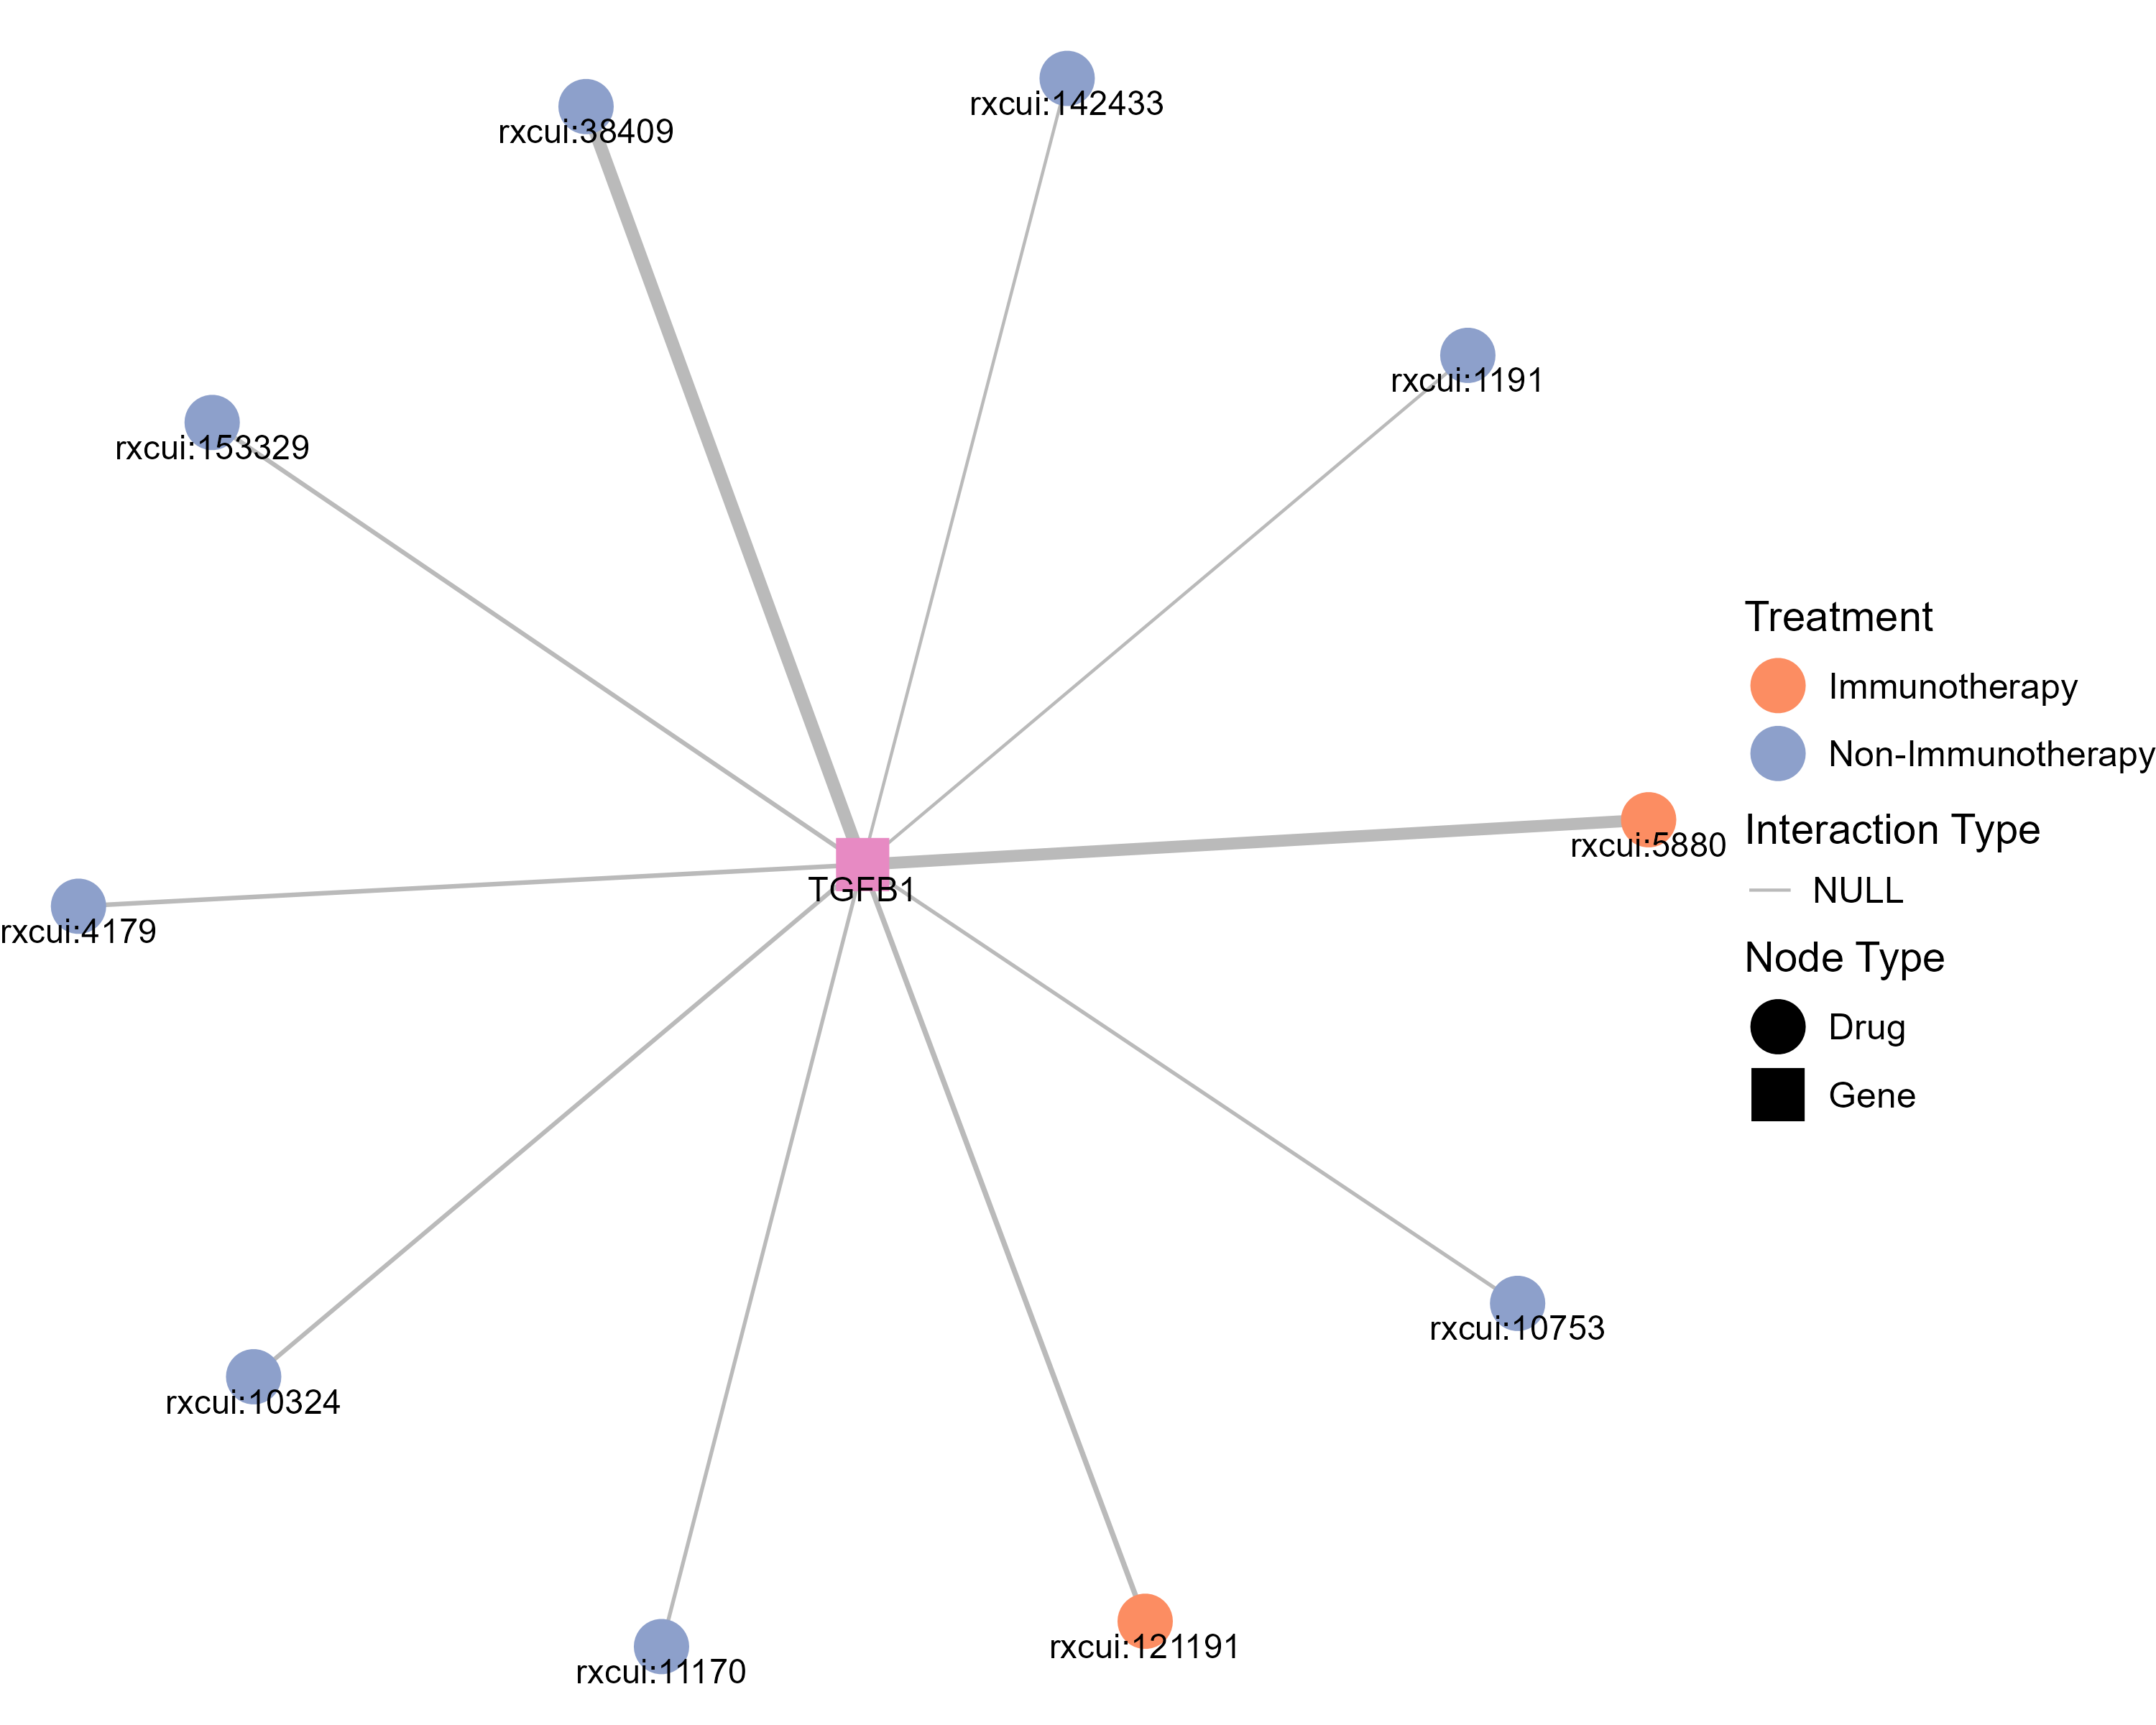 | 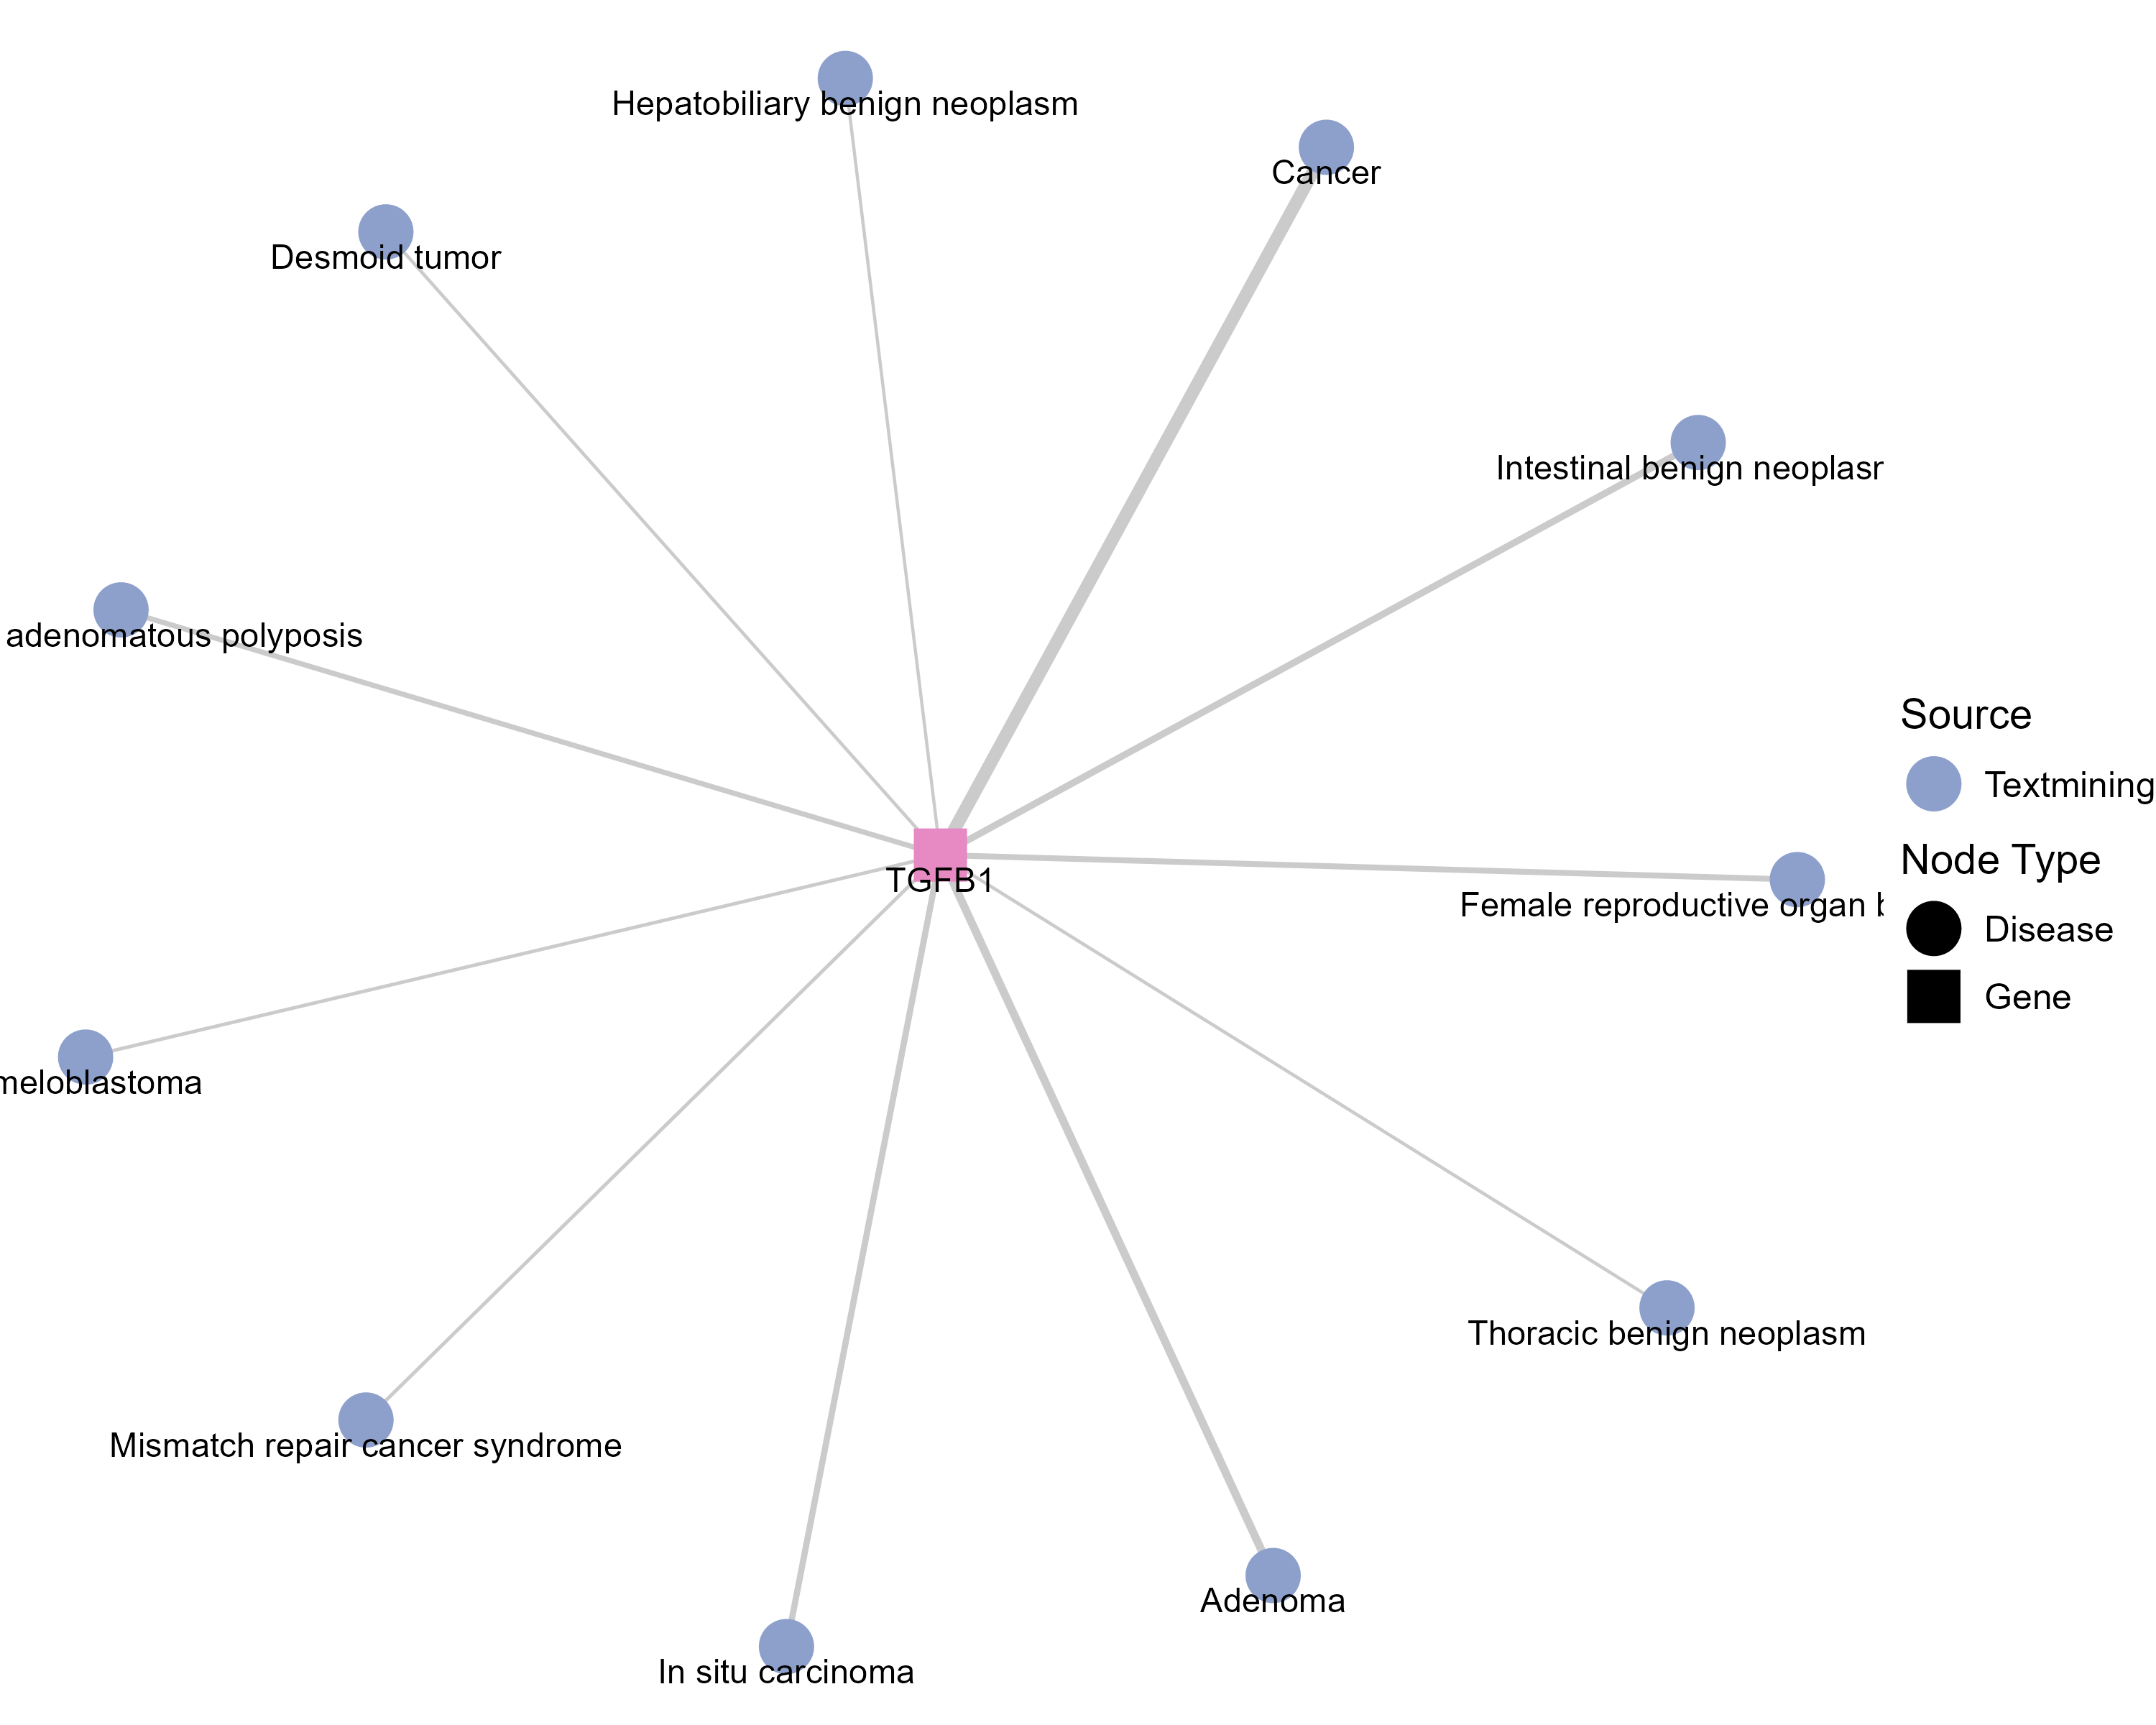 |
Top |
Survival analysis based on TGFB1 expression |
Top |
| Reference |
| [1] Steele CD, Abbasi A, Islam SMA, et al. Signatures of copy number alterations in human cancer. Nature. 2022 Jun;606(7916):984-991. doi: 10.1038/s41586-022-04738-6. Epub 2022 Jun 15. PMID: 35705804; PMCID: PMC9242861. [2] Beibei Ru, Ching Ngar Wong, Yin Tong, et al. TISIDB: an integrated repository portal for tumor–immune system interactions, Bioinformatics, Volume 35, Issue 20, October 2019, Pages 4200–4202, https://doi.org/10.1093/bioinformatics/btz210. [3] Zhongyang Liu, Jiale Liu, Xinyue Liu, et al. CTR–DB, an omnibus for patient-derived gene expression signatures correlated with cancer drug response, Nucleic Acids Research, Volume 50, Issue D1, 7 January 2022, Pages D1184–D1199, https://doi.org/10.1093/nar/gkab860. [4] Charoentong P, Finotello F, Angelova M, et al. Pan-cancer Immunogenomic Analyses Reveal Genotype-Immunophenotype Relationships and Predictors of Response to Checkpoint Blockade. Cell Rep. 2017 Jan 3;18(1):248–262. doi: 10.1016/j.celrep.2016.12.019. PMID: 28052254. [5] Thorsson V, Gibbs DL, Brown SD, et al. The Immune Landscape of Cancer. Immunity. 2018 Apr 17;48(4):812-830.e14. doi: 10.1016/j.immuni.2018.03.023. Epub 2018 Apr 5. Erratum in: Immunity. 2019 Aug 20;51(2):411-412. doi: 10.1016/j.immuni.2019.08.004. PMID: 29628290; PMCID: PMC5982584. [6] Zapata L, Caravagna G, Williams MJ, et al. Immune selection determines tumor antigenicity and influences response to checkpoint inhibitors. Nat Genet. 2023 Mar;55(3):451-460. doi: 10.1038/s41588-023-01313-1. Epub 2023 Mar 9. PMID: 36894710; PMCID: PMC10011129. [7] Cortes-Ciriano I, Lee S, Park WY, et al. A molecular portrait of microsatellite instability across multiple cancers. Nat Commun. 2017 Jun 6;8:15180. doi: 10.1038/ncomms15180. PMID: 28585546; PMCID: PMC5467167. [8] Cannon M, Stevenson J, Stahl K, et al. DGIdb 5.0: rebuilding the drug-gene interaction database for precision medicine and drug discovery platforms. Nucleic Acids Res. 2024 Jan 5;52(D1):D1227-D1235. doi: 10.1093/nar/gkad1040. PMID: 37953380; PMCID: PMC10767982. [9] Grissa D, Junge A, Oprea TI, Jensen LJ. Diseases 2.0: a weekly updated database of disease-gene associations from text mining and data integration. Database (Oxford). 2022 Mar 28;2022:baac019. doi: 10.1093/database/baac019. PMID: 35348648; PMCID: PMC9216524. |

Copyright 2024-Present -The University of Texas Health Science Center at Houston |