|
||||||
|
 | |
| |
| Diseases and cell types significantly enriched for this variant |
| Diseases and cell types not significantly enriched for this variant |
| |
| Other diseases related to this variant that have been studied before |
Variant: MT3002G>A |
Summary for MT3002G>A |
| Chr | chrM | Gene symbol | MT-RNR2 |
| Start | 3002 | Gene type | rRNA |
| End | 3002 | Synonyms | 16S|HN|MTRNR2 |
| Ref | G | Gene name | |
| Alt | A | Ensembl ID | ENSG00000210082 |
| dbSNP ID | Entrez ID | ||
| Mutation type | SNV | UniProtAcc | |
| Mutation detail | [A] Effect: non-coding region; Substitution: G→A | ||
Top |
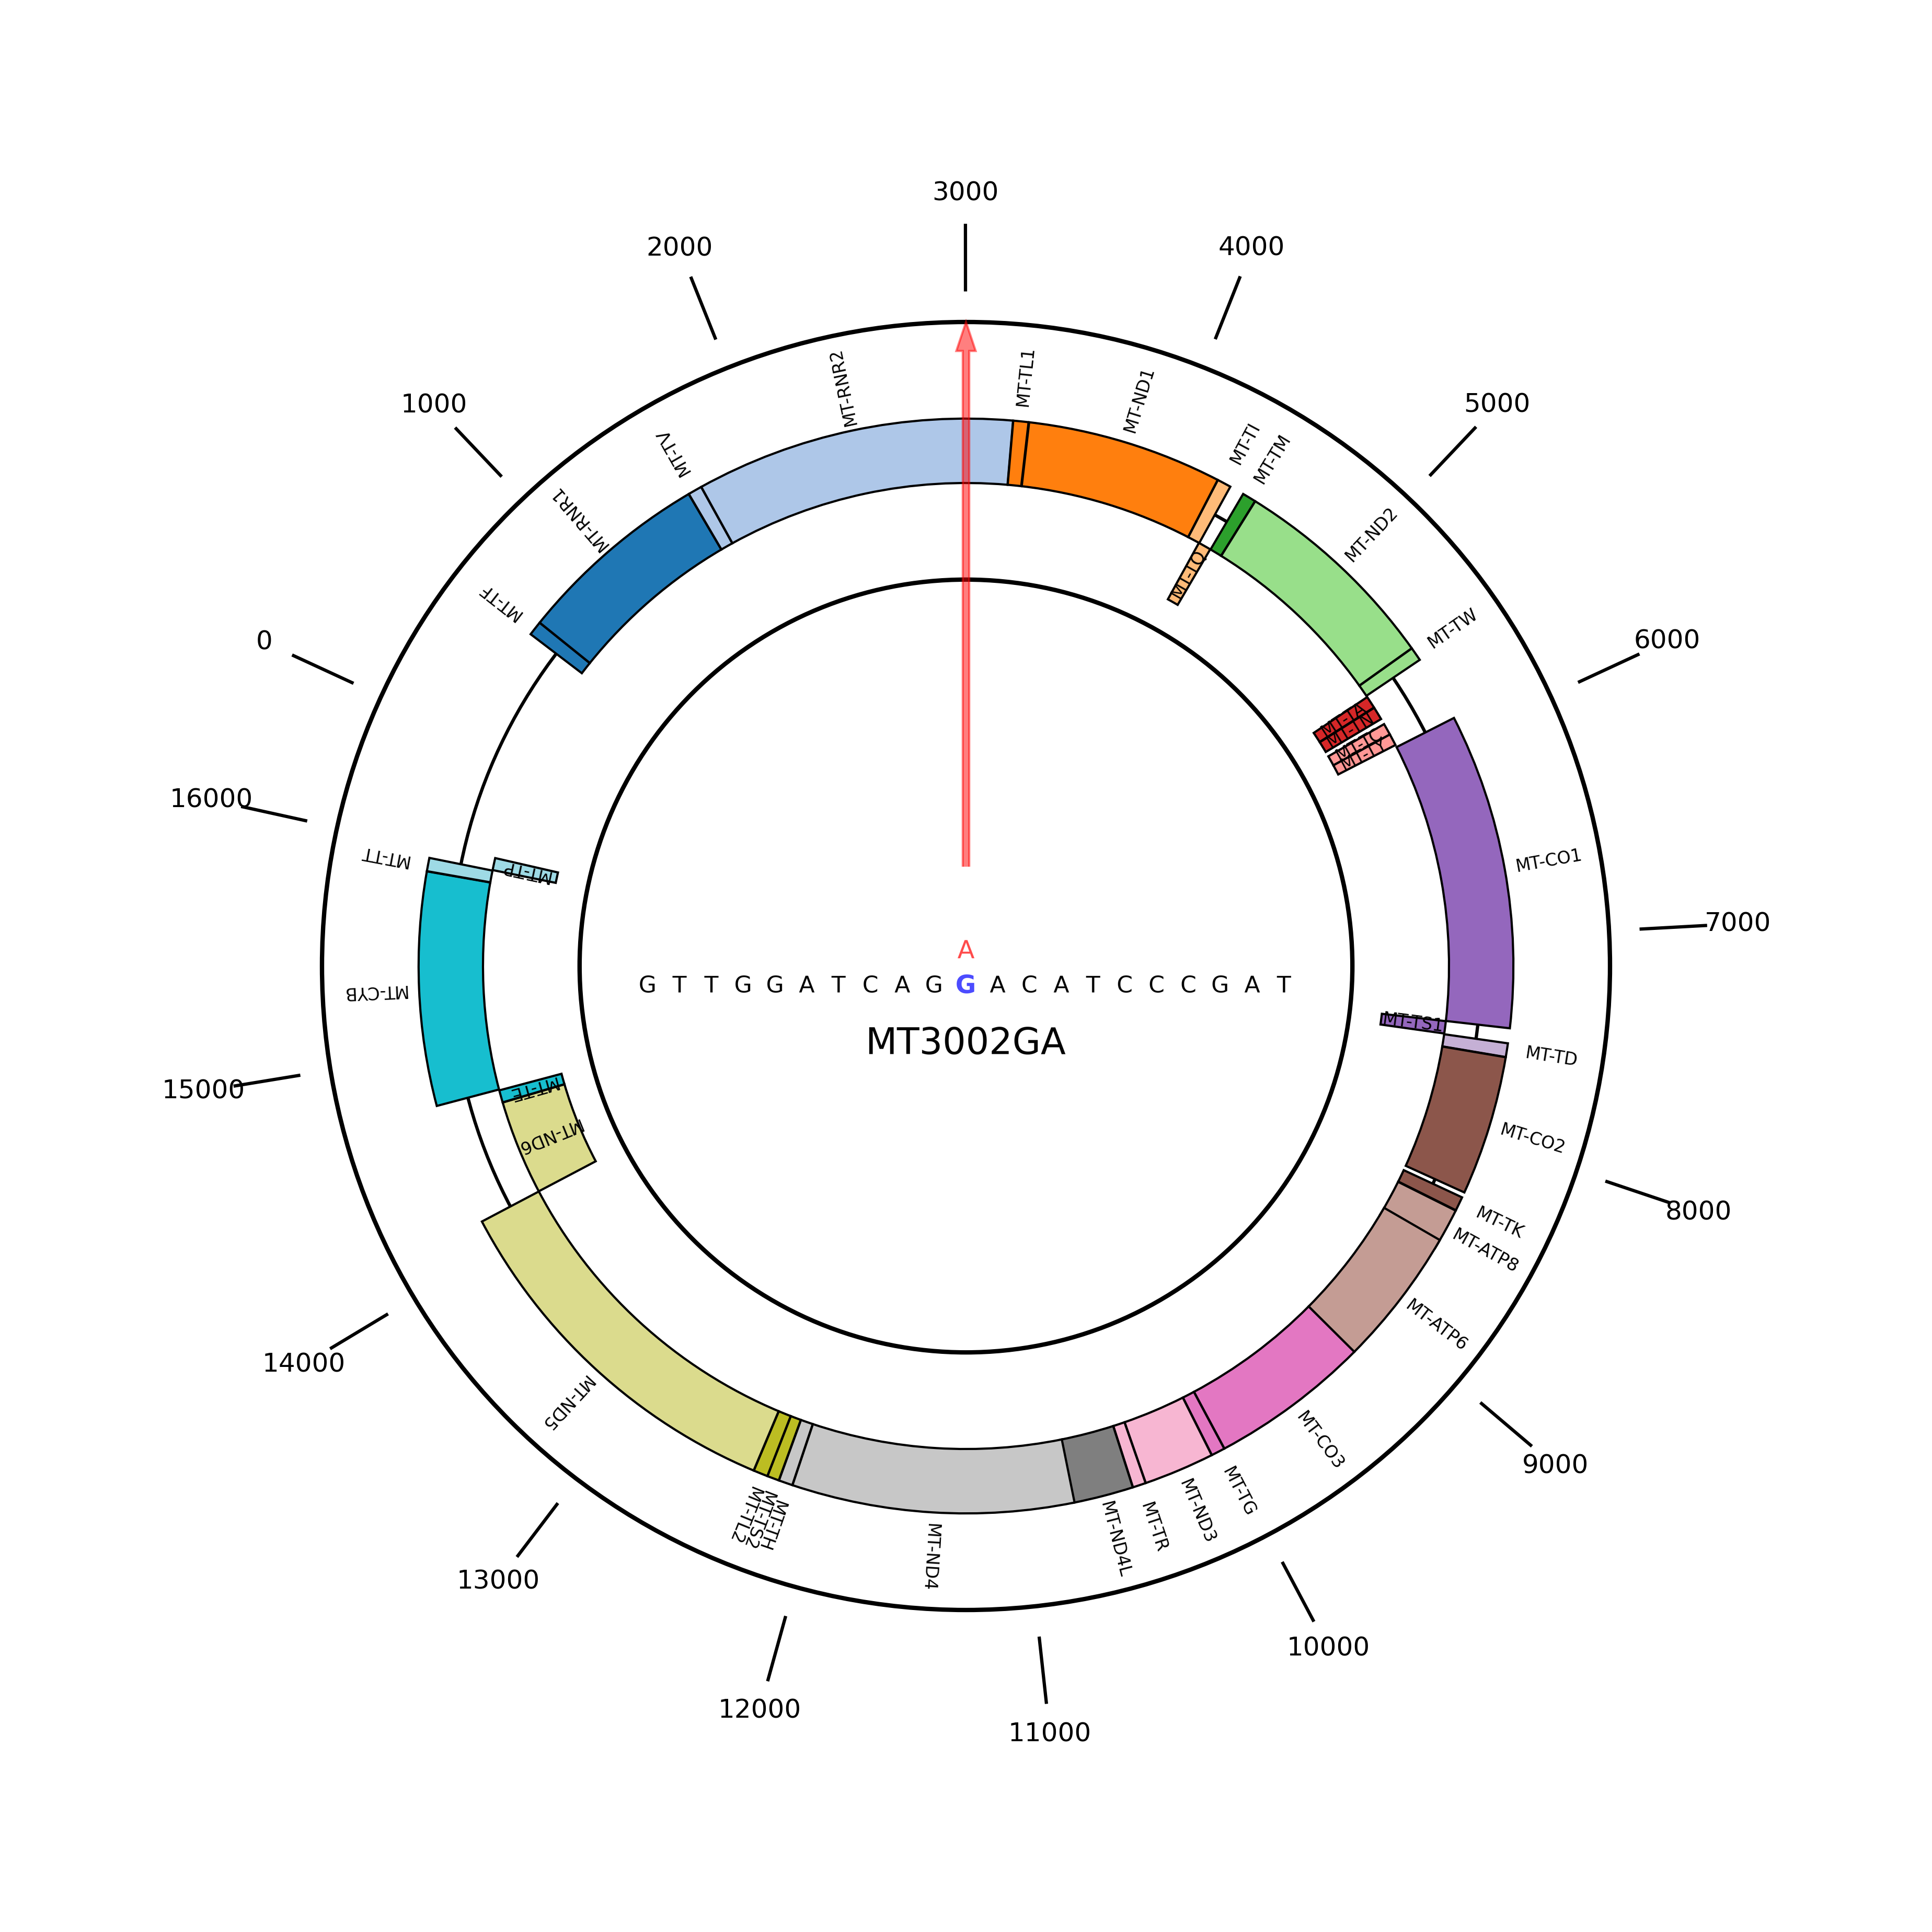
Chromosome location of MT3002G>A |
 The chromosome location of this variant is shown below. Mutations occurring at this locus are labeled on the reference base. (If the image exists, the user can click on it to enlarge it in a new window.) The chromosome location of this variant is shown below. Mutations occurring at this locus are labeled on the reference base. (If the image exists, the user can click on it to enlarge it in a new window.) |
 |
Top |
Diseases and cell types significantly enriched for MT3002G>A |
| The table displays the diseases and cell types in which this variant is significantly enriched. The table is first ordered by the position. |
| Columns:'Gene', 'Impact mode', 'Disease', 'Cell type', 'D_hom_mut', 'D_het_mut', 'D_total_cells', 'N_hom_mut', 'N_het_mut', 'N_total_cells', 'D_mean_vaf', 'N_mean_vaf', 'Log odds', 'P value, Method', '%Cells/Ind' |
Top |
Diseases and cell types not significantly enriched for MT3002G>A |
| The table displays the diseases and cell types in which this variant is not significantly enriched. The table is first ordered by the position. |
| Columns:'Gene', 'Impact mode', 'Disease', 'Cell type', 'D_hom_mut', 'D_het_mut', 'D_total_cells', 'N_hom_mut', 'N_het_mut', 'N_total_cells', 'D_mean_vaf', 'N_mean_vaf', 'Log odds', 'P value, Method', '%Cells/Ind' |
| Gene | Impact mode | Disease | Cell type | D_hom_mutⓘ | D_het_mutⓘ | D_total_cellsⓘ | N_hom_mutⓘ | N_het_mutⓘ | N_total_cellsⓘ | D_mean_vafⓘ | N_mean_vafⓘ | Log oddsⓘ | P value | Methodⓘ | %Cells/Ind ⓘ |
MT-RNR2 | Non-coding substitution | Pre-T2D | Endocrine cell | 3 | 2 | 69483 | 6 | 10 | 114900 | 0.000 | 0.000 | -0.444 | 5.48e-01 | glmer | Stat Info |
MT-RNR2 | Non-coding substitution | Type 2 Diabetes | Endocrine cell | 1 | 8 | 46558 | 6 | 10 | 114900 | 0.000 | 0.000 | 0.781 | 2.72e-01 | glmer | Stat Info |
| Page: 1 |
Top |
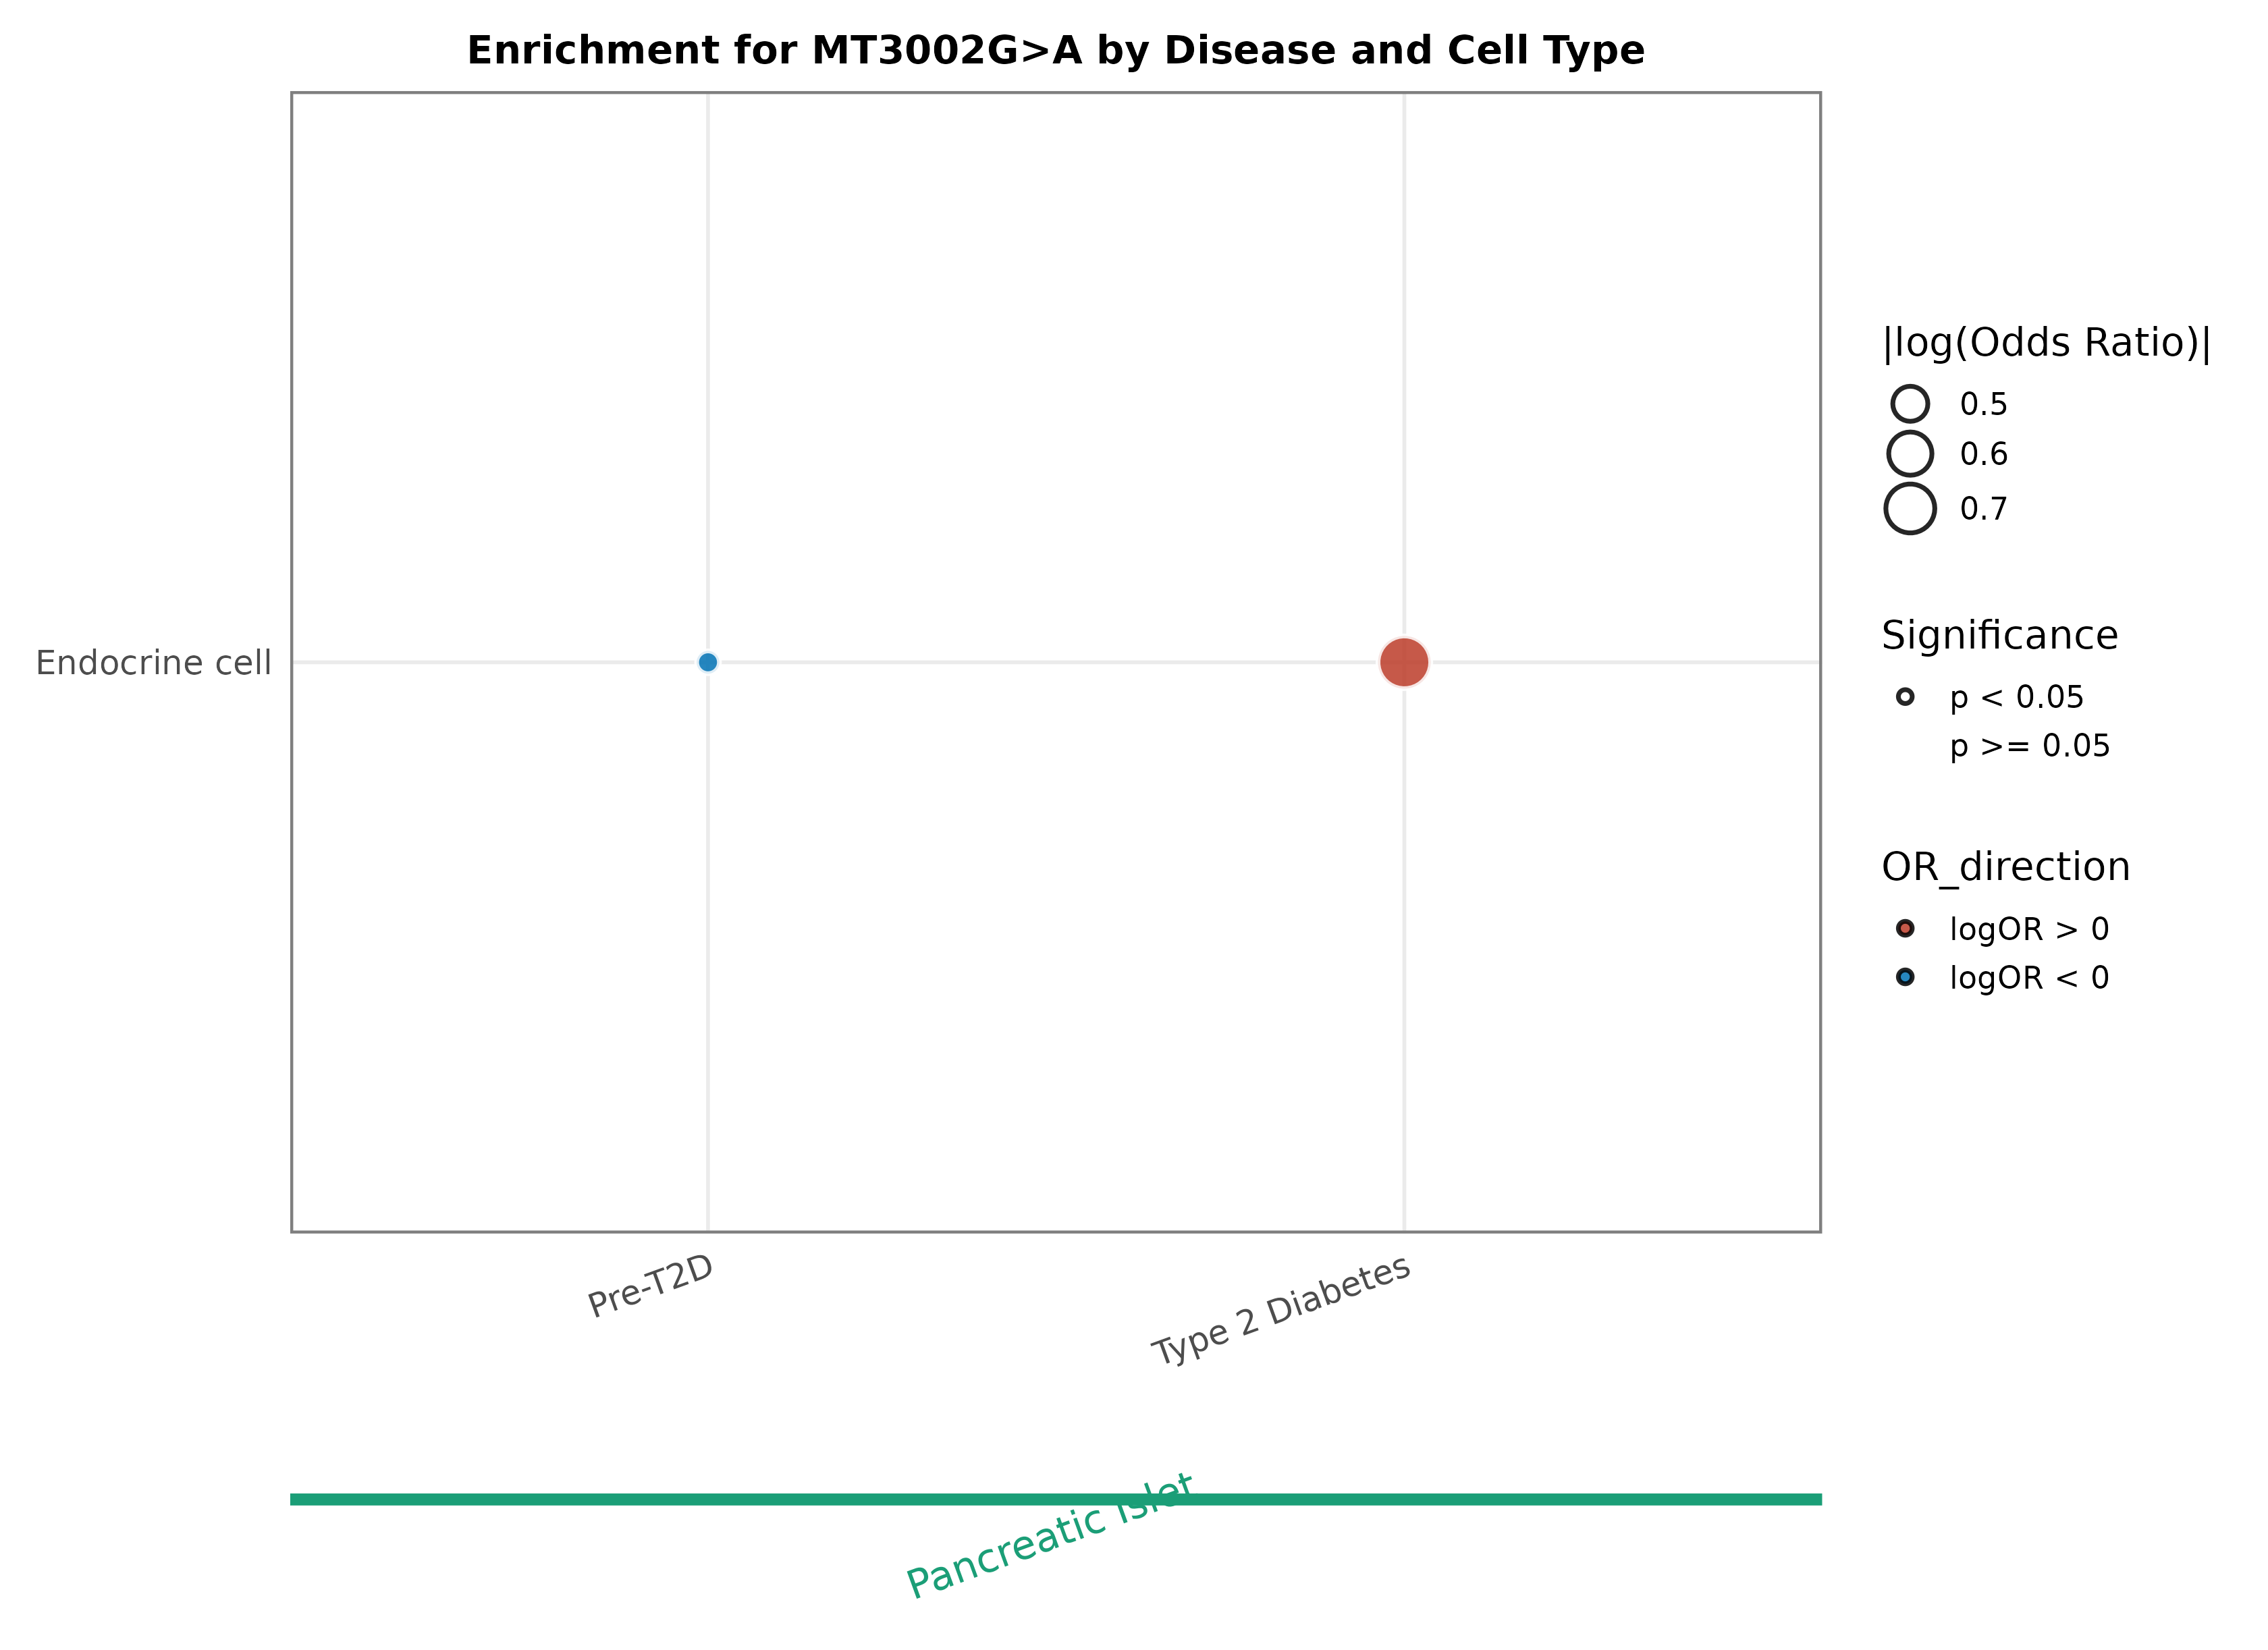
Occurrence of MT3002G>A in diseases and cell types |
| The dot plot shows the occurrence of this variant in diseases and cell types. The dots surrounded by a thick black line represents that compared with the normal group, this mutation has statistical differences in this cell type of this disease (FDR <0.05). Red dots represent significantly high enrichment in the disease group (Odds Ratio >1), while blue dots represent significantly high enrichment in the normal group (Odds Ratio <1). (If the image exists, the user can click on it to enlarge it in a new window.) |
 |
Top |
Other diseases related to MT3002G>A that have been studied before |
| Other diseases related to this variant that have been studied before are shown below. |
| Variant | dbSNP | DisGeNET | Associated diseases | PMID |
| MT3002G>A | DisGeNET |

Copyright 2024-Present -The University of Texas Health Science Center at Houston |