|
Home |
Download |
Statistics |
Landscape |
Help |
Contact |
Navigation
1. Description of scMitoV1.1 scRNA-seq data collection and processing
1.2 Mitochondria DNA variants calling
1.3 Cell type annotation
1.4 Chisq test for identifying disease-related mitochondrial variants
2. Understanding annotation of scMitoV
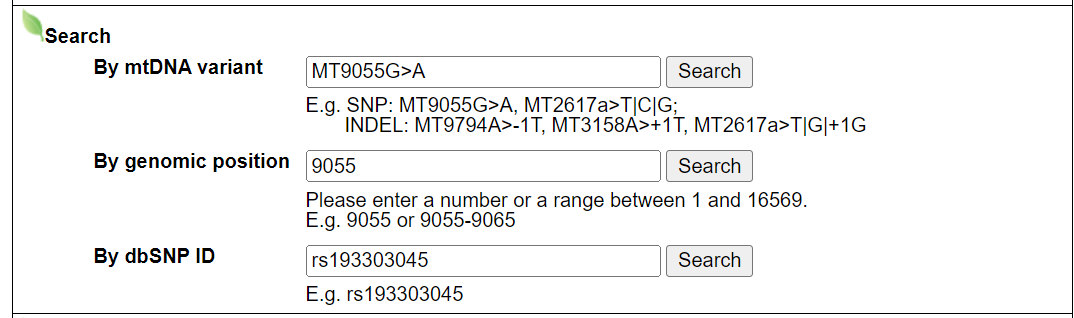
2.1 Search module, example: MT9055G>A, 9055, rs193303045
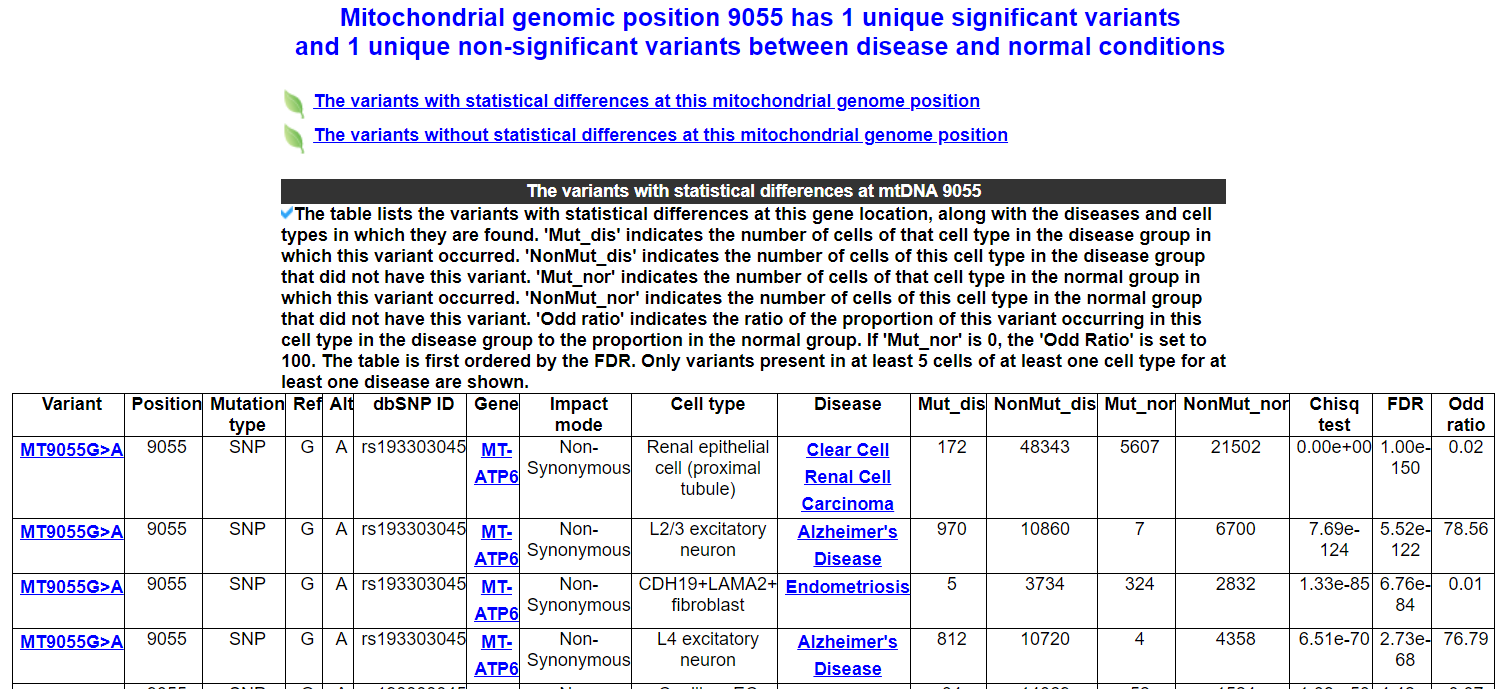
2.2 Genomic position and dbSNP ID search result page
2.3 Variant annotation results page
2.3.1 Variant summary
2.3.2 Chromosome location of this variant
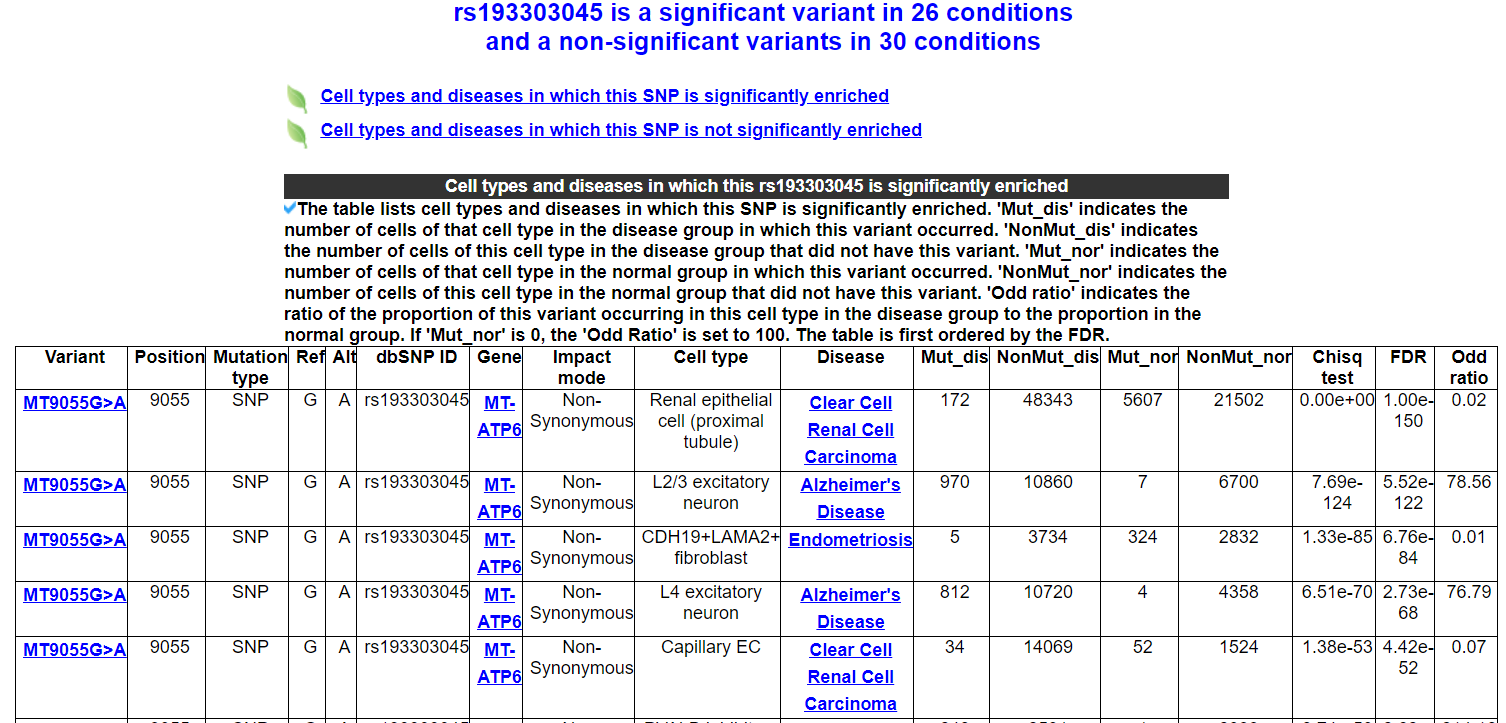
2.3.3 Diseases and cell types significantly enriched for this variant
2.3.4 Diseases and cell types not significantly enriched for this variant
2.3.5 Occurrence of this variant in diseases and cell types
2.3.7 Other diseases related to this variant that have been studied before
2.4 Disease analysis results page
2.4.1 Disease summary
2.4.2 Overview of variant frequencies at each mtDNA location in disease and normal groups
2.4.3 Overview of variants in different cell types in disease and normal groups
2.4.4 Comparison of variant types between different cell types in disease group
2.4.5 Manhattan plot of variants with statistical differences in this disease
2.4.6 Variants with statistical differences in this disease
2.4.7 Variants without statistical differences in this disease
2.5 Gene browsing results page
2.5.1 Gene summary
2.5.2 Variants with statistical differences in this gene
2.5.3 Variants without statistical differences in this gene
2.6 Functional analysis browsing results page
2.6.1 Mitochondrial variants that have been studied in association with other diseases
3. Download data and contact us
The current version of the scMitoV database includes 694 samples (509 disease and 185 normal samples) from 67 datasets, covering 17 human tissues and 37 primary diseases. These included 27 cancers, 4 neurodegenerative diseases, 3 metabolic diseases, and 3 autoimmune diseases. We identified disease-related mitochondrial variants by comparing the disease group and the normal group in different cell types for each disease. In addition, we described the characteristics of each disease's mtDNA mutation in several aspects. First, we systematically characterized the mutation frequencies at each genomic location in both disease and normal samples. We compared the proportion of mutation types in different cell types in the disease group. Additionally, we depicted the mutations in different cell types in both disease and normal samples. scMitoV will serve as a significant asset for disease research, providing insight into the complex molecular and cellular changes that characterize various diseases, and an important tool for finding potential mitochondrial biomarkers and drug targets.
We collected 695 samples (510 disease and 185 normal samples) from 67 datasets, covering 28 human tissues and 39 primary diseases. These included 26 cancers, 4 neurodegenerative diseases, 4 metabolic diseases, and 1 autoimmune disease. Our analysis of scRNA-seq data involved rigorous preprocessing steps, including raw data cleaning, alignment with the mitochondrial genome, removal of nuclear genome interference, elimination of PCR duplicates from reads, and sequencing depth verification.
The mitochondiral DNA variants were called by scCaller tool.
Cell type annotation was performed by DISCOtoolkit.
We identified important mitochondrial variants associated with the disease using the Chisq test and corrected them with the false discovery rate (FDR). The odds ratio was also calculated, which indicates the ratio of the proportion of this variant occurring in this cell type in the disease group to the proportion in the normal group. We identified significant disease-related variants between the disease and normal groups with an FDR of less than 0.05 and odds ratios greater than 1. Only variants present in at least 5 cells of at least one cell type for at least one disease are shown in this database.
- Input query: mtDNA variant.
- Input query: genomic position.
- Input query: dbSNP ID.
After searching a positon or position arrange or dbSNP ID, website will show two tables. One includes mtDNA variants whith statistical differences in different diseases or cell types in this porsition or dbSNP ID. Another includes variants whithout statistical differences.
After searching for a variant or clicking on a variant link, you will be redirected to the variant annotation results page. The page includes 6 modules.
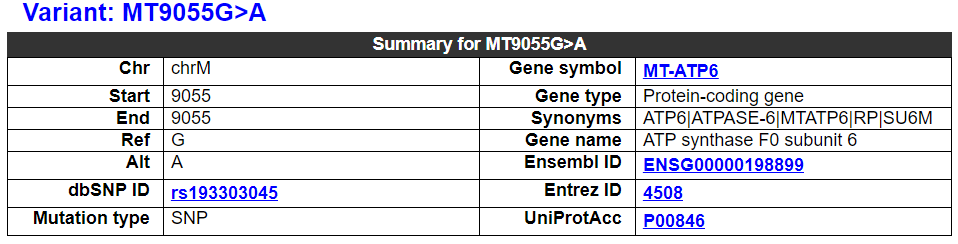
2.3.1 Variant summary
This category shows the overal information of the mtDNA variant. It also shows the overall information of this variant-related gene, including symbol, name, Entrez ID, etc.
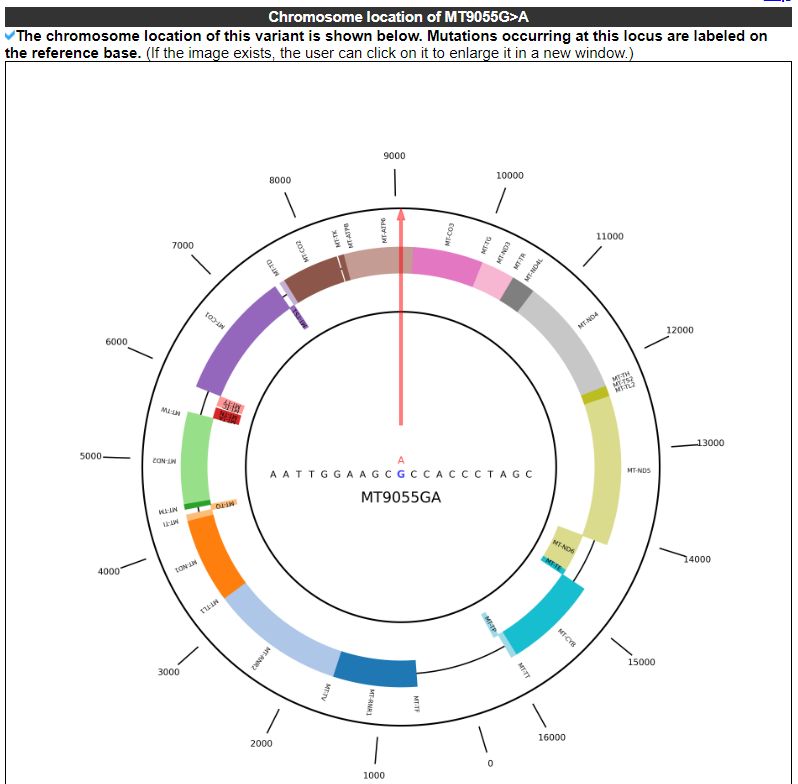
2.3.2 Chromosome location of this variant
This category displays the chromosome location of this variant. Mutations occurring at this locus are labeled on the reference base.
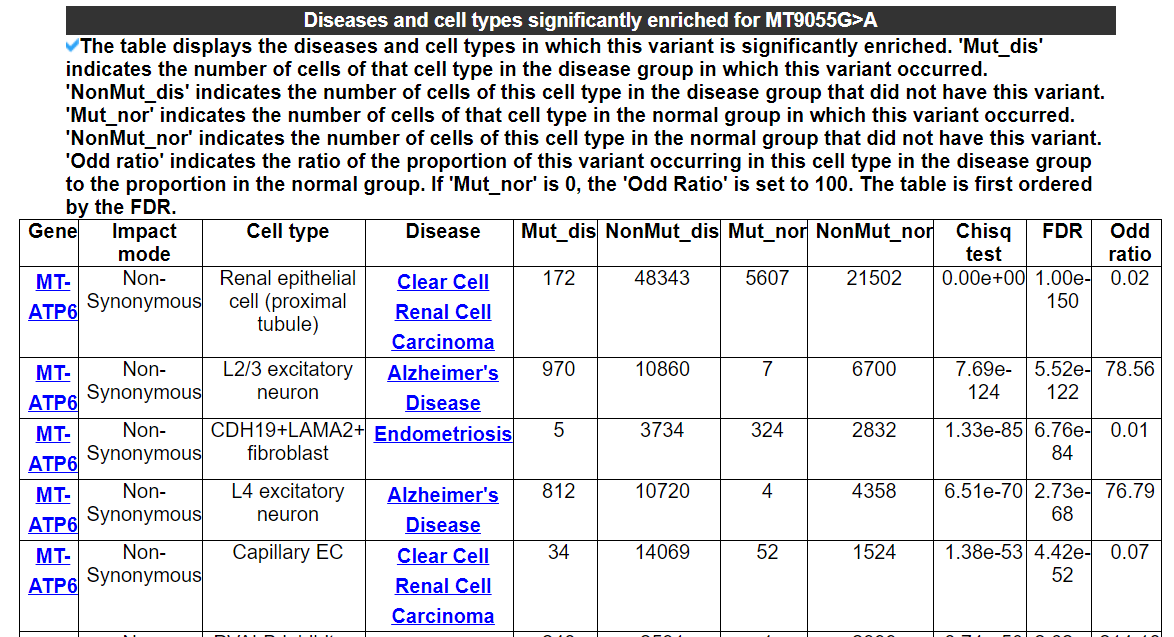
2.3.3 Diseases and cell types significantly enriched for this variant
The table displays the diseases and cell types in which this variant is significantly enriched. 'Mut_dis' indicates the number of cells of that cell type in the disease group in which this variant occurred. 'NonMut_dis' indicates the number of cells of this cell type in the disease group that did not have this variant. 'Mut_nor' indicates the number of cells of that cell type in the normal group in which this variant occurred. 'NonMut_nor' indicates the number of cells of this cell type in the normal group that did not have this variant. 'Odd ratio' indicates the ratio of the proportion of this variant occurring in this cell type in the disease group to the proportion in the normal group. If 'Mut_nor' is 0, the 'Odd Ratio' is set to 100. The table is first ordered by the FDR.
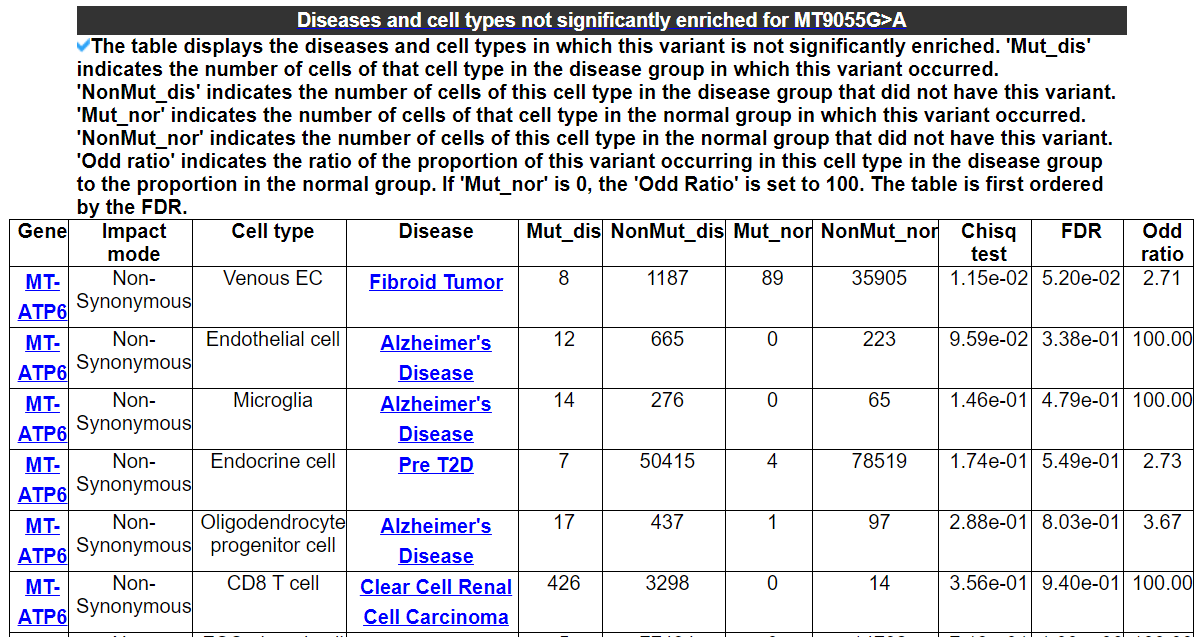
2.3.4 Diseases and cell types not significantly enriched for this variant
The table displays the diseases and cell types in which this variant is not significantly enriched. 'Mut_dis' indicates the number of cells of that cell type in the disease group in which this variant occurred. 'NonMut_dis' indicates the number of cells of this cell type in the disease group that did not have this variant. 'Mut_nor' indicates the number of cells of that cell type in the normal group in which this variant occurred. 'NonMut_nor' indicates the number of cells of this cell type in the normal group that did not have this variant. 'Odd ratio' indicates the ratio of the proportion of this variant occurring in this cell type in the disease group to the proportion in the normal group. If 'Mut_nor' is 0, the 'Odd Ratio' is set to 100. The table is first ordered by the FDR.
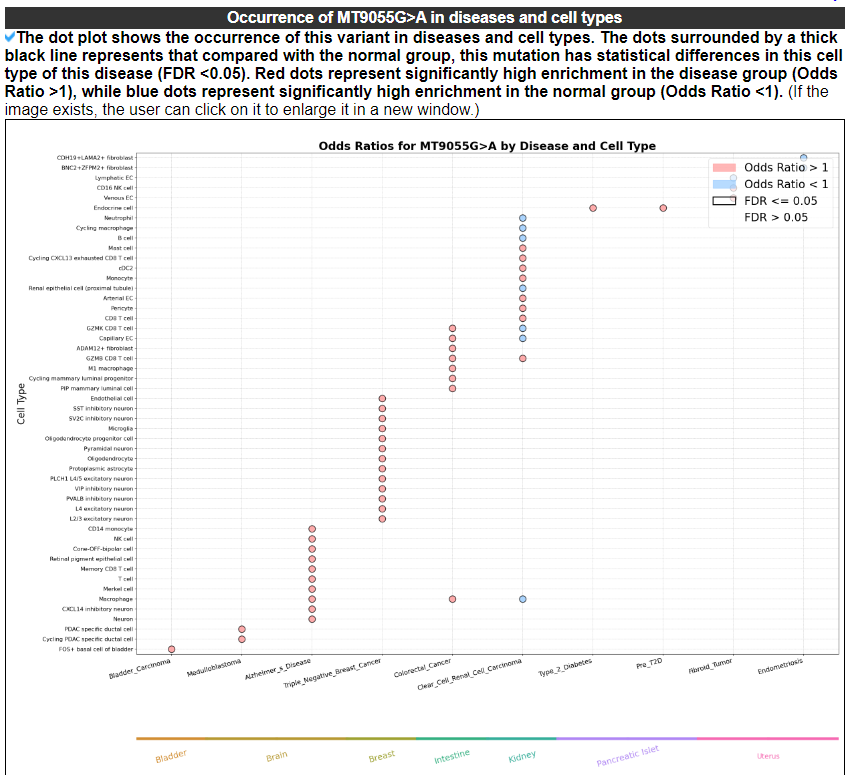
2.3.5 Occurrence of this variant in diseases and cell types
The dot plot shows the occurrence of this variant in diseases and cell types. The dots surrounded by a thick black line represents that compared with the normal group, this mutation has statistical differences in this cell type of this disease (FDR <0.05). Red dots represent significantly high enrichment in the disease group (Odds Ratio >1), while blue dots represent significantly high enrichment in the normal group (Odds Ratio less than 1).
2.3.6 Other diseases related to this variant that have been studied before
The category displays other diseases related to this variant that have been studied before
After browsing a disease or clicking on a disease link, you will be redirected to the disease analysis results page. The page includes 7 modules.
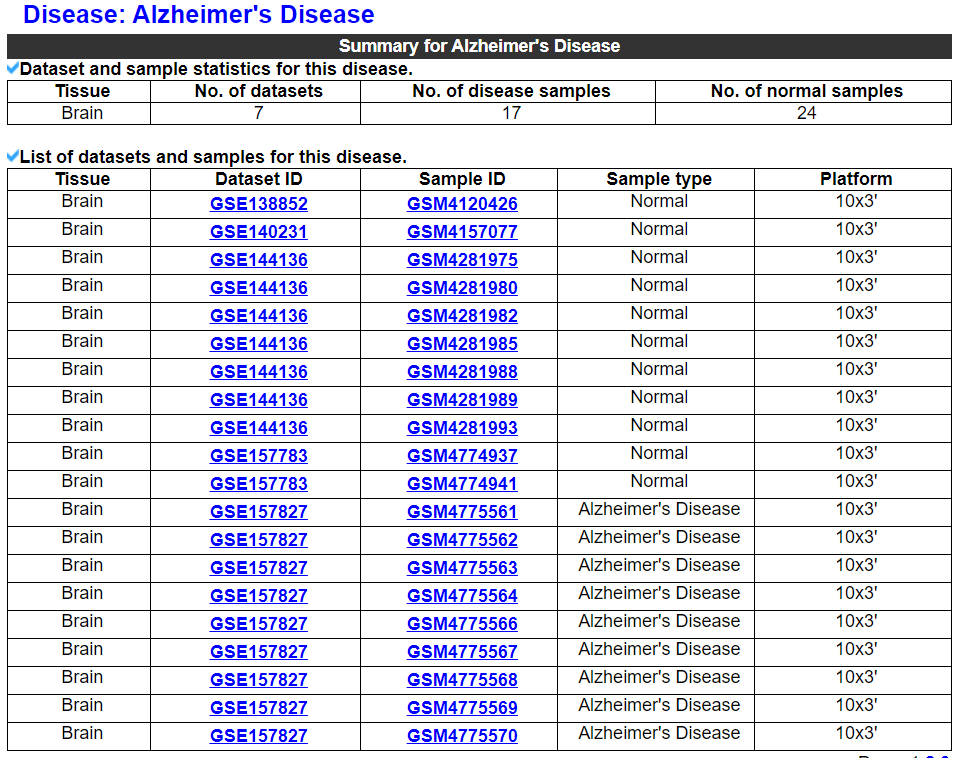
2.4.1 Disease summary
This category displays dataset and sample statistics and a list of datasets and samples for this disease.
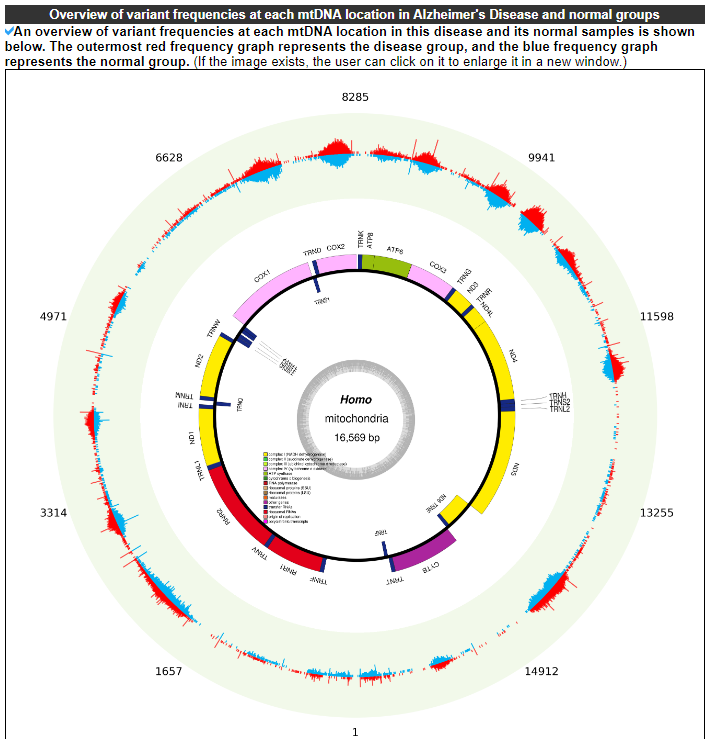
2.4.2 Overview of variant frequencies at each mtDNA location in disease and normal groups
This category displays an overview of variant frequencies at each mtDNA location in this disease and its normal samples. The outermost red frequency graph represents the disease group, and the blue frequency graph represents the normal group.
2.4.3 Overview of variants in different cell types in disease and normal groups
The heatmap shows the variant situations in different cell types in this disease and its normal samples. The left side is the disease group and the right side is the normal group. The rows are the variants and the columns are the cells labeled with the cell type. Red color indicates that the cell has the variant.
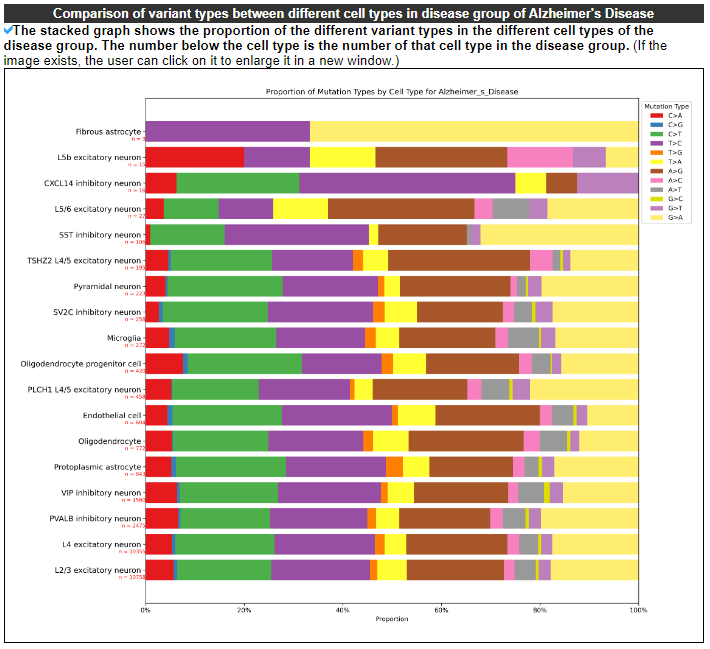
2.4.4 Comparison of variant types between different cell types in disease group
The stacked graph shows the proportion of the different variant types in the different cell types of the disease group. The number below the cell type is the number of that cell type in the disease group.
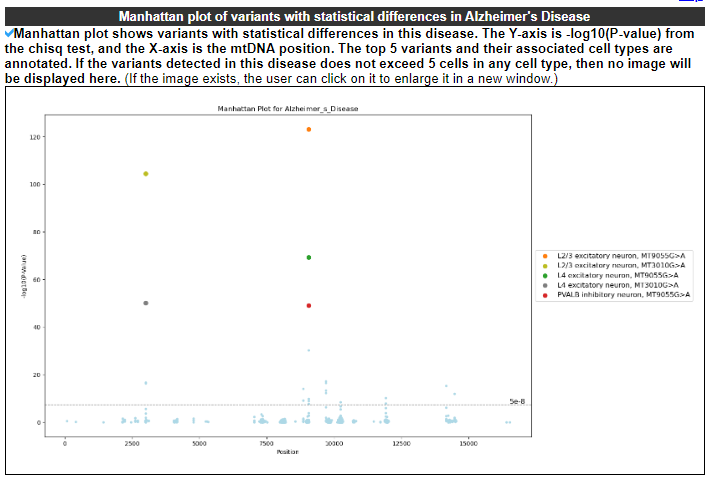
2.4.5 Manhattan plot of variants with statistical differences in this disease
Manhattan plot shows variants with statistical differences in this disease. The Y-axis is -log10(P-value) from the chisq test, and the X-axis is the mtDNA position. The top 5 variants and their associated cell types are annotated.
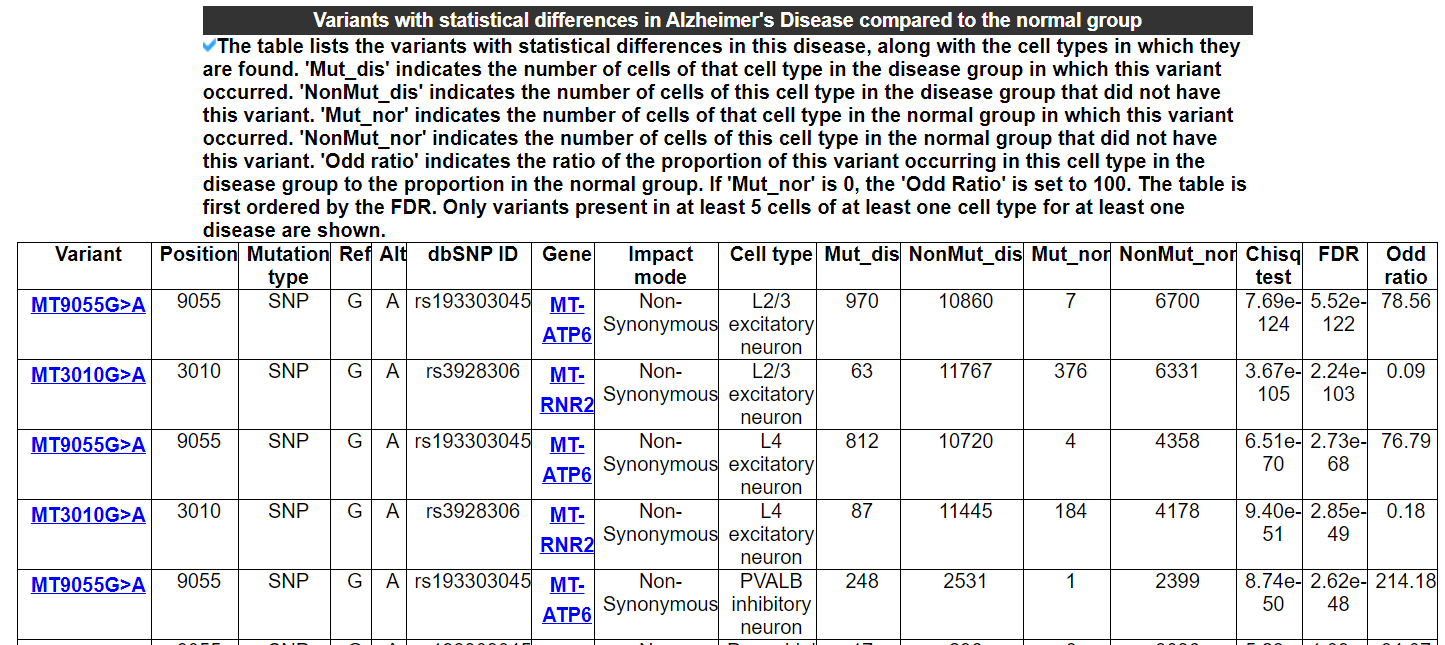
2.4.6 Variants with statistical differences in this disease
The table lists the variants with statistical differences in this disease, along with the cell types in which they are found. 'Mut_dis' indicates the number of cells of that cell type in the disease group in which this variant occurred. 'NonMut_dis' indicates the number of cells of this cell type in the disease group that did not have this variant. 'Mut_nor' indicates the number of cells of that cell type in the normal group in which this variant occurred. 'NonMut_nor' indicates the number of cells of this cell type in the normal group that did not have this variant. 'Odd ratio' indicates the ratio of the proportion of this variant occurring in this cell type in the disease group to the proportion in the normal group. If 'Mut_nor' is 0, the 'Odd Ratio' is set to 100. The table is first ordered by the FDR. Only variants present in at least 5 cells of at least one cell type for at least one disease are shown.
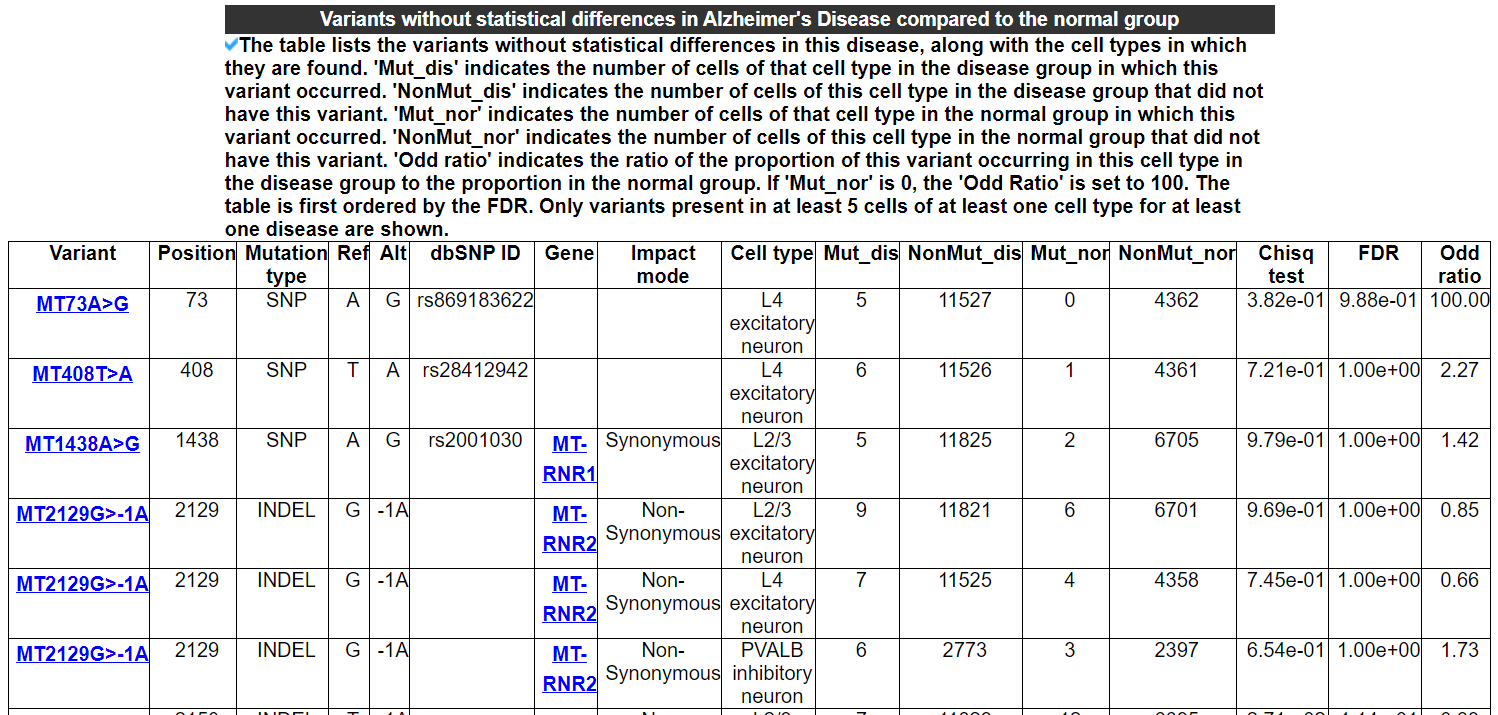
2.4.7 Variants without statistical differences in this disease
The table lists the variants without statistical differences in this disease, along with the cell types in which they are found. 'Mut_dis' indicates the number of cells of that cell type in the disease group in which this variant occurred. 'NonMut_dis' indicates the number of cells of this cell type in the disease group that did not have this variant. 'Mut_nor' indicates the number of cells of that cell type in the normal group in which this variant occurred. 'NonMut_nor' indicates the number of cells of this cell type in the normal group that did not have this variant. 'Odd ratio' indicates the ratio of the proportion of this variant occurring in this cell type in the disease group to the proportion in the normal group. If 'Mut_nor' is 0, the 'Odd Ratio' is set to 100. The table is first ordered by the FDR. Only variants present in at least 5 cells of at least one cell type for at least one disease are shown.
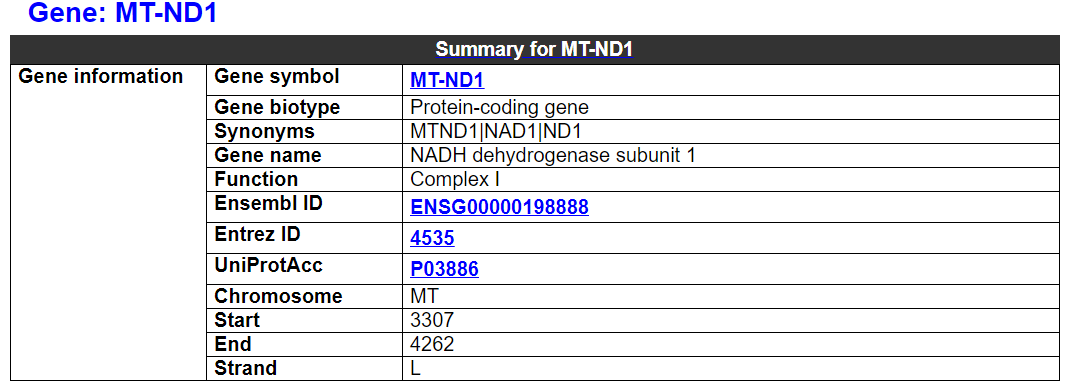
2.5.1 Gene summary
This category shows information on this gene and related mtDNA variants.
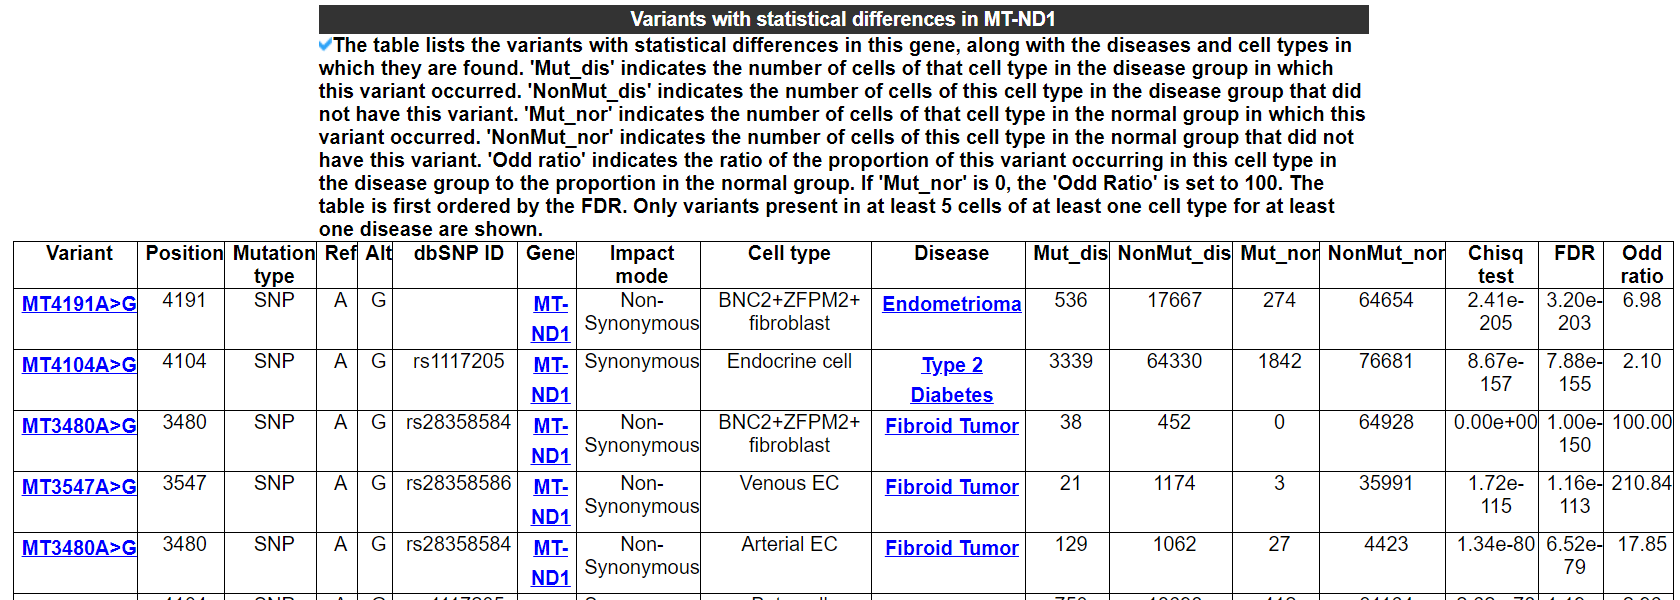
2.5.2 Variants with statistical differences in this gene
The table lists the variants with statistical differences in this gene, along with the diseases and cell types in which they are found. 'Mut_dis' indicates the number of cells of that cell type in the disease group in which this variant occurred. 'NonMut_dis' indicates the number of cells of this cell type in the disease group that did not have this variant. 'Mut_nor' indicates the number of cells of that cell type in the normal group in which this variant occurred. 'NonMut_nor' indicates the number of cells of this cell type in the normal group that did not have this variant. 'Odd ratio' indicates the ratio of the proportion of this variant occurring in this cell type in the disease group to the proportion in the normal group. If 'Mut_nor' is 0, the 'Odd Ratio' is set to 100. The table is first ordered by the FDR. Only variants present in at least 5 cells of at least one cell type for at least one disease are shown.
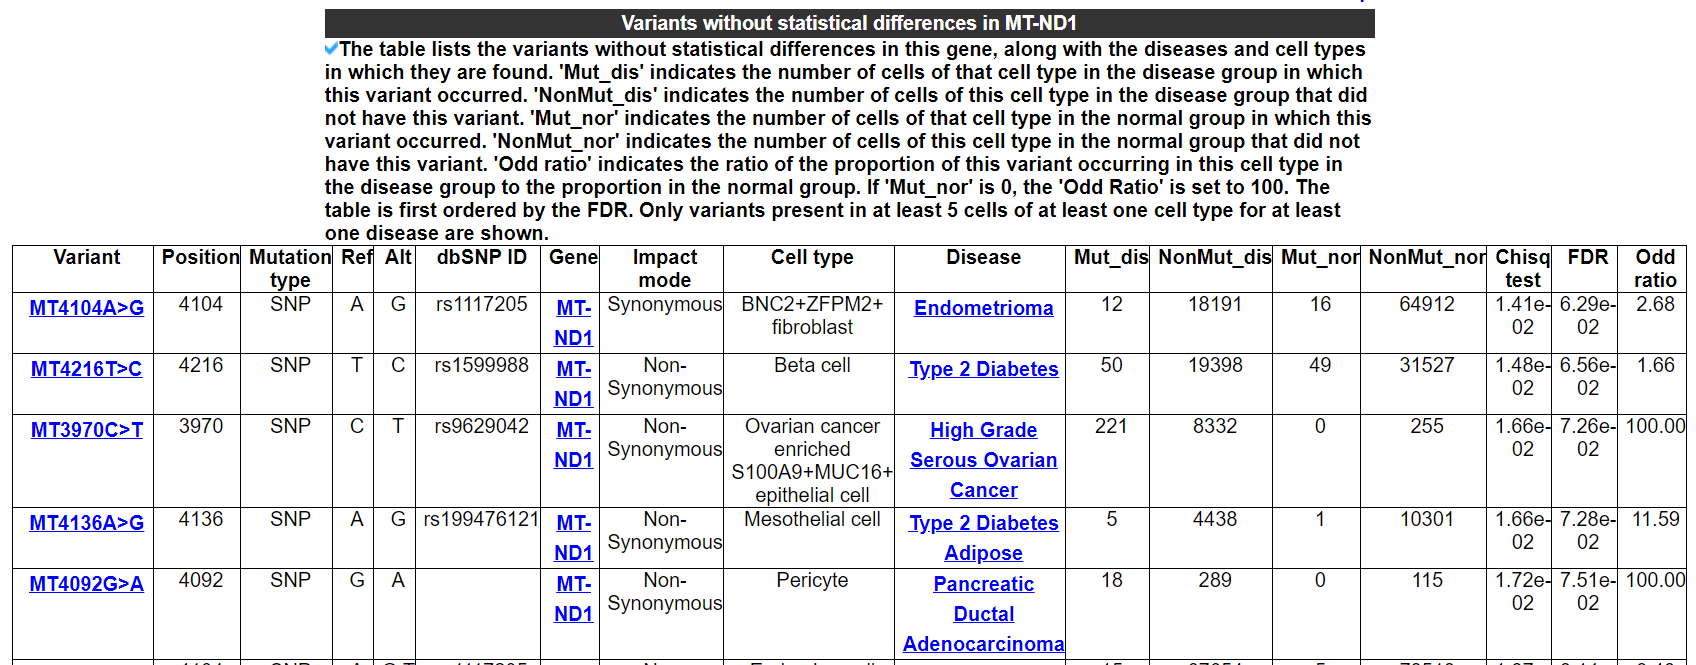
2.5.3 Variants without statistical differences in this gene
The table lists the variants without statistical differences in this gene, along with the diseases and cell types in which they are found. 'Mut_dis' indicates the number of cells of that cell type in the disease group in which this variant occurred. 'NonMut_dis' indicates the number of cells of this cell type in the disease group that did not have this variant. 'Mut_nor' indicates the number of cells of that cell type in the normal group in which this variant occurred. 'NonMut_nor' indicates the number of cells of this cell type in the normal group that did not have this variant. 'Odd ratio' indicates the ratio of the proportion of this variant occurring in this cell type in the disease group to the proportion in the normal group. If 'Mut_nor' is 0, the 'Odd Ratio' is set to 100. The table is first ordered by the FDR. Only variants present in at least 5 cells of at least one cell type for at least one disease are shown.
Each entry shows results for all diseases in each category. Only the "Mitochondrial variants that have been studied in association with other diseases" module shows tables of variants and associated other diseases.
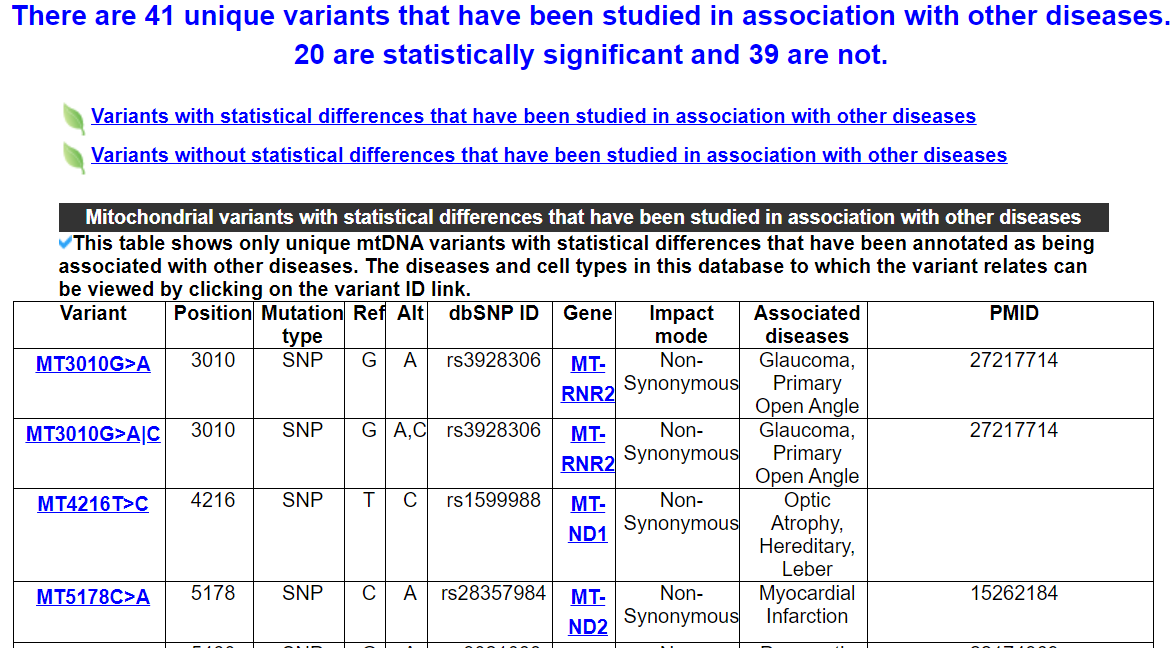
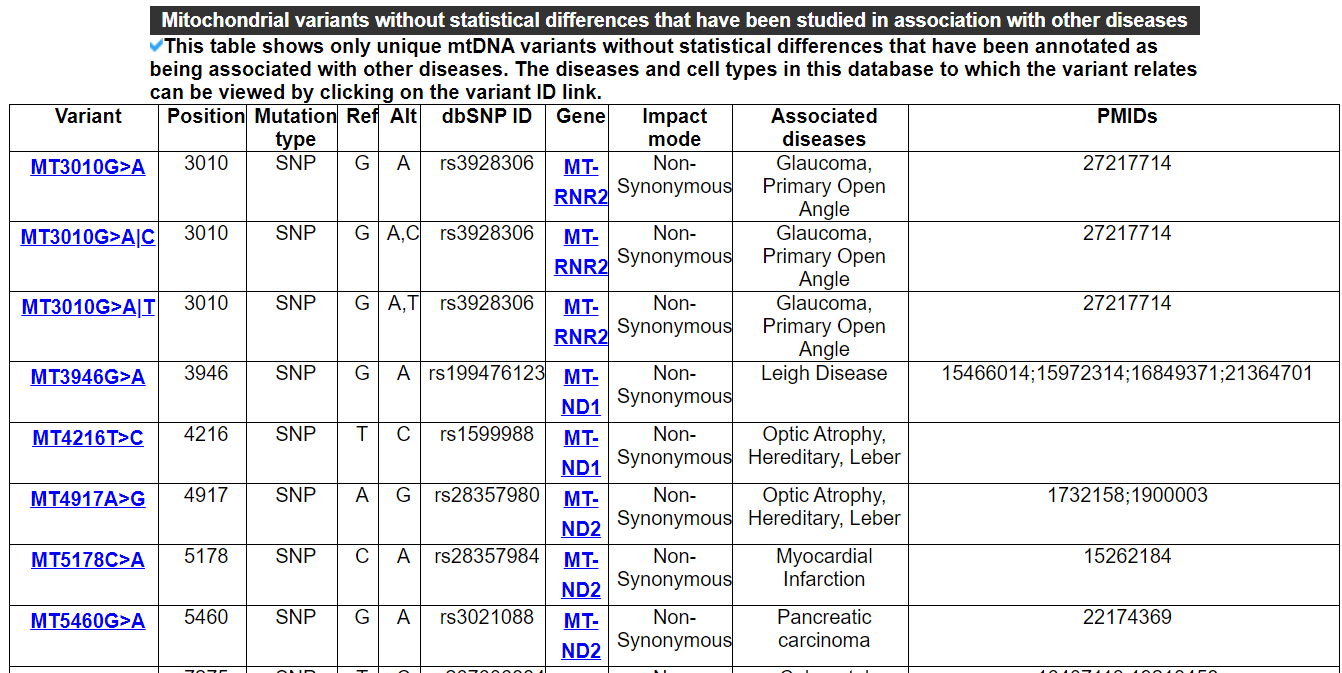
2.6.1 Mitochondrial variants that have been studied in association with other diseases
This category shows two tables. One includes mtDNA variants whith statistical differences that have been studied in association with other diseases. Another includes variants whithout statistical differences.
Please go to download page and contact page.

Copyright 2024-Present -The University of Texas Health Science Center at Houston