|
Home |
Download |
Statistics |
Examples |
Help |
Contact |
Usage of miRactDB
Navigation
1. Correlation calculation2. Screening the miRNA binding sites
3. miRNA-gene pairs with double negative or positive correlation
4. Super-enhancer score calculaton
5. Understanding annotation of miRactDB
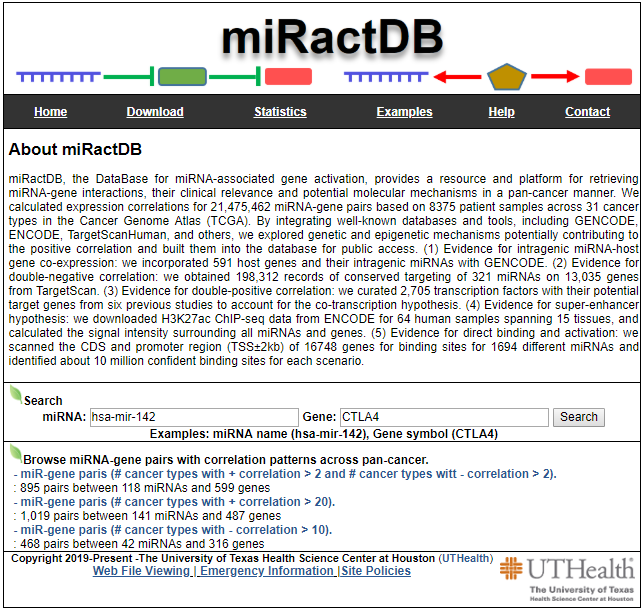
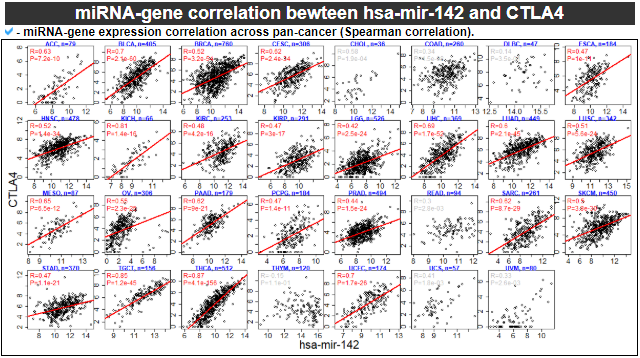
Search page, example: hsa-mir-142 and CTLA4
Correlated miRNA-gene pair search result page
Correlated miRNA-gene pair annotation result page
1) miRNA summary
2) Gene summary
3) miRNA binding sites on gene
4) miRNA expression
5) Gene expression
6) miRNA-gene correlation
7) Host gene information
8) Evidence for indirect activation through the double-negative loop
9) Evidence for co-transcription of both miRNA and gene
10) Super-enhancer score across miRNA loci
11) Super-enhancer score across gene loci
12) Clinical relevance of this miRNA
13) Clinical relevance of this gene
15) Related drugs with this gene
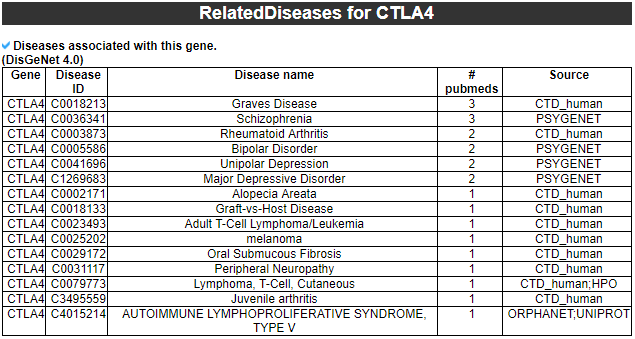
16) Related diseases with this gene
5. Download data and contact us
1. Correlation calculation
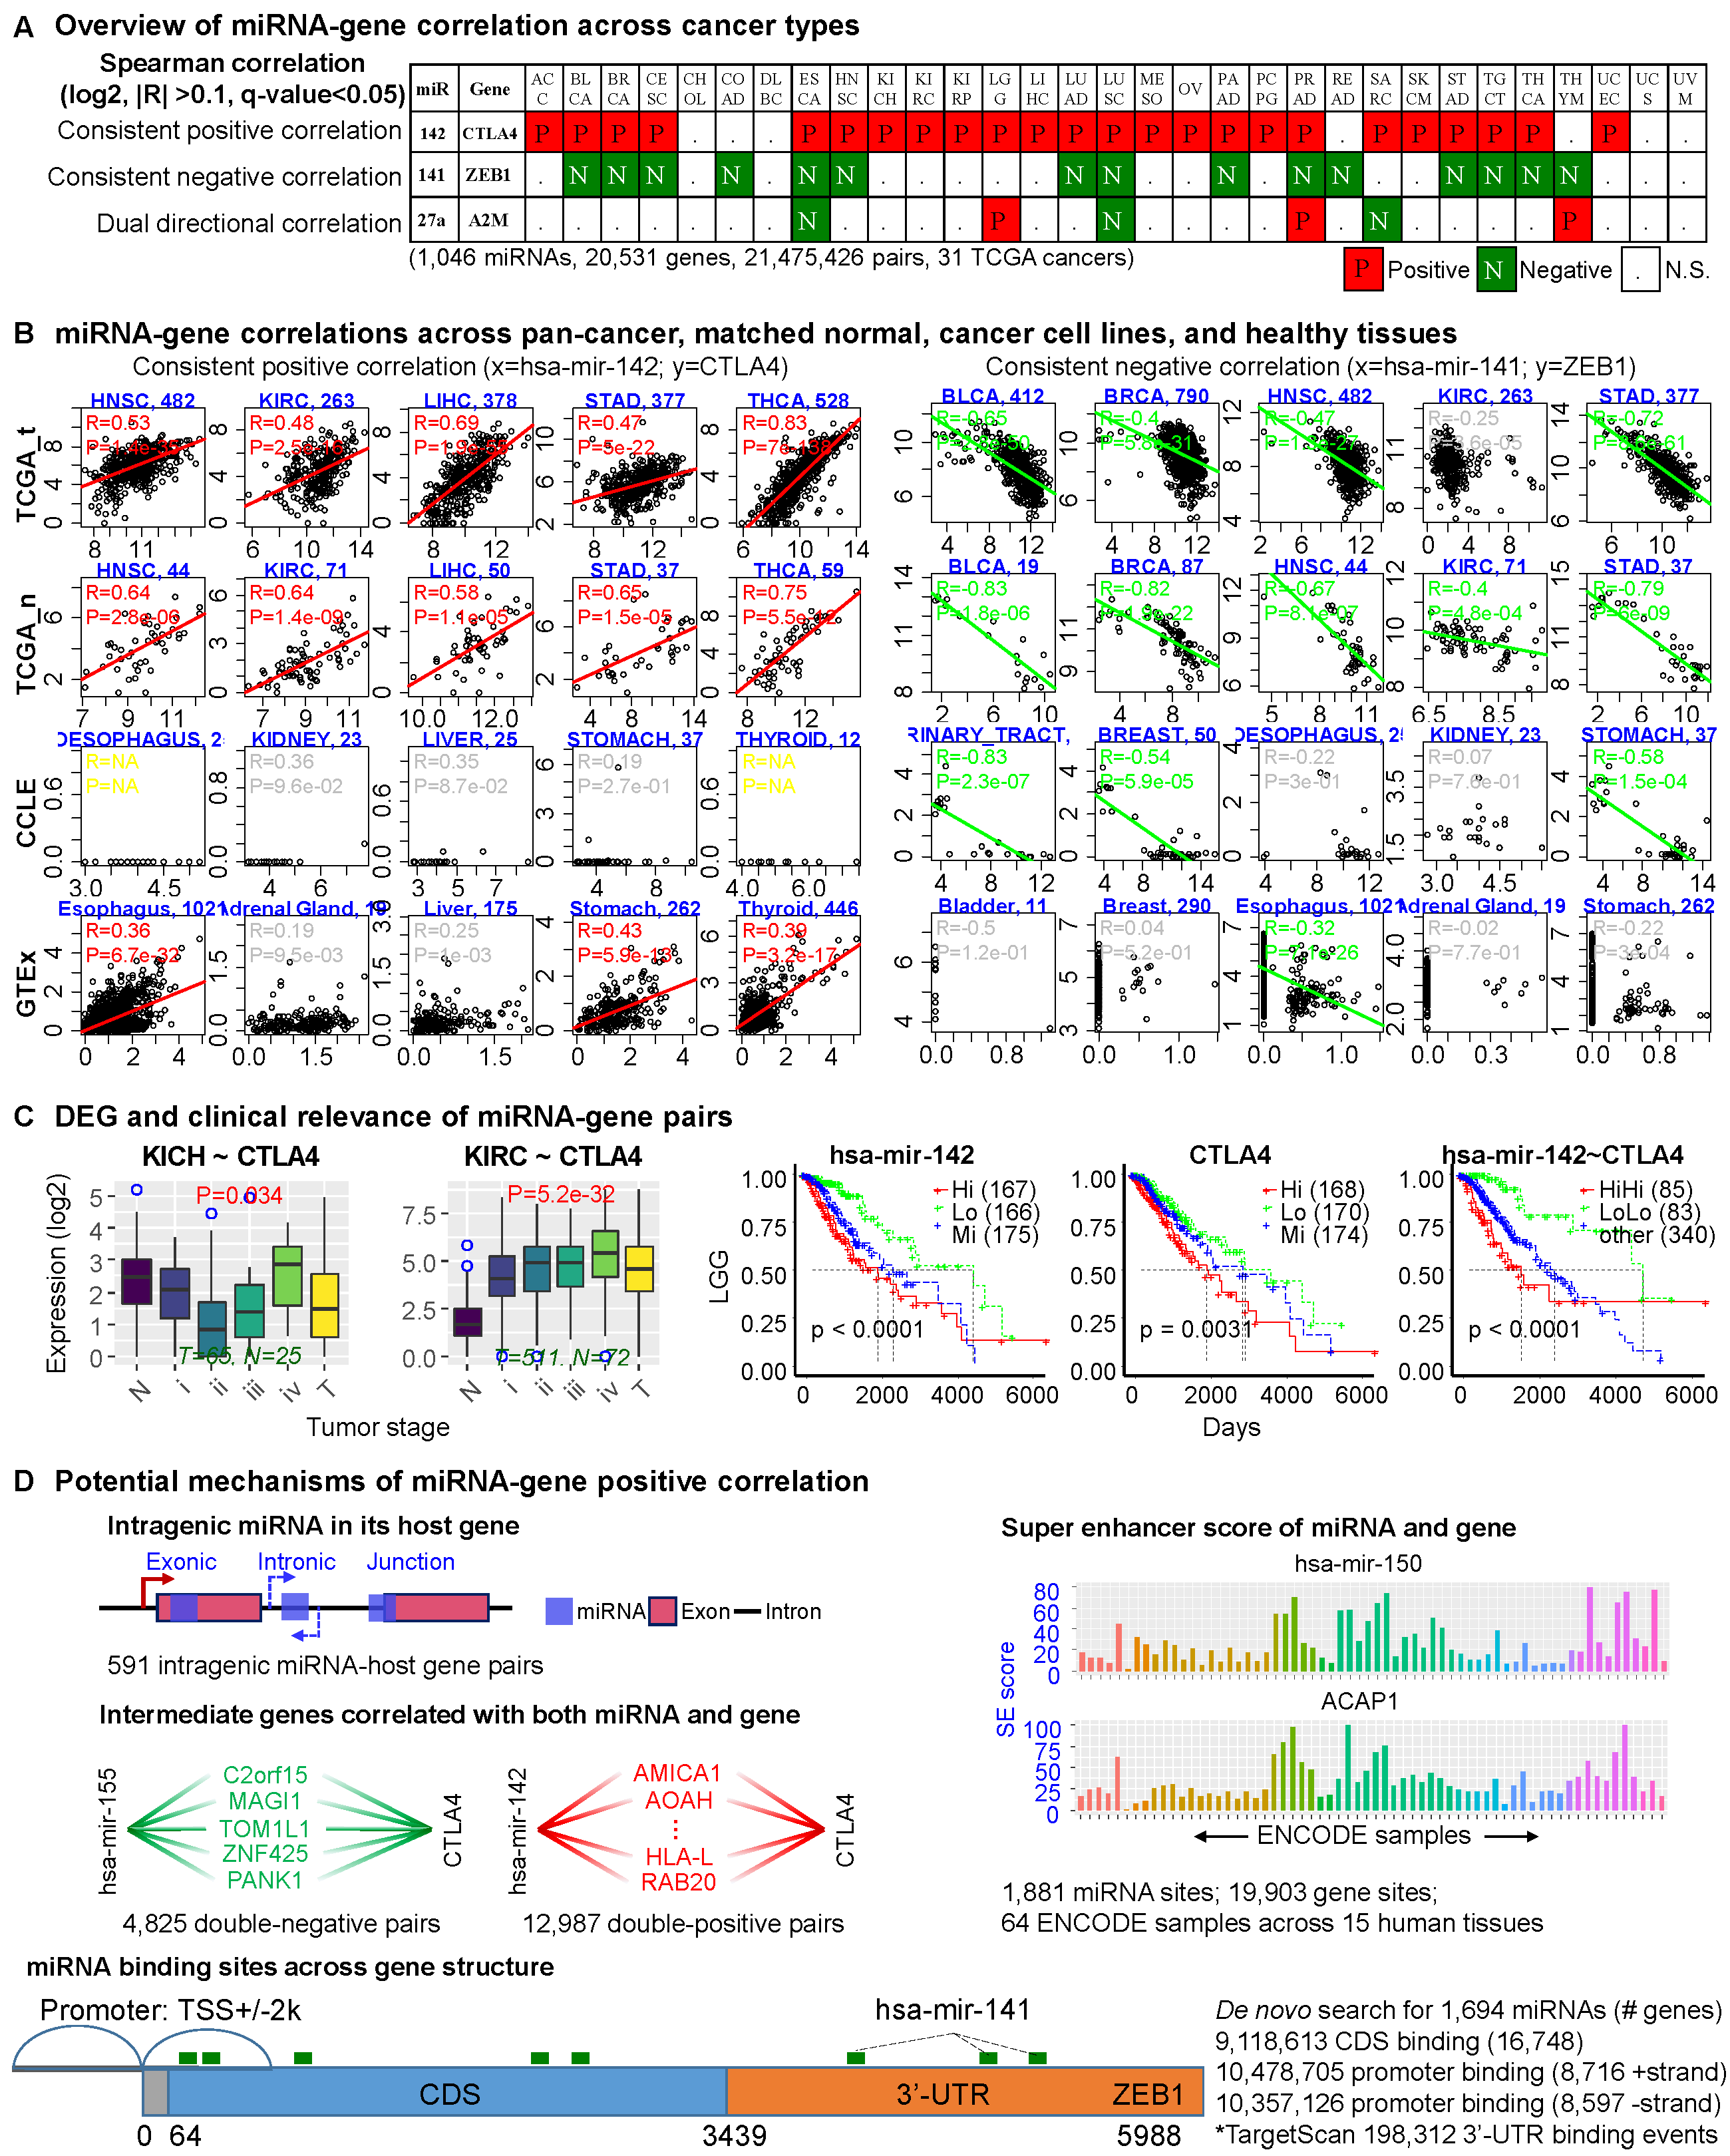
We downloaded the miRNA and gene expression data (both level 3), as well as survival information of each cancer from TCGA data portal (https://portal.gdc.cancer.gov/). We excluded three cancers, including FPPP, GBM and LAML due to small sample size or platform inconsistency. The pan-cancer analyses eventually consisted of 1,046 miRNAs and 20,531 genes resulting in 21,475,462 miRNA-gene pairs based on 8,375 patient samples across 31 TCGA cancer types. We calculated the Spearman correlation of each miRNA-gene pair (log2 transformed), and set the significance criterion as |R| > 0.1 and Hochberg adjusted p-value < 0.05. Detailed information is in the statistics page.
2. Screening the miRNA binding sites
We downloaded the coding sequence (CDS, n = 20358) of all genes from GENCODE (release 30), and extracted the sequence of the TSS±2kb region of each gene. We downloaded the miRNA family information from TargetScanHuman v7.2 (miR_Family_Infor.txt) and extracted the records for homo sapiens (n = 2064). Then we scanned potential binding sites of each miRNA on the CDS and promoter regions of all genes by the open tool targetscan.pl provided by TargetScan. We scanned the promoter of genes with positive (n = 8715) and negative (n = 8596) strand separately. After scanning, we parsed the miRNA family information and mapped the families to associated individual miRNAs.
3. miRNA-gene pairs with double negative or positive correlation
We checked two types of indirect miRNA-gene interactions for the PanCan10 positive correlations. First, for each pair, since the constituent miRNA might upregulate its partner gene by inhibiting its upstream suppressor, we explored the double-negative patterns by screening all genes that satisfy two criteria: (1) the candidate gene is negatively correlated with both the constituent miRNA and gene of the pair and (2) the candidate gene is a conserved target of the constituent miRNA predicted by TargetScanHuman. Second, since a positively correlated miRNA-gene pair might be regulated by shared transcription activators, we detected the double-positive patterns by screening genes satisfying the following two criteria: (1) the candidate gene is positively correlated with both the constituent miRNA and gene and (2) the candidate gene is a transcription factor (TF) of the constituent gene predicted by at least one of six published databases.
4. Super-enhancer score calculaton
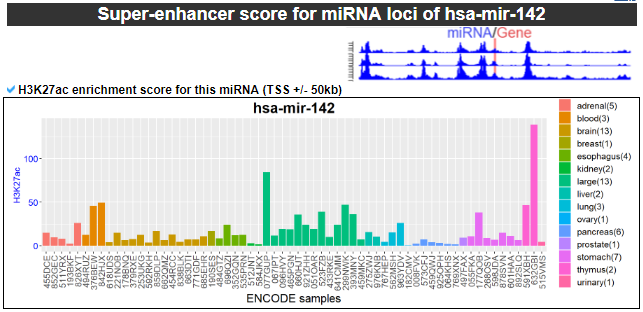
We investigated the super-enhancer formation profile surrounding each miRNA and gene TSS with a modified ROSE pipeline. We quantified the ChIP-seq signal intensity of H3K27ac in each miRNA and gene’s region based on 64 samples spanning 15 human tissues from ENCODE. In the present work, we calculated the super-enhancer score for all miRNAs and genes in all ENCODE samples and drew each miRNA/gene (across samples) with a bar plot.
Understanding annotation of miRactDB
Search page, example: hsa-mir-142 and CTLA4
- Input query: Official HUGO gene symbol or Entrez gene ID.
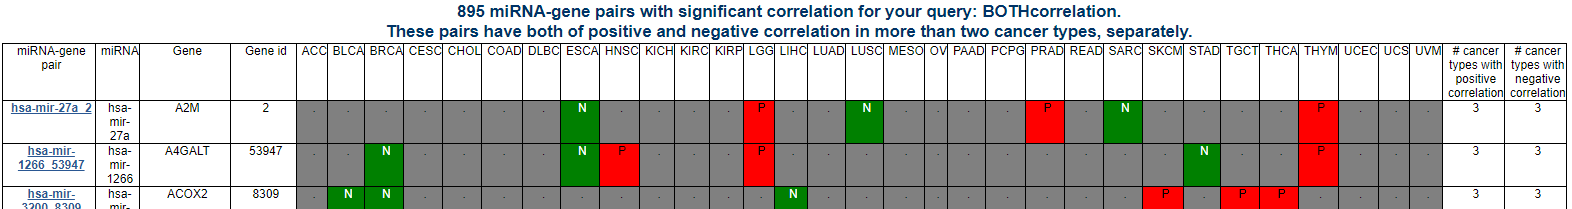
Correlated miRNA-gene pair search result page
For your query of miRNA-gene pair, you can see the significant correlations across pan-cancer. If you click the link, 'Browse miRNA-gene pairs with corerlation patterns' in the home page, then it will show the miRNA-gene pair list of individual correlation patterns including negative correlation only, positive correlation only, and both negative and positive correlations across pan-cancer.


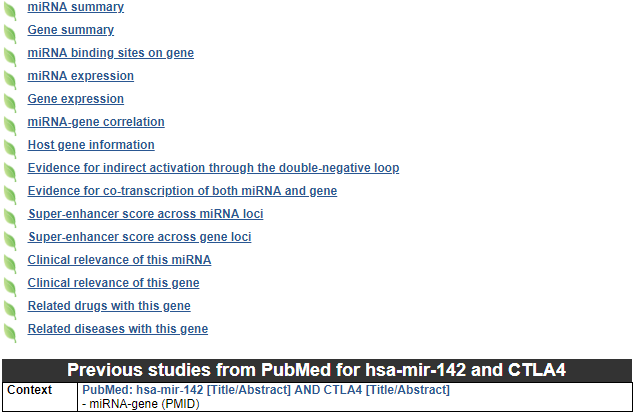
Correlated miRNA-gene pair annotation result page
These are miRactDB's annotation categories for your query with links to their corresponding annotation parts. First, it shows the manually curated literature information for the queiry miRNA-gene pair.
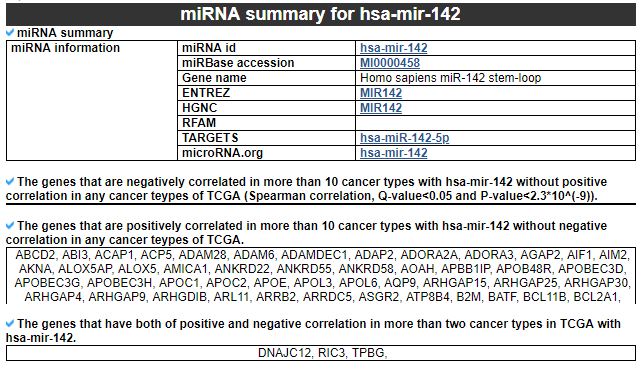
1) miRNA summary
This category shows the information of the significantly correlated miRNA. First, it shows the miRNA's overall information. Next, this category shows the list of genes with different correlation patterns across TCGA pan-cancer.
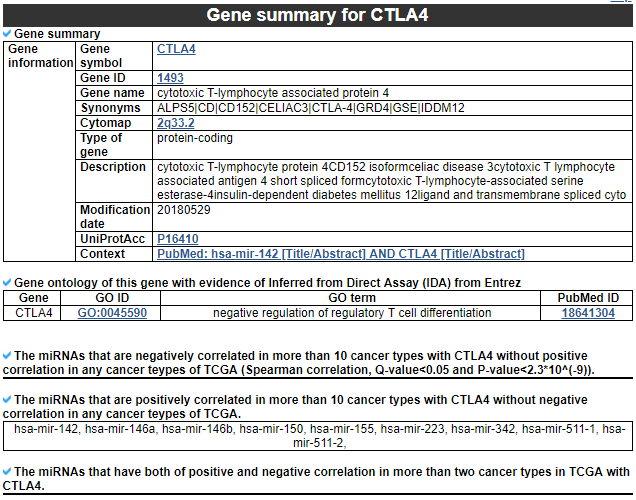
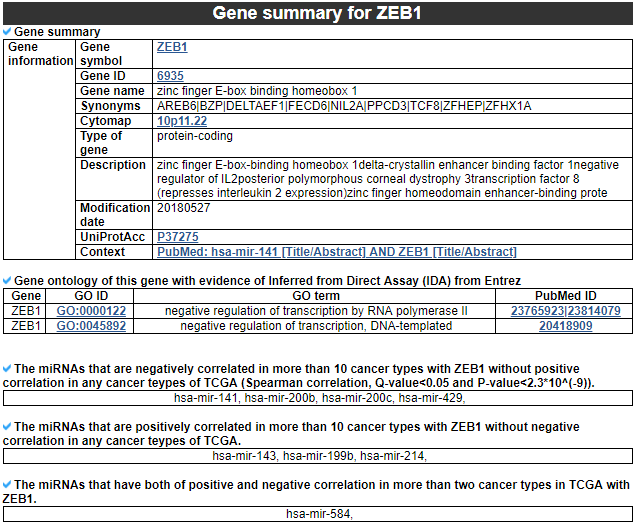
2) Gene summary
This category provides the information of significantly correlated gene. Firstly, it shows the gene's overall information. Next, this category shows the list of miRNAs with different correlation patterns across TCGA pan-cancer.
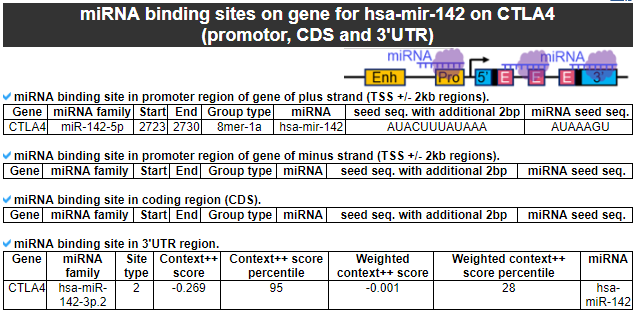
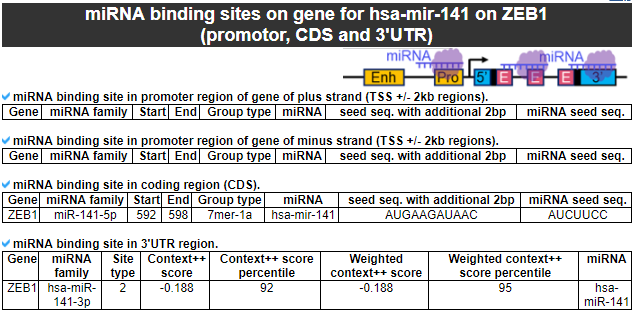
3) miRNA binding sites on gene
This category provides the miRNA binding site information across the whole gene body.
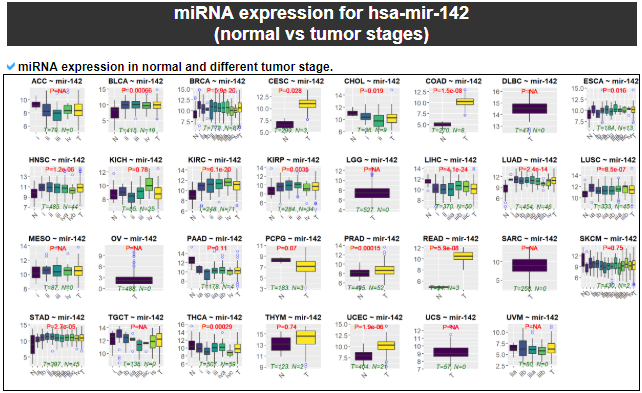
4) miRNA expression
This category provides the the differentially expressed miRNA analysis among the samples with different miRNA expression levels with normal samples.
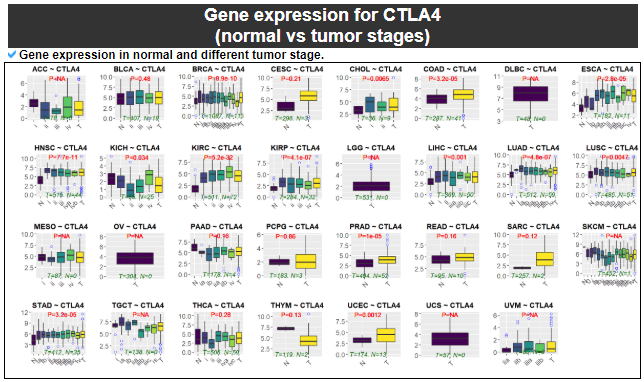
5) Gene expression
This category provides the the differentially expressed gene analysis among the samples with different gene expression levels with normal samples.
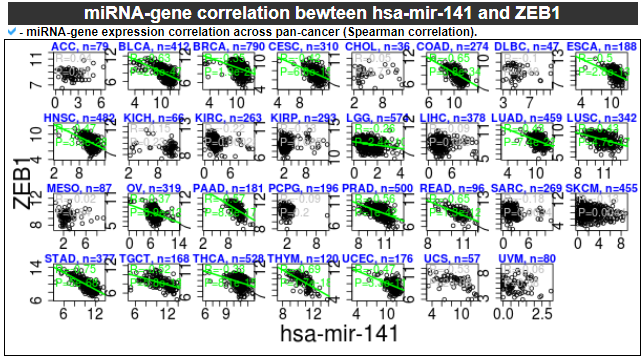
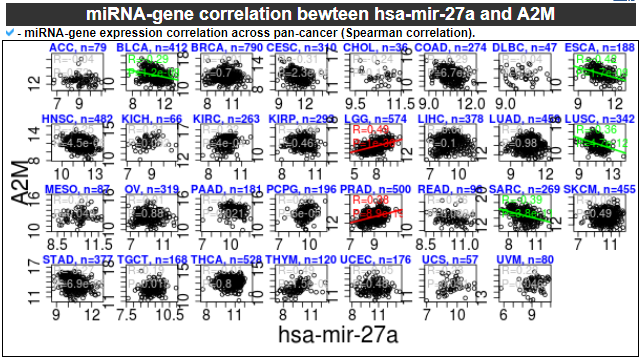
6) miRNA-gene correlation
This category provides the scatter plot with regression line between miRNA and gene expression values to show the correlations.
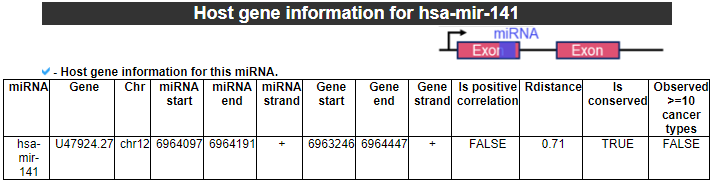
7) Host gene information
This category provides the host gene information that is significantlly correlated with this miRNA.
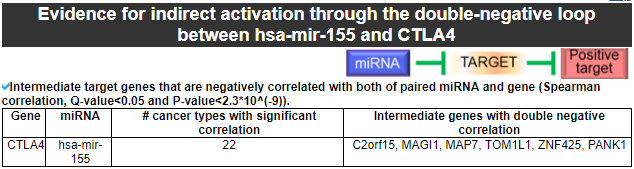
8) Evidence for indirect activation through the double-negative loop
This category provides the intermediate genes that have the significantly negative correlation with both of our miRNA for our gene.
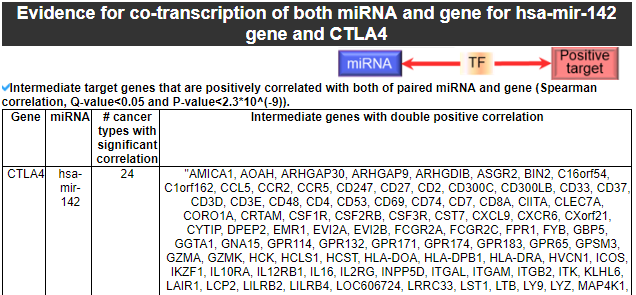
9) Evidence for co-transcription of both miRNA and gene
This category provides the intermediate genes that have the significantly positive correlation with both of our miRNA for our gene.
10) Super-enhancer score across miRNA loci
This category provides the enriched super-enhancer score for our miRNA.
11) Super-enhancer score across gene loci
This category provides the enriched super-enhancer score for our gene.
12) Clinical relevance of this miRNA
This category provides the survival test results based on the miRNA expression levels per cancer type.
13) Clinical relevance of this gene
This category provides the survival test results based on the gene expression levels per cancer type.
14) 'Related drugs with this gene category'
This table provides the DrugBank information of approved drugs related with exon skipped gene.
15) 'Related diseases with this gene' category
This table provides disease information related to the exon skipped gene.
6. Download data and contact us
Please go to download page and contact page.