|
||||||
|
 | |
| |
| |
| Open reading frame (ORF) annotation in the exon skipping event |
| |
| 3'-UTR located exon skipping events lost miRNA binding sites |
| |
| |
| Splicing Quantitative Trait Loci (sQTLs) in the skipped exons |
| |
| |
|
Gene summary for ITPR1 |
 Gene summary Gene summary |
| Gene ontology of each this gene with evidence of Inferred from Direct Assay (IDA) from Entrez |
| Gene | GO ID | GO term | PubMed ID |
| ITPR1 | GO:0001666 | response to hypoxia | 19120137 |
| ITPR1 | GO:0050849 | negative regulation of calcium-mediated signaling | 16793548 |
Top |
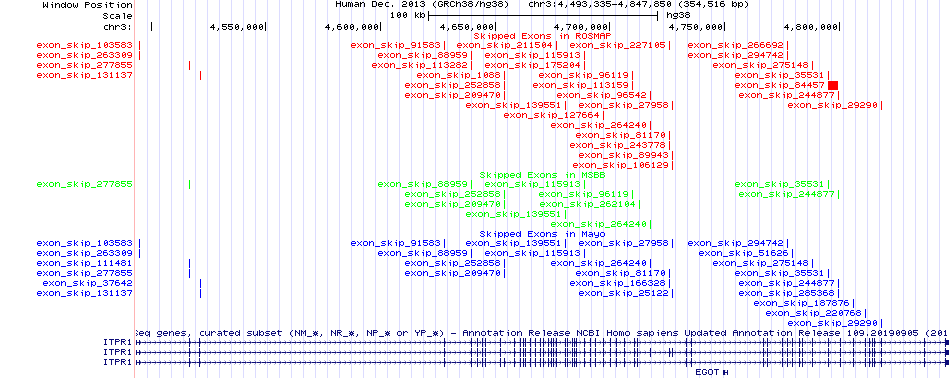
Gene structures and expression levels for ITPR1 |
| Skipped exons in the ROSMAP, MSBB, and Mayo based on Ensembl gene isoform structure. * Click on the image to open the UCSC genome browser with custom track showing this image in a new window. |
 |
ENSG00000150995
| Differentially expressed gene analysis across multiple brain tissues between AD and control. |
| Tissue type | DEG direction | Base mean exp. | log2FC(AD/control) | P-value | Adj. p-value |
| Differentially expressed isoform analysis across multiple brain tissues between AD and control. |
 |
| Tissue type | DEG direction | ENST | Transcript info. | Base mean exp. | log2FC(AD/control) | P-value | Adjc. p-value |
| PG | DOWN | ENST00000467056.6 | ITPR1-207:protein_coding:ITPR1 | 6.496201e+00 | -1.162221e+00 | 5.355160e-03 | 4.792920e-02 |
| CB | UP | ENST00000472205.1 | ITPR1-209:retained_intron:ITPR1 | 2.007774e+00 | 1.574808e+00 | 9.474001e-04 | 4.936281e-03 |
| CB | UP | ENST00000467545.6 | ITPR1-208:retained_intron:ITPR1 | 7.550149e+01 | 1.551515e+00 | 1.087311e-02 | 3.722999e-02 |
| TC | DOWN | ENST00000487016.1 | ITPR1-214:lncRNA:ITPR1 | 1.207818e+00 | -8.456018e-01 | 5.233860e-03 | 3.470971e-02 |
| Landscape of isoform expressions across multiple brain tissues between AD and control. |
 |
Top |
Exon skipping events with PSIs in ROSMAP, MSBB, and Mayo for ITPR1 |
| Landscape of individual exon skipping event across AD tissues and controls (PSI heatmap). |
 |
| All exon skipping events in AD cohorts. |
| Exon skip ID | chr | Exons involved in exon skipping | Skipped exon |
| exon_skip_103583 | chr3 | 4493583:4493605:4494431:4494506:4516476:4516583 | 4494431:4494506 |
| exon_skip_106129 | chr3 | 4725546:4725581:4727126:4727173:4733088:4733220 | 4727126:4727173 |
| exon_skip_1088 | chr3 | 4652123:4652218:4653842:4653886:4658124:4658151 | 4653842:4653886 |
| exon_skip_113159 | chr3 | 4706167:4706351:4709692:4709729:4710325:4710473 | 4709692:4709729 |
| exon_skip_115913 | chr3 | 4685173:4685206:4688495:4688620:4691144:4691344 | 4688495:4688620 |
| exon_skip_127664 | chr3 | 4693600:4693741:4697147:4697272:4699813:4699941 | 4697147:4697272 |
| exon_skip_139551 | chr3 | 4676614:4676801:4680553:4680691:4681364:4681418 | 4680553:4680691 |
| exon_skip_187876 | chr3 | 4800425:4800600:4806103:4806267:4811265:4811460 | 4806103:4806267 |
| exon_skip_220768 | chr3 | 4806103:4806267:4811265:4811460:4813142:4813234 | 4811265:4811460 |
| exon_skip_244877 | chr3 | 4795065:4795187:4799355:4799387:4800425:4800600 | 4799355:4799387 |
| exon_skip_252858 | chr3 | 4652123:4652218:4653842:4653886:4658124:4658278 | 4653842:4653886 |
| exon_skip_264240 | chr3 | 4711757:4711868:4717367:4717399:4725546:4725581 | 4717367:4717399 |
| exon_skip_275148 | chr3 | 4783816:4783920:4787947:4788139:4795065:4795187 | 4787947:4788139 |
| exon_skip_277855 | chr3 | 4494431:4494506:4516476:4516583:4521024:4521094 | 4516476:4516583 |
| exon_skip_27958 | chr3 | 4711757:4711868:4727123:4727173:4733088:4733220 | 4727123:4727173 |
| exon_skip_285368 | chr3 | 4795070:4795187:4799355:4799387:4800425:4800600 | 4799355:4799387 |
| exon_skip_29290 | chr3 | 4815053:4815218:4818082:4818242:4836774:4836935 | 4818082:4818242 |
| exon_skip_294742 | chr3 | 4775429:4775442:4777264:4777374:4779550:4779645 | 4777264:4777374 |
| exon_skip_35531 | chr3 | 4787947:4788139:4795065:4795187:4800425:4800600 | 4795065:4795187 |
| exon_skip_37642 | chr3 | 4516492:4516583:4521024:4521094:4627763:4627878 | 4521024:4521094 |
| exon_skip_88959 | chr3 | 4627763:4627878:4639384:4639470:4642093:4642251 | 4639384:4639470 |
| exon_skip_89943 | chr3 | 4725546:4725581:4727123:4727173:4733088:4733220 | 4727123:4727173 |
| exon_skip_91583 | chr3 | 4521024:4521094:4627763:4627878:4639384:4639409 | 4627763:4627878 |
| exon_skip_96119 | chr3 | 4706198:4706351:4709692:4709729:4710325:4710473 | 4709692:4709729 |
| Differentially expressed PSI values of individual exon skipping events in multiple brain tissues between AD and control. |
| Exon skipping information | Tissue type | Avg(PSIs) in AD | Avg(PSIs) in control | Difference (PSI) | Adj. p-value |
Top |
Open reading frame (ORF) annotation in the exon skipping event for ITPR1 |
| Open reading frame (ORF) of individual exon skipping events in ROSMAP based on the Ensembl gene structure combined from isoforms. |
| ENST | Start of skipped exon | End of skipped exon | ORF |
| Open reading frame (ORF) of individual exon skipping events in MSBB based on the Ensembl gene structure combined from isoforms. |
| ENST | Start of skipped exon | End of skipped exon | ORF |
| Open reading frame (ORF) of individual exon skipping events in Mayo based on the Ensembl gene structure combined from isoforms. |
| ENST | Start of skipped exon | End of skipped exon | ORF |
Top |
Infer the effects of exon skipping event on protein functional features for ITPR1 |
p-ENSG00000150995_img4.png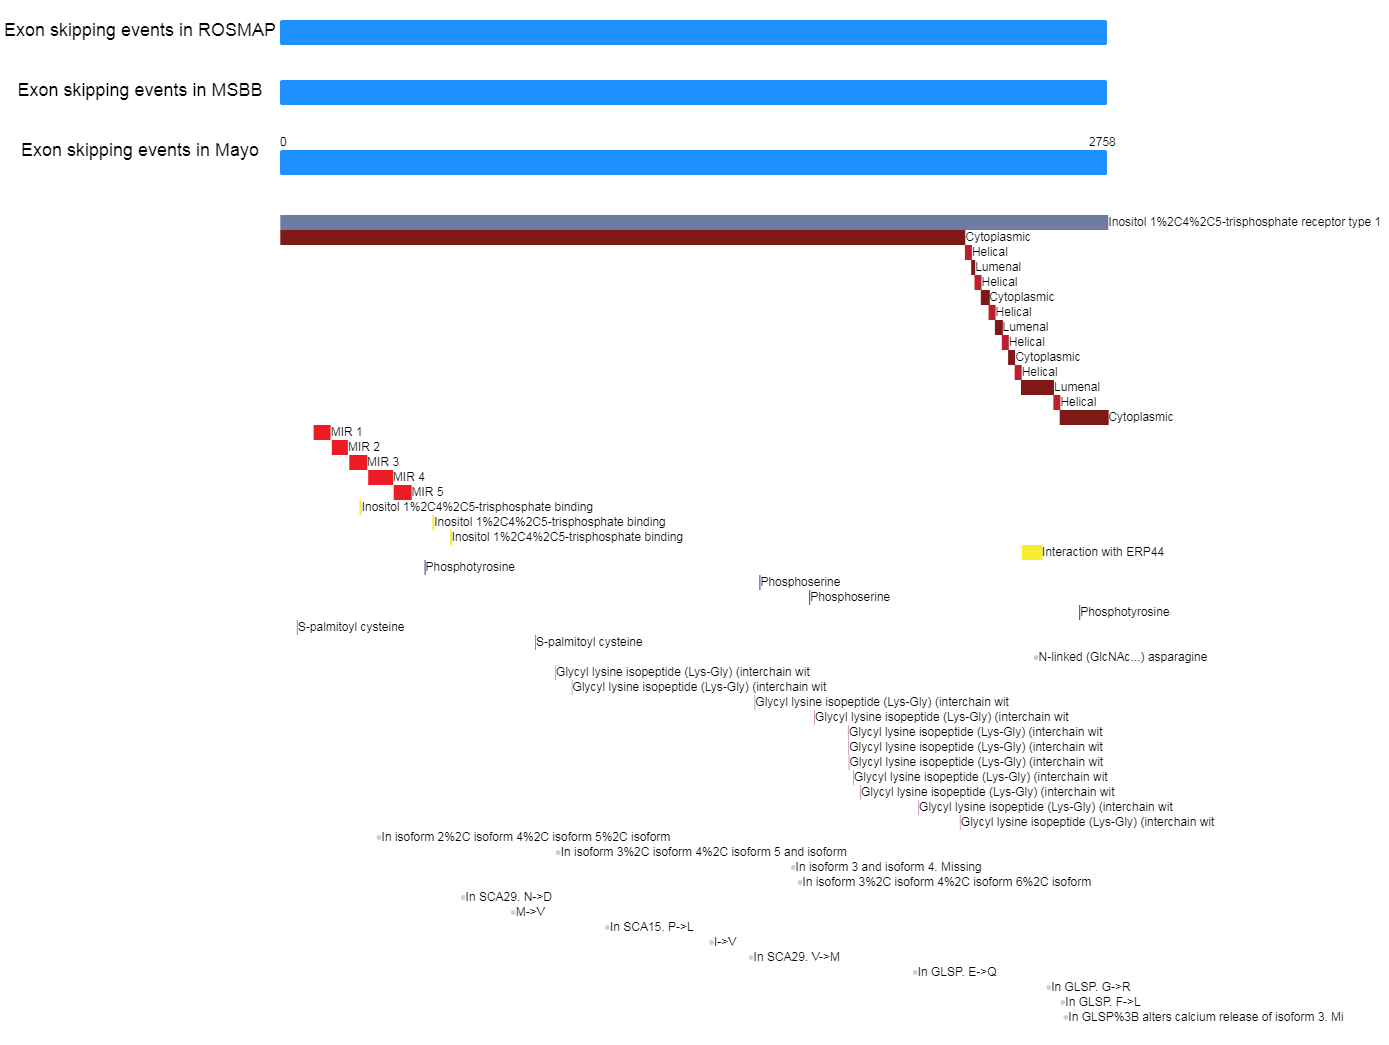 |
| Loci of skipped exons in ROSMAP across genomic, transcript, and protein sequence levels of In-frame cases. |
| ENST | Length of mRNA | Length of AA seq. | Genomic start | Genomic end | mRNA start | mRNA end | AA start | AA end |
| Loci of skipped exons in MSBB across genomic, transcript, and protein sequence levels of In-frame cases. |
| ENST | Length of mRNA | Length of AA seq. | Genomic start | Genomic end | mRNA start | mRNA end | AA start | AA end |
| Loci of skipped exons in Mayo across genomic, transcript, and protein sequence levels of In-frame cases. |
| ENST | Length of mRNA | Length of AA seq. | Genomic start | Genomic end | mRNA start | mRNA end | AA start | AA end |
| Lost protein functional features of individual exon skipping events in ROSMAP. |
| UniProt acc. | Start of exon skipping (AA) | End of exon skipping (AA) | Protein feature start (AA) | Protein feature end (AA) | Category of protein feature | Description of feature |
| Lost protein functional features of individual exon skipping events in MSBB. |
| UniProt acc. | Start of exon skipping (AA) | End of exon skipping (AA) | Protein feature start (AA) | Protein feature end (AA) | Category of protein feature | Description of feature |
| Lost protein functional features of individual exon skipping events in Mayo. |
| UniProt acc. | Start of exon skipping (AA) | End of exon skipping (AA) | Protein feature start (AA) | Protein feature end (AA) | Category of protein feature | Description of feature |
Top |
3'-UTR located exon skipping events that lost miRNA binding sites in ITPR1 |
| 3'-UTR exon skipping evnets lost miRNA binding. |
| Tissue type | ENST | Exon skip start | Exon skip end | microRNA | Binding site by TargetScan | Binding type by TargetScan | Bdinding site by miRanda | Score of miRanda | Energy by miRanda |
Top |
SNVs in the skipped exons for ITPR1 |
| - Differential PSIs between mutated versus non-mutated samples. |
| - Depth of Coverage in the skipped exon of the mutated samples. |
| - Sashimi plot in the skipped exon of the mutated samples. |
| - Non-synonymous mutations located in the skipped exons. |
| Cancer type | Sample | ESID | Skipped exon start | Skipped exon end | Mutation start | Mutation end | Mutation type | Reference seq | Mutation seq | AAchange |
| - Non-synonymous mutations located in the skipped exons in CCLE. |
| Sample | Skipped exon start | Skipped exon end | Mutation start | Mutation end | Mutation type | Reference seq | Mutation seq | AAchange |
Top |
AD stage-associated exon skippint events for ITPR1 |
| Associated exon skipping events with Braak staging or Clinical Dementia Rating (CDR). |
| AD stage info | Cohort | Tissue | SE id | Coefficient | P-value | Chromosome | Strand | E1 start | E1 end | Skipped start | Skipped end | E2 start | E2 end |
Top |
Splicing Quantitative Trait Loci (sQTL) in the exon skipping event for ITPR1 |
| sQTL information located at the skipped exons. |
| Tissue type | Exon skip ID | SNP id | Location | P-value | FDR |
Top |
Correlation with RNA binding proteins (RBPs) for ITPR1 |
| Correlated RBP and related information. |
| Tissue type | RBP name | Exon skip ID | Correlation coeifficient | P-value |
Top |
RelatedDrugs for ITPR1 |
| Approved drugs targeting this gene. (DrugBank Version 5.1.0 2018-04-02) |
| UniProtAcc | DrugBank ID | Drug name | Drug activity | Drug type | Drug status |
| Q14643 | approved | DB00201 | Caffeine | small molecule | Q14643 |
| Q14643 | approved|investigational | DB09462 | Glycerin | small molecule | Q14643 |
Top |
RelatedDiseases for ITPR1 |
| Diseases associated with this gene. (DisGeNet 4.0) |
| Gene | Disease ID | Disease name | # pubmeds | Source |
|
|