
|
Home |
Download |
Statistics |
Landscape |
Help |
Contact |
Navigation
1. Description of DRMref1.1 scRNA-seq data collection and processing
1.2 Cell clustering and annotation in scRNA data
1.3 Analysis of cell compositions
1.4 Comparison of ITH and EMT scores of malignant cells
1.5 Analysis of cell-cell interactions
1.6 Differential gene expression analysis for identifying drug resistance-related genes
1.7 Mechanism analysis for drug resistance-related DEGs
1.8 Identifying miRNAs regulating drug resistance-related genes
1.9 Motif/TF enrichment nalysis for drug resistance-related genes
2. Understanding annotation of DRMref
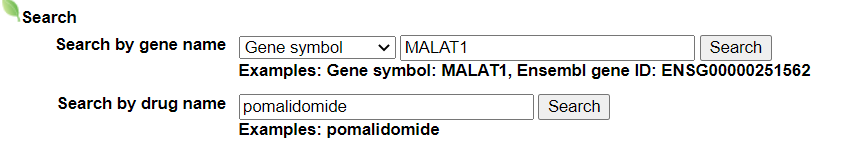
2.1 Search page, example: MALAT1, pomalidomide
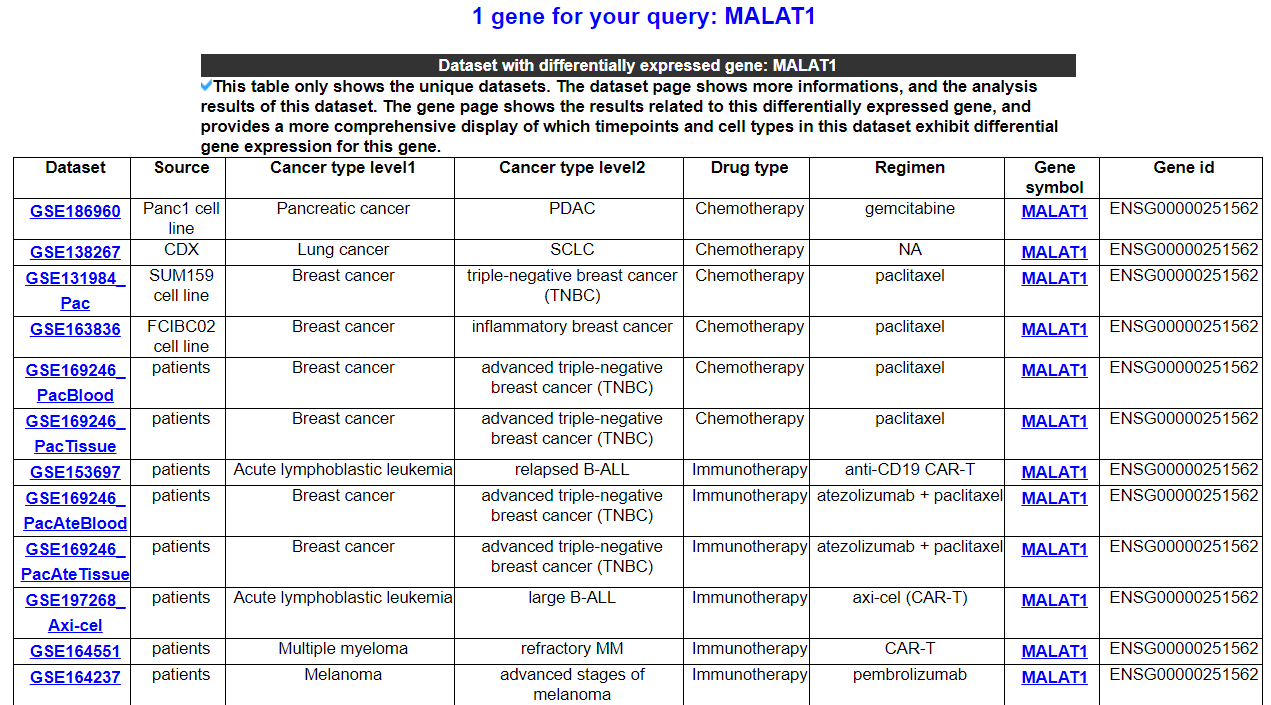
2.2 Gene search result page
2.3 Gene annotation results page
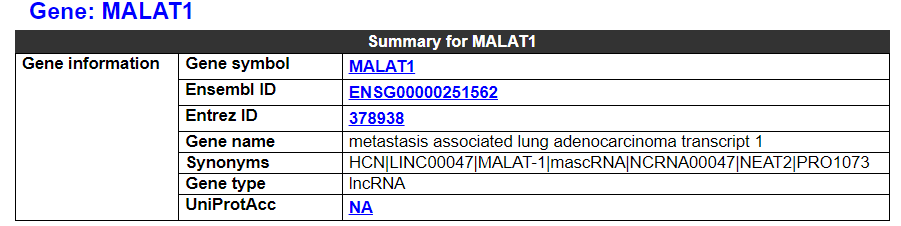
2.3.1 Gene summary
2.3.2 Datasets with differential expression of this gene
2.3.3 Expression of this gene across all datasets and cell types
2.3.4 Significant ligand-receptor pairs related to this gene
2.3.5 Known drug resistance mechanisms of this gene
2.3.6 MicroRNAs (miRNAs) regulating this gene
2.3.7 Motifs and transcription factors (TFs) regulating this gene
2.3.8 Acts as a transcription factor
2.3.9 Acts as a drug target
2.4 Dataset analysis results page
2.4.1 Dataset summary
2.4.2 Drug summary
2.4.3 Umap of single cell types and conditions
2.4.4 Comparison of cell composition
2.4.5 Comparison of ITH and EMT scores
2.4.6 Difference of cell-cell interactions
2.4.7 Differentially expressed genes
2.4.8 Mechanism analysis
2.4.9 MicroRNAs regulating DEGs
2.4.10 Motifs and TFs regulating DEGs
2.4.11 DEGs act as transcription factors
2.5 Drug search result page
2.5.1 Drug summary
2.5.2 Datasets for this drug
3. Download data and contact us
The current version of DRMref database includes 42 scRNA datasets from 30 studies, 14 of which have both pre- and post-treatment samples, covering 666 samples, 13 major cancer types, 26 minor cancer types, 35 treatment regimens, and 42 drugs. We conducted analysis on the differences in cell composition, intra-tumor heterogeneity (ITH) and epithelial-mesenchymal transition (EMT) scores, cell-cell interactions, and differentially expressed genes between the resistant and sensitive groups. DRMref also performed enrichment analyses of 6 known drug resistance mechanisms, Hallmark, KEGG and GO BP pathways. Additionally, We provide microRNAs, motifs and transcription factors (TFs) realted to drug resistance-related genes. DRMref will serve as a unique resource for studing drug resistance, drug combination therapy and discovering new targets.
We collected 42 scRNA datasets from 30 studies, 14 of which have both pre- and post-treatment samples, covering 666 samples, 13 major cancer types, 26 minor cancer types, 35 treatment regimens, and 42 drugs. According to the drug response information after therapy, the non-responsive samples collected from the pre-treatment and post-treatment timepoints are classified as the resistant group, while the responsive samples collected from the pre-treatment and post-treatment timepoints are classified as the sensitive group. For datasets of one patient or cell line, the post-treatment sample is classified as the resistant group, and the pre-treatment sample is classified as the sensitive group. For scRNA data pre-processing, only specific datasets removeed the batch effects by using Harmony. Most datasets excluded cells with the number of expressed genes fewer than 500 and excluded cells with the mitochondrial gene ratio larger than 10%. The detailed preprocessing process for each dataset can be downloaded in the download section. The whole pre-processing was performed by Seurat 4.3.0.
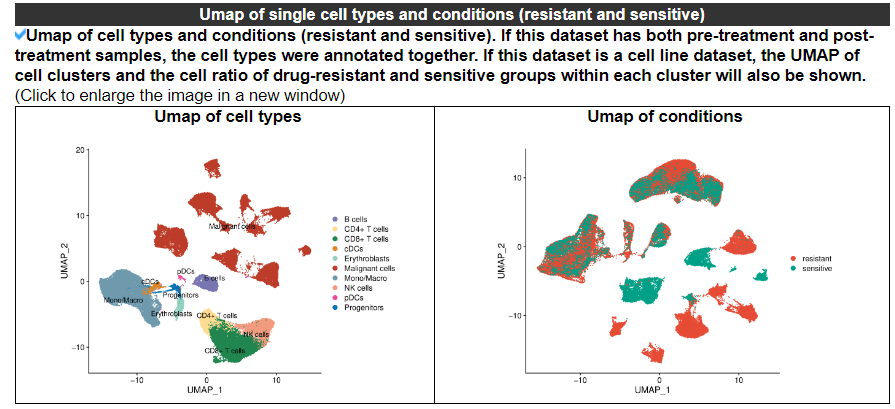
Cell clustering of scRNA data was based on the normalized gene expression profile using the SCTransform function, performed using the Seurat package in R. Cell type annotation was based on markers provided by the original paper or other cell type markers. Visualization of cell clusters of different cell types and different conditions (resistant and sensitive) was performed using the Uniform Manifold Approximation and Projection (UMAP) method. The pre- and post-treatment samples of datasets that have both pre- and post-treatment samples were annotated together.
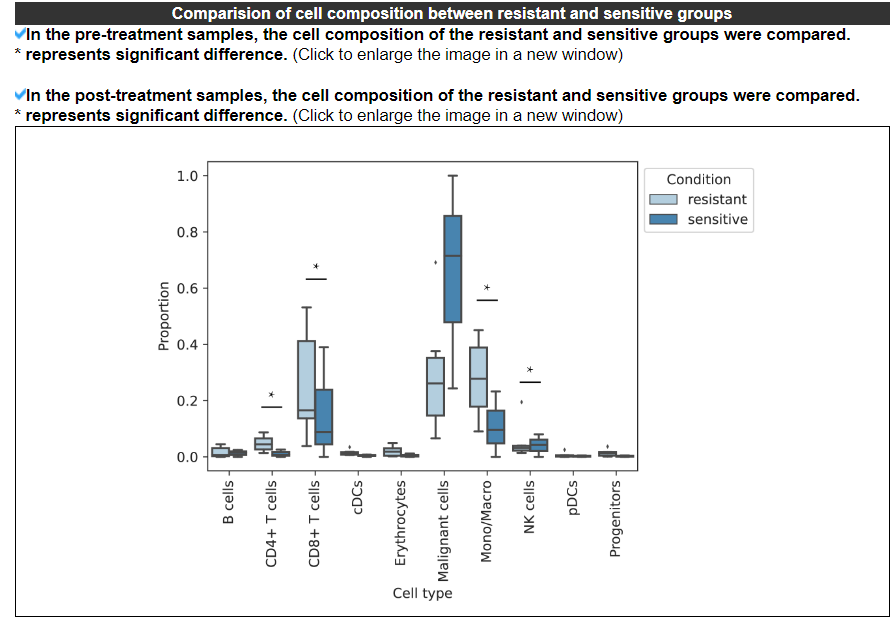
We analysed the changes in cell compositions between the resistant and sensitive groups utilizing scCODA 0.1.9. This analysis can only be performed on datasets where both the resistant and sensitive groups have a sample count of more than 3. The pre- and post-treatment samples were analyzed separately. The "est_fdr" parameter is set to 0.2.
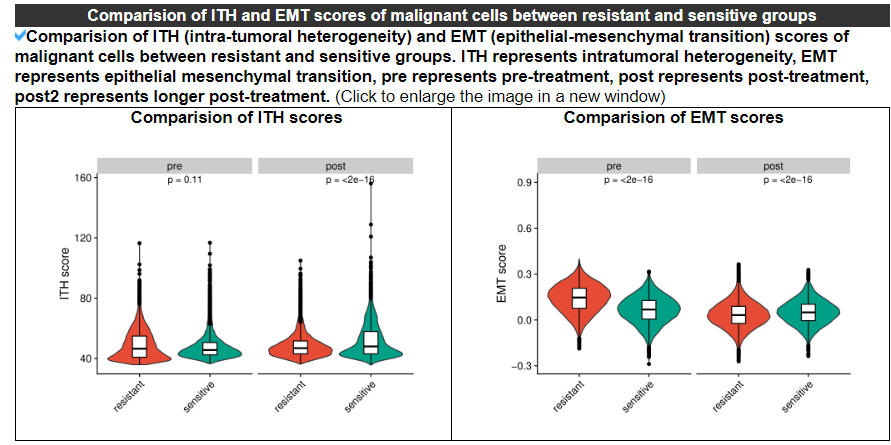
The ITH score was defined as the average Euclidean distance between the individual malignant cell and all other malignant cells, according to the first 20 principal components derived from the normalized expression levels of highly variable genes. The highly variable genes were identified by the SCTransform function in Seurat package with the default parameters. The EMT (epithelial-mesenchymal transition) score of malignant cells was calculated using the gsva function in the GSVA package, based on the "Epithelial Mesenchymal Transition" geneset obtained from the Molecular Signatures Database (MSigDB). The difference in ITH scores and EMT scores between the resistant and sensitive groups was analyzed using the wilcox.test, and the results were visualized using violin plots.
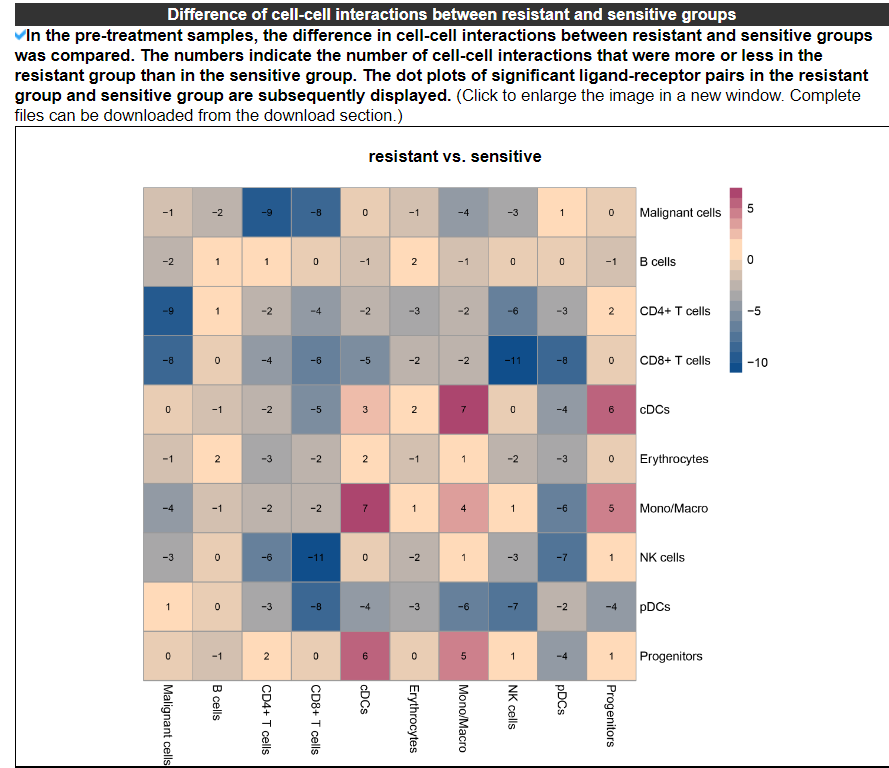
To systematically identify cell-cell communication, we performed cell-cell interaction analysis utilizing cellphonedb 4.0.0 for the resistant and sensitive groups, receptively. The pre- and post-treatment samples were analyzed separately. CellPhoneDB is a public publicly available repository of curated ligands, receptors and their interactions. The significant ligand-receptor interaction pairs were selected with the significant value p<0.05. The difference of cell-cell communications between the resistant and sensitive groups were shown using heatmap. The numbers indicate the count of cell-cell interactions that were either higher or lower in the resistant group compared to the sensitive group. The significant ligand-receptor pairs in the resistant group and sensitive group were also displayed by dot plots.
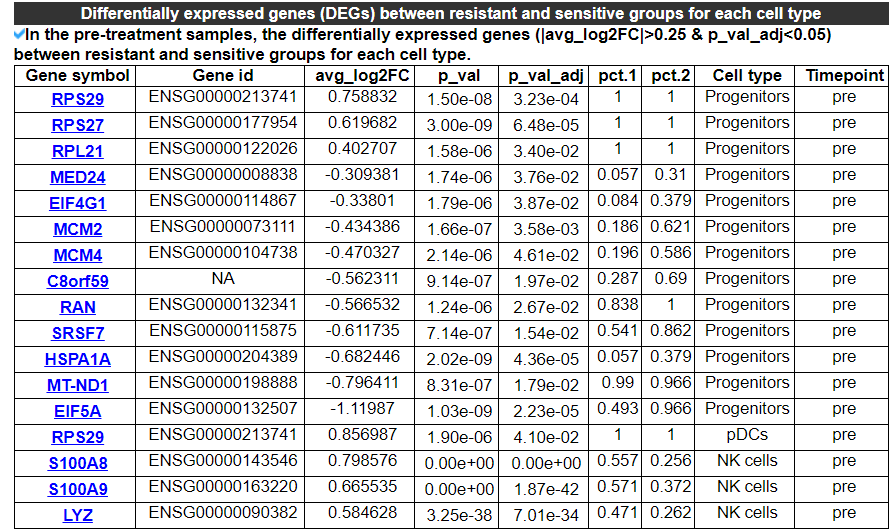
We performed differential gene expression analysis between the resistant and sensitive groups for each cell type using the FindMarkers function in the Seurat package. The pre- and post-treatment samples were analyzed separately. Drug resistance-related differentially expressed genes (DEGs) between the resistant and sensitive groups with p_val_adj<0.05 and |avg_log2FC|>0.25 were shown in the database.
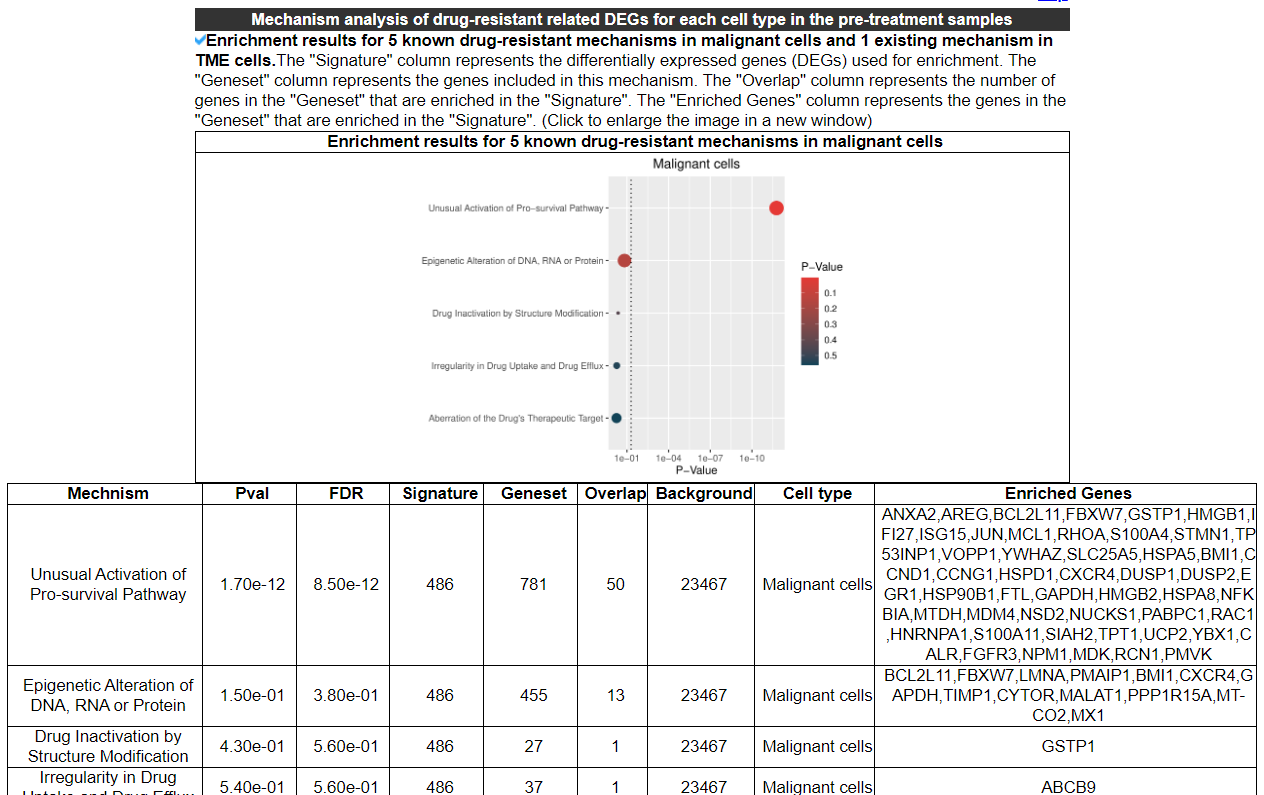
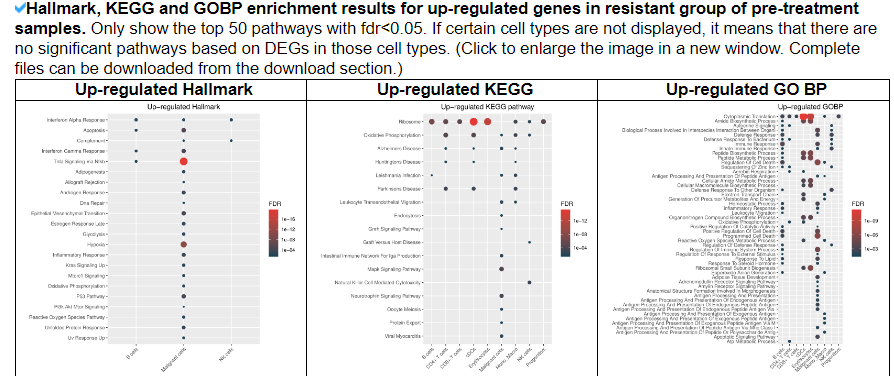
To explore the potential resistance mechanisms of resistance-related DEGs, we performed enrichment analysis of 6 known drug resistance mechanisms, Hallmark, KEGG and GO BP pathways using hypeR 1.14.0 package for up-regulated genes and down-regulated genes in each cell type, respectively. The pre- and post-treatment samples were analyzed separately. The geneset of 6 known drug resistance mechanisms was downloaded form DRESIS database.
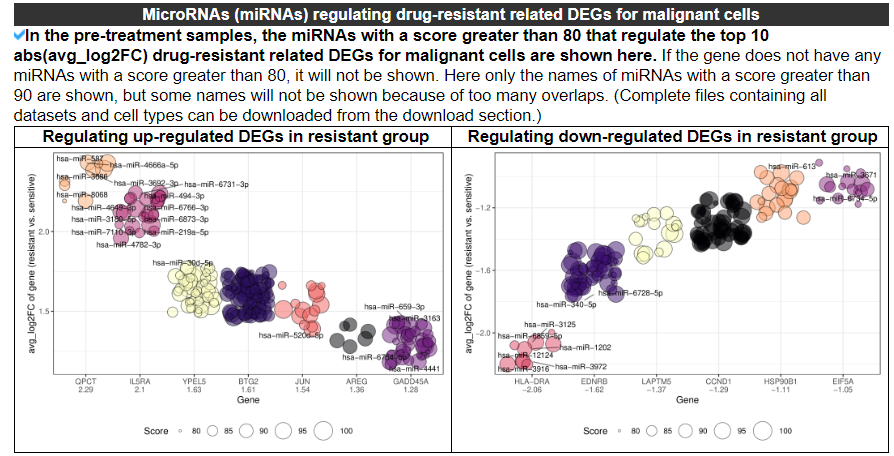
We used data from the miRDB database to predict miRNAs with a score greater than 80 that regulate drug resistance-related genes. The miRNAs that regulate the top10 up-regulated and down-regulated drug resistance-related DEGs for malignant cells are shown by bubble plots.
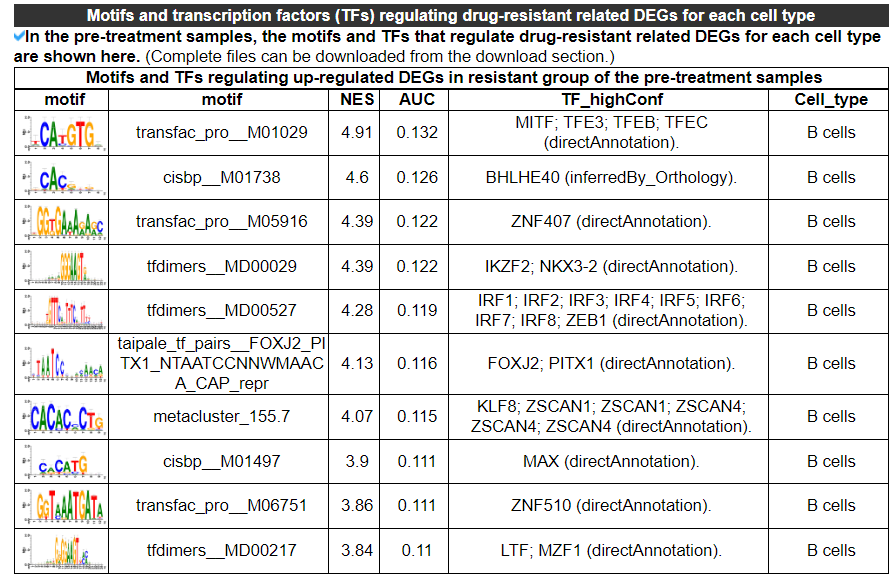
Motif/TF enrichment analysis was performed using RcisTarget 1.18.2 package based on the DEGs in each cell type. In a first step, RcisTarget selects DNA motifs that are significantly over-represented in the surroundings of the transcription start site (TSS) of the genes in the gene-set. This is achieved by using a database that contains genome-wide cross-species rankings for each motif. The motifs that are then annotated to TFs and those that have a high Normalized Enrichment Score (NES) are retained. Those motifs that pass the given threshold NES>3.0 are considered significant. Finally, for each motif and gene-set, RcisTarget predicts the candidate target genes (i.e. genes in the gene-set that are ranked above the leading edge).
- Input query: Gene symbol or Ensembl gene ID.
- Input query: Drug name.
Select your gene from the gene list.
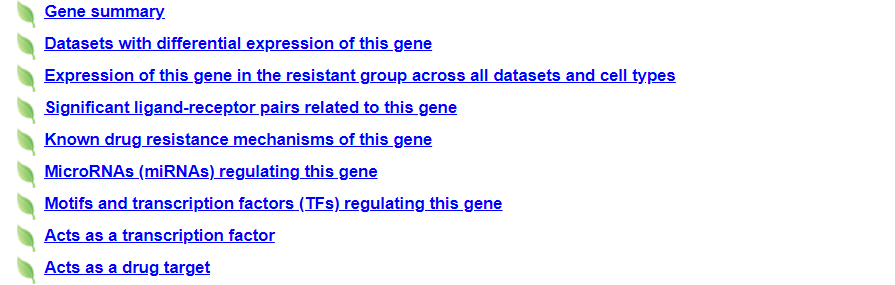
These are DRMref's annotation categories for your query with links to their corresponding annotation parts.
2.3.1 Gene summary
This category shows the information of the drug resistance-related gene. It shows the overall information of this gene, including basic information such as symbol, name, and Entrez ID.
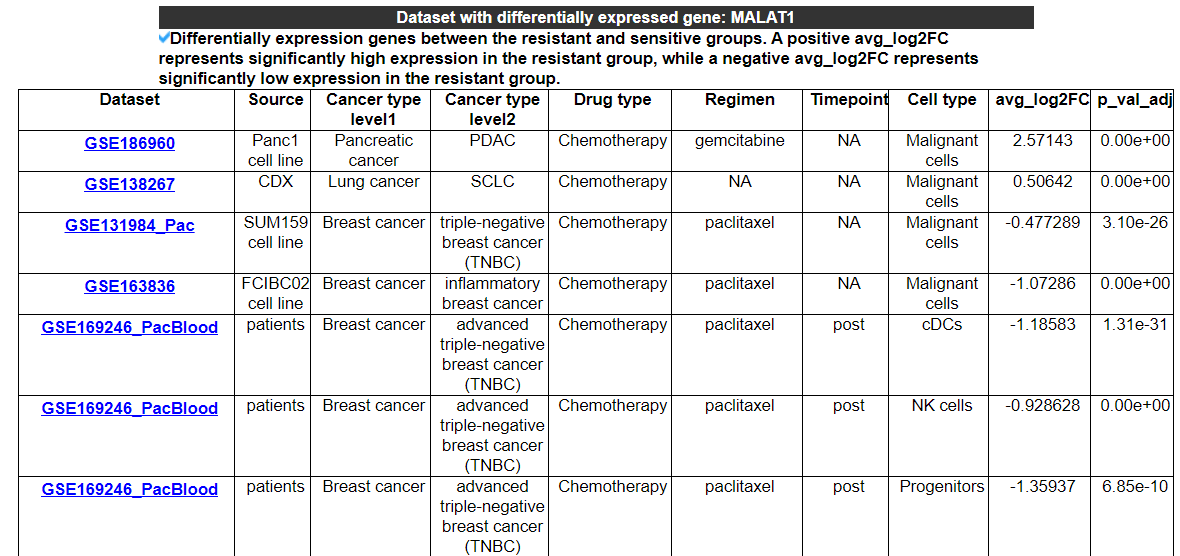
2.3.2 Datasets with differential expression of this gene
This category displays the datasets with differential expression of this gene and shows the expression status in the resistant group.
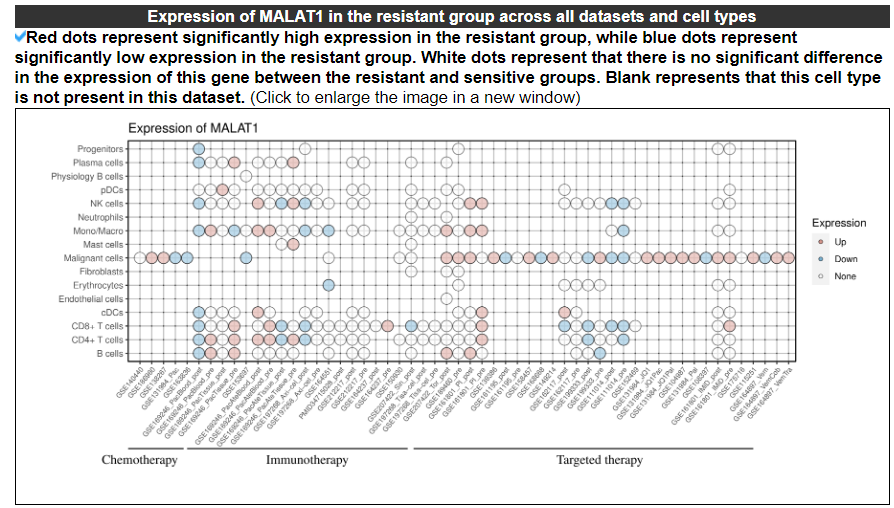
2.3.3 Expression of this gene across all datasets and cell types
The dotplot displays the expression of this gene across all datasets and cell types.
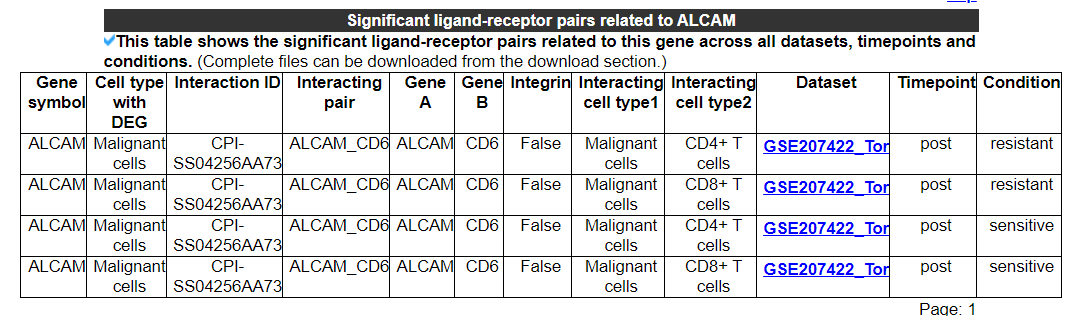
2.3.4 Significant ligand-receptor pairs related to this gene
This category displays the significant ligand-receptor pairs related to this gene across all datasets, timepoints, and conditions. No result indicates that this gene is not associated with any significant ligand-receptor pairs. The second picture shows the results of another gene.

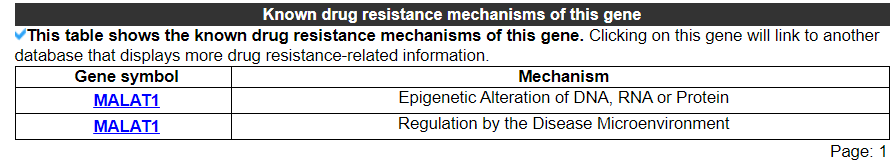
2.3.5 Known drug resistance mechanisms of this gene
The category displays the known drug resistance mechanisms of this gene. No result indicates that this gene has not been found related to these mechanisms.
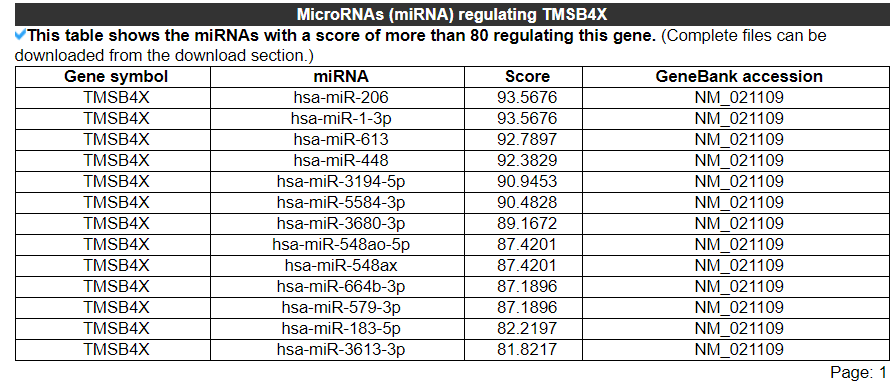
2.3.6 MicroRNAs (miRNAs) regulating this gene
The category displays the miRNAs with a score of more than 80 regulating this gene. No result indicates that this gene does not have any miRNAs with a score of more than 80. The second picture shows the results of another gene.

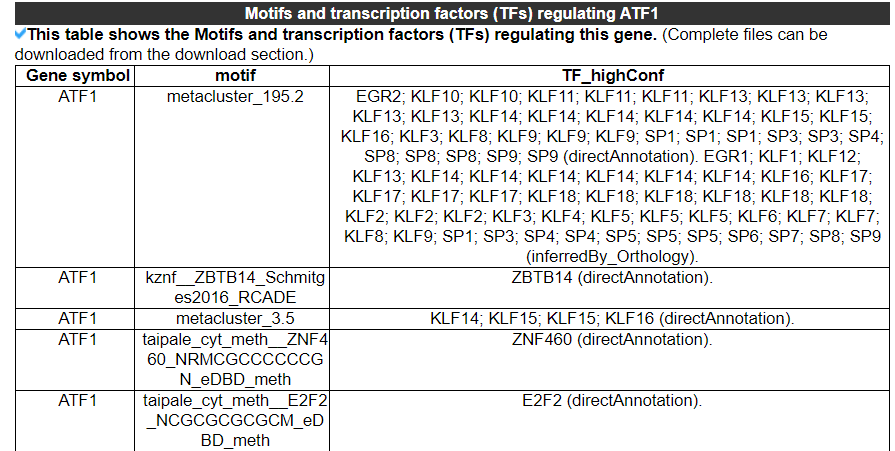
2.3.7 Motifs and transcription factors (TFs) regulating this gene
The category displays the Motifs and transcription factors (TFs) regulating this gene. No result indicates that there is no enrichment of motifs and transcription factors regulating this gene. The second picture shows the results of another gene.

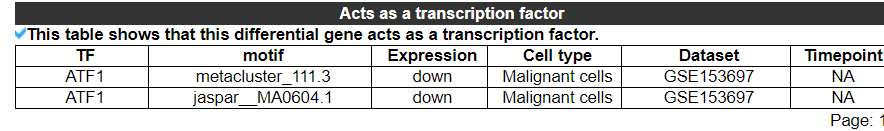
2.3.8 Acts as a transcription factor
The category displays that this differential gene acts as a transcription factor. No result indicates that this gene is not classified as a transcription factor. The second picture shows the results of another gene.

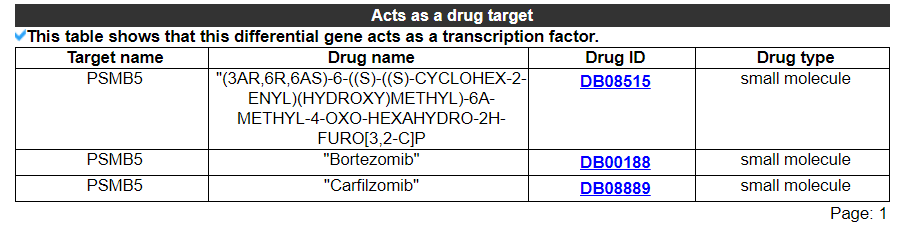
2.3.9 Acts as a drug target
The category displays that this differential gene acts as a drug target. No result indicates that this gene is not a drug target. The second picture shows the results of another gene.

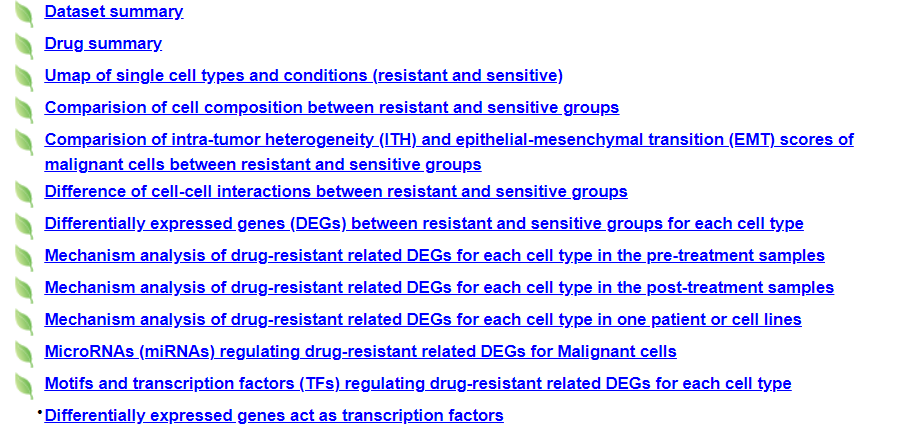
These are the analysis categories of DRMref for your query, with links to their corresponding analysis sections.
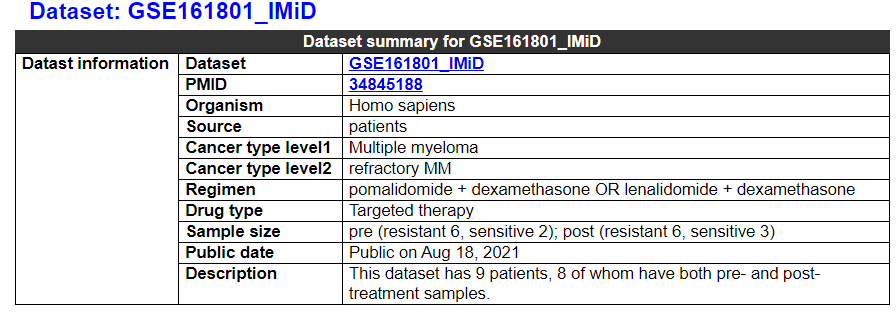
2.4.1 Dataset summary
This category deplays the information of the dataset. It shows the overall information of this dataset, such as cancer type, regimen, drug type, treatment timepoint, and sample size.
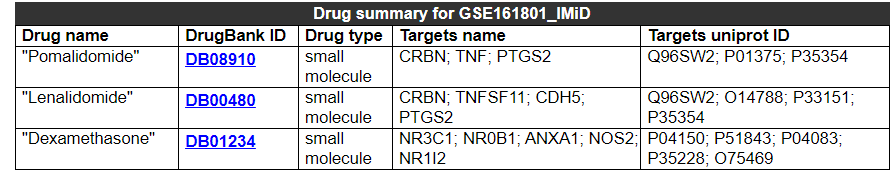
2.4.2 Drug summary
This category displays the information of drugs involved in this dataset.
2.4.3 Umap of single cell types and conditions
The Umap displays the information about cell types and conditions (resistant and sensitive).
2.4.4 Comparison of cell composition
The barplot displays the difference in cell composition between the resistant and sensitive groups in the pre-treatment or post-treatment samples. No result indicates that at least one group (resistant or sensitive) does not have more than 3 samples for a specific treatment timepoint.
2.4.5 Comparison of ITH and EMT scores
The violin plot displays the differences in intra-tumoral heterogeneity (ITH) and epithelial-mesenchymal transition (EMT) between the resistant and sensitive groups in the pre-treatment or post-treatment samples, or for a single patient or cell line. If the dataset is from a single patient or cell line, the resistant sample represents the post-treatment sample, and the sensitive sample represents the pre-treatment sample.
2.4.6 Difference of cell-cell interactions
The heatmap displays the differences in cell-cell interactions between the resistant and sensitive groups in the pre-treatment or post-treatment samples. The numbers indicate the count of cell-cell interactions that were either higher or lower in the resistant group compared to the sensitive group. The dot plots deplay the significant ligand-receptor pairs in the resistant group and resistant group. No result indicates that this dataset only has one cell type.
2.4.7 Differentially expressed genes
This category provides the differentially expressed genes between the resistant and sensitive groups for each cell type in the pre-treatment or post-treatment samples, or for a single patient or cell line.
2.4.8 Mechanism analysis
This category displays the enrichment results for 5 known drug resistance mechanisms in malignant cells, as well as 1 known mechanism in TME cells. It also shows the enrichment results for Hallmark, KEGG, and GOBP pathways for up-regulated and down-regulated DEGs in the resistant group, respectively.
2.4.9 MicroRNAs regulating DEGs
The bubble plots display the miRNAs with a score greater than 80 that regulate the top10 abs(avg_log2FC) drug resistance-related DEGs for Malignant cells. No reuslt indicates that the top10 abs(avg_log2FC) DEGs of this dataset do not have any miRNAs with a score greater than 80.
2.4.10 Motifs and TFs regulating DEGs
This category provides the motifs and transcription factors that regulate drug resistance-related DEGs for each cell type. No result indicates that there is no enrichment of motifs and transcription factors for the drug resistance-related DEGs in this dataset.
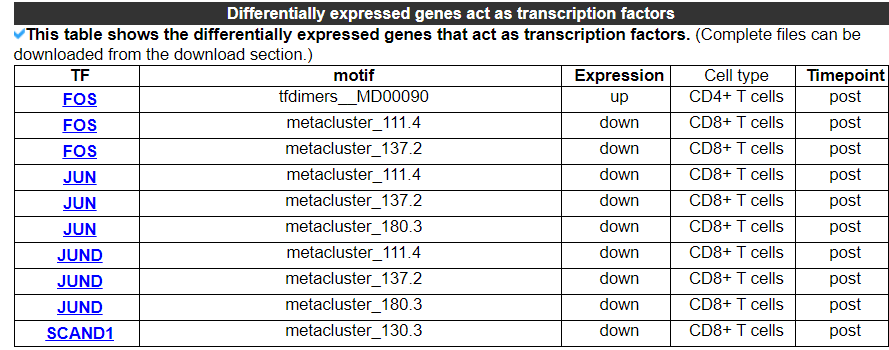
2.4.11 DEGs act as transcription factors
This category displays the differentially expressed genes that act as transcription factors in this dataset.
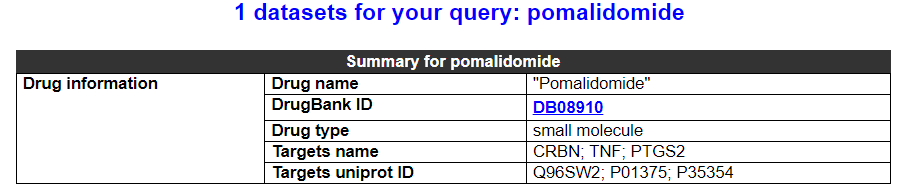
2.5.1 Drug summary
This category shows the information of this drug.
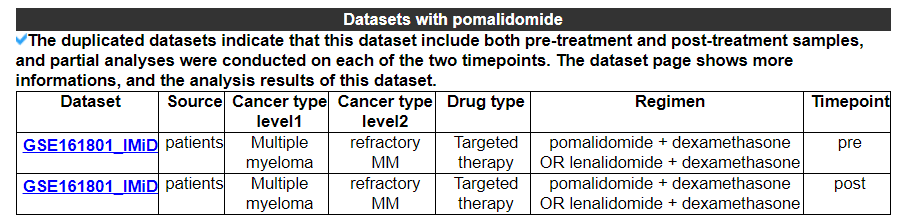
2.5.2 Datasets for this drug
Select your dataset from the dataset list, and then navigate to the dataset analysis results page.
Please go to download page and contact page.

Copyright 2022-Present -The University of Texas Health Science Center at Houston