
|
||||||
|
 | |
| |
| Expression of this gene in the resistant group across all datasets and cell types |
| Significant ligand-receptor pairs related to this gene (This gene does not contain this module) |
| Known drug resistance mechanisms of this gene (This gene does not contain this module) |
| |
| |
| Acts as a transcription factor (This gene does not contain this module) |
| Acts as a drug target< (This gene does not contain this module) |
Gene: PACS1 |
Summary for PACS1 |
| Gene information | Gene symbol | PACS1 | Ensembl ID | ENSG00000175115 |
| Entrez ID | 55690 | |
| Gene name | phosphofurin acidic cluster sorting protein 1 | |
| Synonyms | FLJ10209|KIAA1175 | |
| Gene type | protein_coding | |
| UniProtAcc | Q6VY07 |
Top |
Dataset with differentially expressed gene: PACS1 |
 Differentially expression genes between the resistant and sensitive groups. A positive avg_log2FC represents significantly high expression in the resistant group, while a negative avg_log2FC represents significantly low expression in the resistant group. Differentially expression genes between the resistant and sensitive groups. A positive avg_log2FC represents significantly high expression in the resistant group, while a negative avg_log2FC represents significantly low expression in the resistant group. |
| Dataset | Source | Tissue | Cancer type level1 | Cancer type level2 | Drug type | Regimen | Timepoint | Cell type | avg_log2FC | p_val_adj |
GSE139386 | H3122 cell line | Cell line | Lung cancer | EML4-ALK fusion-positive non-small cell lung cancer (NSCLC) | Targeted therapy | ceritinib | NA | Malignant cells | -0.42854 | 0.00e+00 |
GSE131984_JQ1Pal | SUM159 cell line | Cell line | Breast cancer | Triple-negative breast cancer (TNBC) | Targeted therapy | JQ1 + palbociclib | NA | Malignant cells | 0.268341 | 3.07e-18 |
GSE108397 | 451Lu cell line | Cell line | Melanoma | Melanoma | Targeted therapy | PLX-4720 | NA | Malignant cells | -0.300137 | 0.00e+00 |
Top |
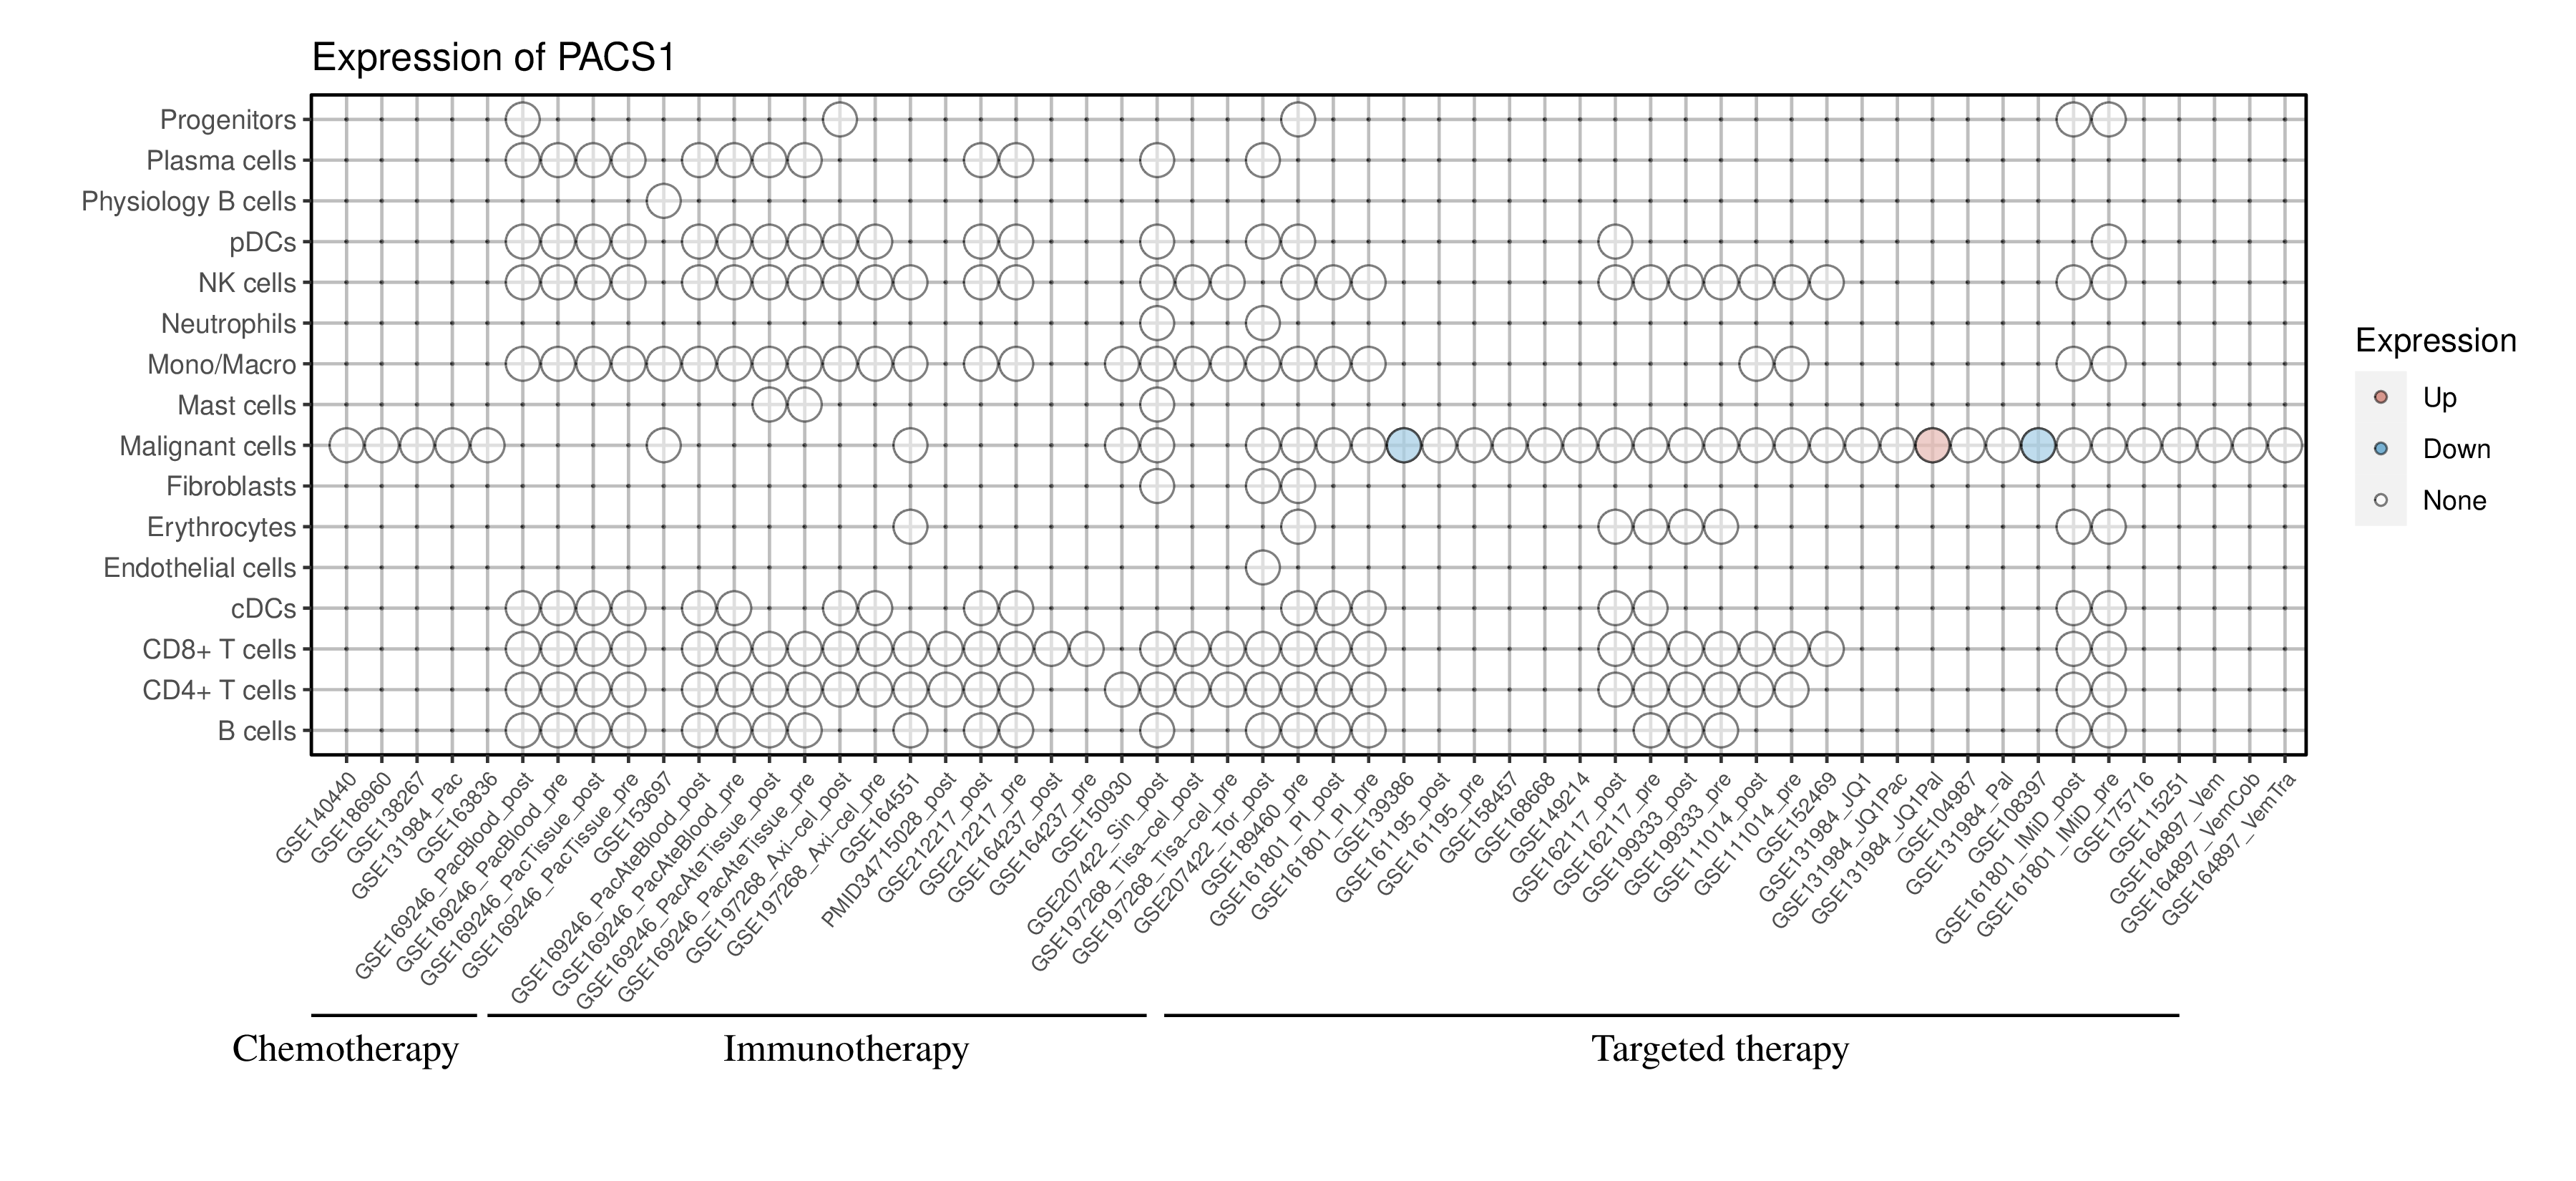
Expression of PACS1 in the resistant group across all datasets and cell types |
| Red dots represent significantly high expression in the resistant group, while blue dots represent significantly low expression in the resistant group. White dots represent that there is no significant difference in the expression of this gene between the resistant and sensitive groups. Blank represents that this cell type is not present in this dataset. (If the image exists, the user can click on it to enlarge it in a new window.) |
 |
Top |
Significant ligand-receptor pairs related to PACS1 |
| This table shows the significant ligand-receptor pairs related to this gene across all datasets, timepoints and conditions. (Complete files can be downloaded from the download section.) |
Top |
Known drug resistance mechanisms of this gene |
| This table shows the known drug resistance mechanisms of this gene. Clicking on this gene will link to another database that displays more drug resistance-related information. |
Top |
MicroRNAs (miRNA) regulating PACS1 |
| This table shows the miRNAs with a score of more than 80 regulating this gene. (Complete files can be downloaded from the download section.) |
| Gene symbol | miRNA | Score | GeneBank accession |
| PACS1 | hsa-miR-4492 | 99.6267 | NM_018026 |
| PACS1 | hsa-miR-6797-5p | 99.3094 | NM_018026 |
| PACS1 | hsa-miR-4505 | 99.1151 | NM_018026 |
| PACS1 | hsa-miR-4498 | 99.0202 | NM_018026 |
| PACS1 | hsa-miR-5787 | 98.932 | NM_018026 |
| PACS1 | hsa-miR-1249-5p | 98.8593 | NM_018026 |
| PACS1 | hsa-miR-762 | 98.7893 | NM_018026 |
| PACS1 | hsa-miR-5001-5p | 98.659 | NM_018026 |
| PACS1 | hsa-miR-5196-5p | 98.6376 | NM_018026 |
| PACS1 | hsa-miR-4747-5p | 98.1255 | NM_018026 |
| PACS1 | hsa-miR-449a | 97.6564 | NM_018026 |
| PACS1 | hsa-miR-34a-5p | 97.6564 | NM_018026 |
| PACS1 | hsa-miR-4728-5p | 97.6234 | NM_018026 |
| PACS1 | hsa-miR-6785-5p | 97.5495 | NM_018026 |
| PACS1 | hsa-miR-4779 | 96.6032 | NM_018026 |
| PACS1 | hsa-miR-6127 | 95.8289 | NM_018026 |
| PACS1 | hsa-miR-449b-5p | 95.7665 | NM_018026 |
| PACS1 | hsa-miR-34c-5p | 95.7665 | NM_018026 |
| PACS1 | hsa-miR-149-3p | 95.6844 | NM_018026 |
| PACS1 | hsa-miR-6883-5p | 95.6844 | NM_018026 |
| PACS1 | hsa-miR-6133 | 94.0477 | NM_018026 |
| PACS1 | hsa-miR-6130 | 94.0477 | NM_018026 |
| PACS1 | hsa-miR-6129 | 94.0477 | NM_018026 |
| PACS1 | hsa-miR-4510 | 94.0477 | NM_018026 |
| PACS1 | hsa-miR-6799-5p | 91.6064 | NM_018026 |
| PACS1 | hsa-miR-3184-5p | 91.498 | NM_018026 |
| PACS1 | hsa-miR-4731-5p | 89.7518 | NM_018026 |
| PACS1 | hsa-miR-1910-3p | 89.5035 | NM_018026 |
| PACS1 | hsa-miR-5006-5p | 89.1882 | NM_018026 |
| PACS1 | hsa-miR-597-5p | 89.0268 | NM_018026 |
| PACS1 | hsa-miR-6511a-5p | 88.2001 | NM_018026 |
| PACS1 | hsa-miR-5698 | 88.0229 | NM_018026 |
| PACS1 | hsa-miR-4723-5p | 88.0229 | NM_018026 |
| PACS1 | hsa-miR-7111-5p | 88.0229 | NM_018026 |
| PACS1 | hsa-miR-6870-5p | 88.0229 | NM_018026 |
| PACS1 | hsa-miR-3135b | 87.3743 | NM_018026 |
| PACS1 | hsa-miR-1827 | 86.3163 | NM_018026 |
| PACS1 | hsa-miR-7106-5p | 86.0921 | NM_018026 |
| PACS1 | hsa-miR-4710 | 85.7133 | NM_018026 |
| PACS1 | hsa-miR-6780a-5p | 85.1441 | NM_018026 |
| PACS1 | hsa-miR-423-5p | 84.763 | NM_018026 |
| PACS1 | hsa-miR-6779-5p | 84.3437 | NM_018026 |
| PACS1 | hsa-miR-30b-3p | 84.3437 | NM_018026 |
| PACS1 | hsa-miR-1273h-5p | 84.3437 | NM_018026 |
| PACS1 | hsa-miR-3689c | 84.3437 | NM_018026 |
| PACS1 | hsa-miR-3689a-3p | 84.3437 | NM_018026 |
| PACS1 | hsa-miR-3689b-3p | 84.3437 | NM_018026 |
| PACS1 | hsa-miR-6889-3p | 83.7138 | NM_018026 |
| PACS1 | hsa-miR-6737-3p | 82.2958 | NM_018026 |
| PACS1 | hsa-miR-7157-3p | 82.2958 | NM_018026 |
| Page: 1 2 |
Top |
Motifs and transcription factors (TFs) regulating PACS1 |
| This table shows the Motifs and transcription factors (TFs) regulating this gene. (Complete files can be downloaded from the download section.) |
| Gene symbol | motif | TF_highConf |
| PACS1 | metacluster_7.13 | ZFX (directAnnotation). |
| PACS1 | cisbp__M01863 | ZNF711 (inferredBy_Orthology). |
| PACS1 | metacluster_151.2 | ZNF23 (directAnnotation). |
| PACS1 | metacluster_170.2 | KLF1; KLF10; KLF10; KLF11; KLF11; KLF11; KLF12; KLF12; KLF14; KLF15; KLF17; KLF2; KLF5; KLF7; KLF7; KLF8; MAZ; MAZ; PATZ1; SP1; SP1; SP1; SP2; SP2; SP2; SP2; SP2; SP2; SP2; SP2; SP4; SP4; SP5; SP6; SP7; SP8; SP9; ZNF281 (directAnnotation). E2F1; E2F4; KLF10; KLF13; KLF14; KLF17; KLF2; KLF7; SP1; SP1; SP3; SP4; SP5; SP6; SP7 (inferredBy_Orthology). |
| PACS1 | transfac_pro__M05479 | ZNF580 (directAnnotation). |
| PACS1 | metacluster_155.23 | BCL11B; ZNF711; ZNF711 (directAnnotation). ZFY (inferredBy_Orthology). |
| PACS1 | kznf__ZNF783_Imbeault2017_OM_MEME | ZNF783 (directAnnotation). |
| PACS1 | transfac_pro__M06071 | ZNF814 (directAnnotation). |
| PACS1 | metacluster_135.10 | MBD2; MBD2; MECP2; MECP2 (directAnnotation). |
| PACS1 | jaspar__MA0079.5 | SP1 (directAnnotation). |
| PACS1 | dbtfbs__E2F8_representative_N1 | E2F8 (directAnnotation). |
| PACS1 | metacluster_15.3 | E2F1; E2F6; E2F8; E2F8; TFDP1 (directAnnotation). E2F3 (inferredBy_Orthology). |
| PACS1 | taipale_cyt_meth__E2F2_GCGCGCGCGYW_eDBD_repr | E2F2 (directAnnotation). |
| PACS1 | jaspar__MA1122.1 | TFDP1 (directAnnotation). |
| PACS1 | metacluster_34.1 | ZNF143; ZNF143; ZNF143; ZNF76; ZNF76; ZNF76 (directAnnotation). |
| PACS1 | kznf__KLF1_Barrera2016.2_PBM | KLF1 (directAnnotation). |
| PACS1 | transfac_pro__M01253 | CNOT3 (directAnnotation). |
| PACS1 | transfac_pro__M04817 | ZBTB33 (directAnnotation). |
| Page: 1 |
Top |
Acts as a transcription factor |
| This table shows that this differential gene acts as a transcription factor. |
Top |
Acts as a drug target |
| This table shows that this differential gene acts as a drug target. |
| 1 | "Sun X, Zhang Y, Li H, Zhou Y, Shi S, Chen Z, He X, Zhang H, Li F, Yin J, Mou M, Wang Y, Qiu Y, Zhu F. DRESIS: the first comprehensive landscape of drug resistance information. Nucleic Acids Res. 2023 Jan 6;51(D1):D1263-D1275. doi: 10.1093/nar/gkac812. PMID: 36243960; PMCID: PMC9825618." |
| 2 | "Wishart DS, Feunang YD, Guo AC, Lo EJ, Marcu A, Grant JR, Sajed T, Johnson D, Li C, Sayeeda Z, Assempour N, Iynkkaran I, Liu Y, Maciejewski A, Gale N, Wilson A, Chin L, Cummings R, Le D, Pon A, Knox C, Wilson M. DrugBank 5.0: a major update to the DrugBank database for 2018. Nucleic Acids Res. 2018 Jan 4;46(D1):D1074-D1082. doi: 10.1093/nar/gkx1037. PMID: 29126136; PMCID: PMC5753335." |

Copyright 2022-Present -The University of Texas Health Science Center at Houston |