
|
||||||
|

Dataset: GSE162117 |
Dataset summary for GSE162117 |
| Datast information | Dataset | GSE162117 |
| PMID | 34514432 | |
| Raw data ID/link | PRJNA680611 | |
| Organism | Homo sapiens | |
| Source | patients | |
| Tissue | Peripheral blood mononuclear cells | |
| Cancer type level1 | Acute myeloid leukemia | |
| Cancer type level2 | Tefractory acute myeloid leukemia (AML) | |
| Regimen | ficlatuzumab | |
| Drug type | Targeted therapy | |
| Sample size | pre (resistant 4, sensitive 7); post (resistant 3, sensitive 6) | |
| Cell number | 43486 | |
| Extract protocol | 10x genomics | |
| Data processing | CellRanger 2.0.1 | |
| Public date | Public on Sep 03, 2021 | |
| Description | This dataset has 11 patients, 9 of whom have both pre- and post-treatment samples. |
Top |
Drug summary for GSE162117 |
| Drug name | DrugBank ID | Drug type | Targets name | Targets uniprot ID |
| "ficlatuzumab" is not included in the drug list. | ||||
Top |
Umap of single cell types and conditions (resistant and sensitive) |
 Umap of cell types and conditions (resistant and sensitive). If this dataset has both pre-treatment and post-treatment samples, the cell types were annotated together. If this dataset is a cell line dataset, the UMAP of cell clusters and the cell ratio of drug-resistant and sensitive groups within each cluster will also be shown. (If the image exists, the user can click on it to enlarge it in a new window.) Umap of cell types and conditions (resistant and sensitive). If this dataset has both pre-treatment and post-treatment samples, the cell types were annotated together. If this dataset is a cell line dataset, the UMAP of cell clusters and the cell ratio of drug-resistant and sensitive groups within each cluster will also be shown. (If the image exists, the user can click on it to enlarge it in a new window.) |
Umap of cell types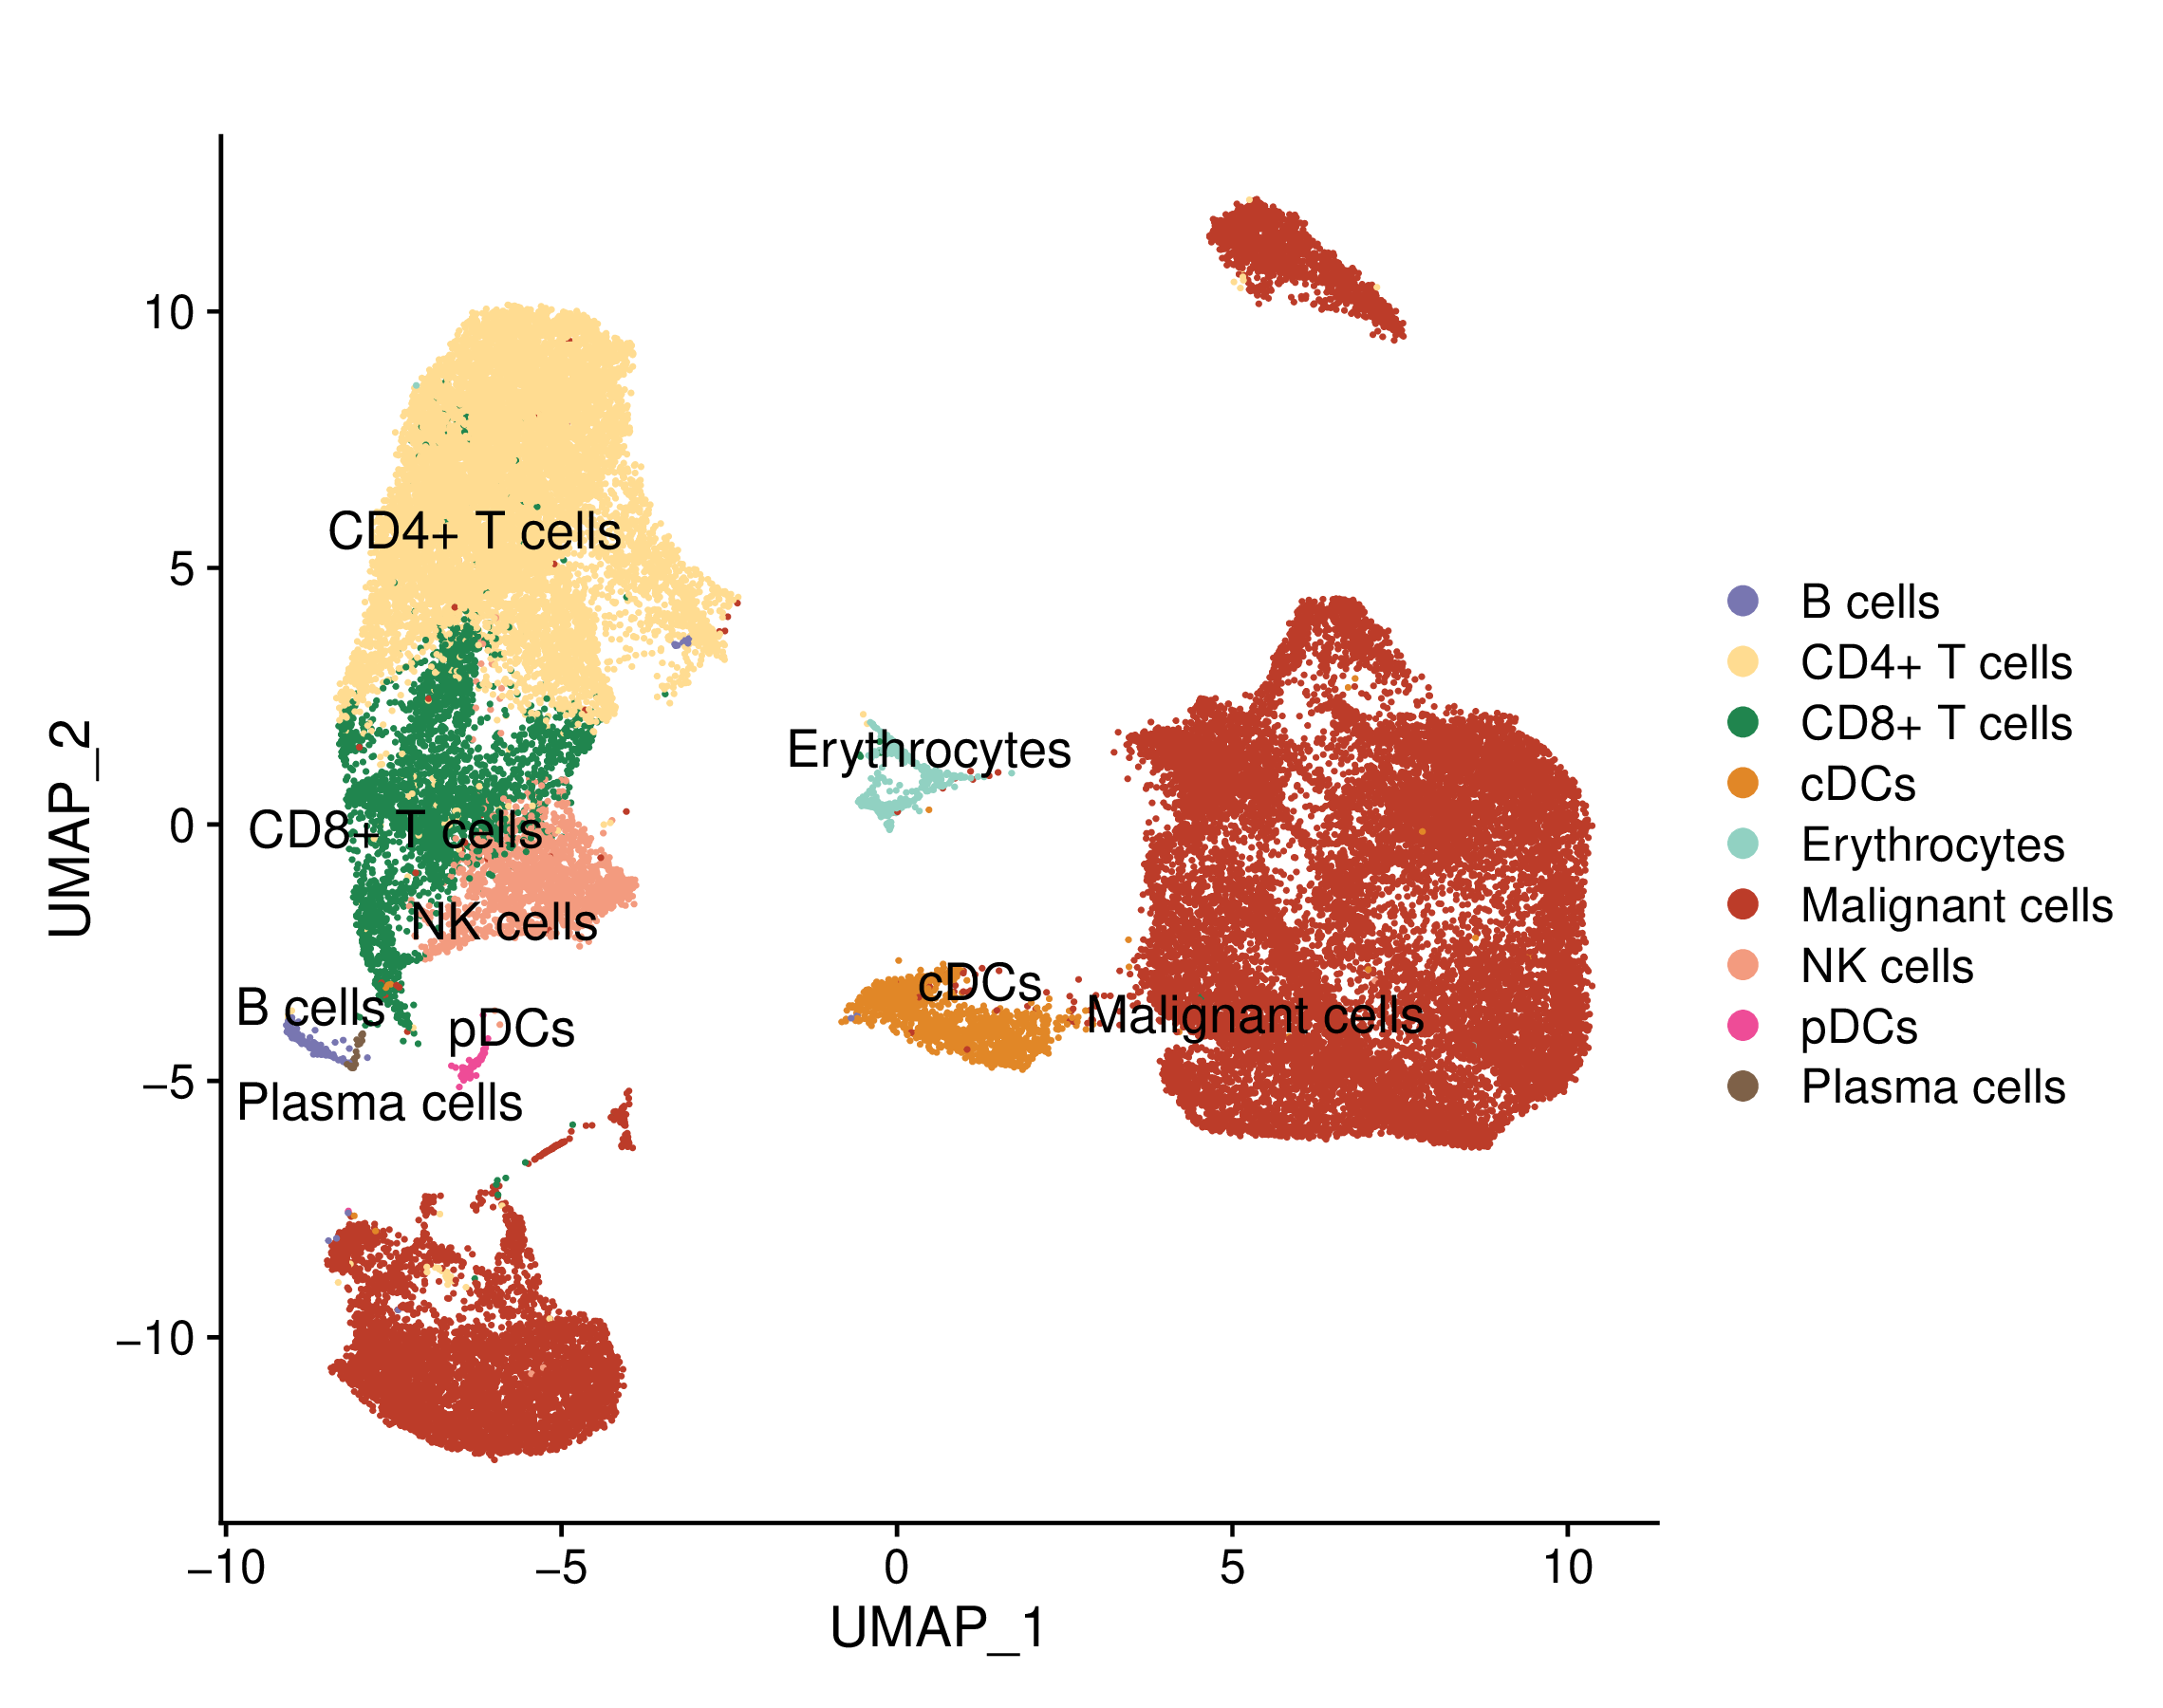 | Umap of conditions |
Top |
Comparison of cell composition between the resistant and sensitive groups |
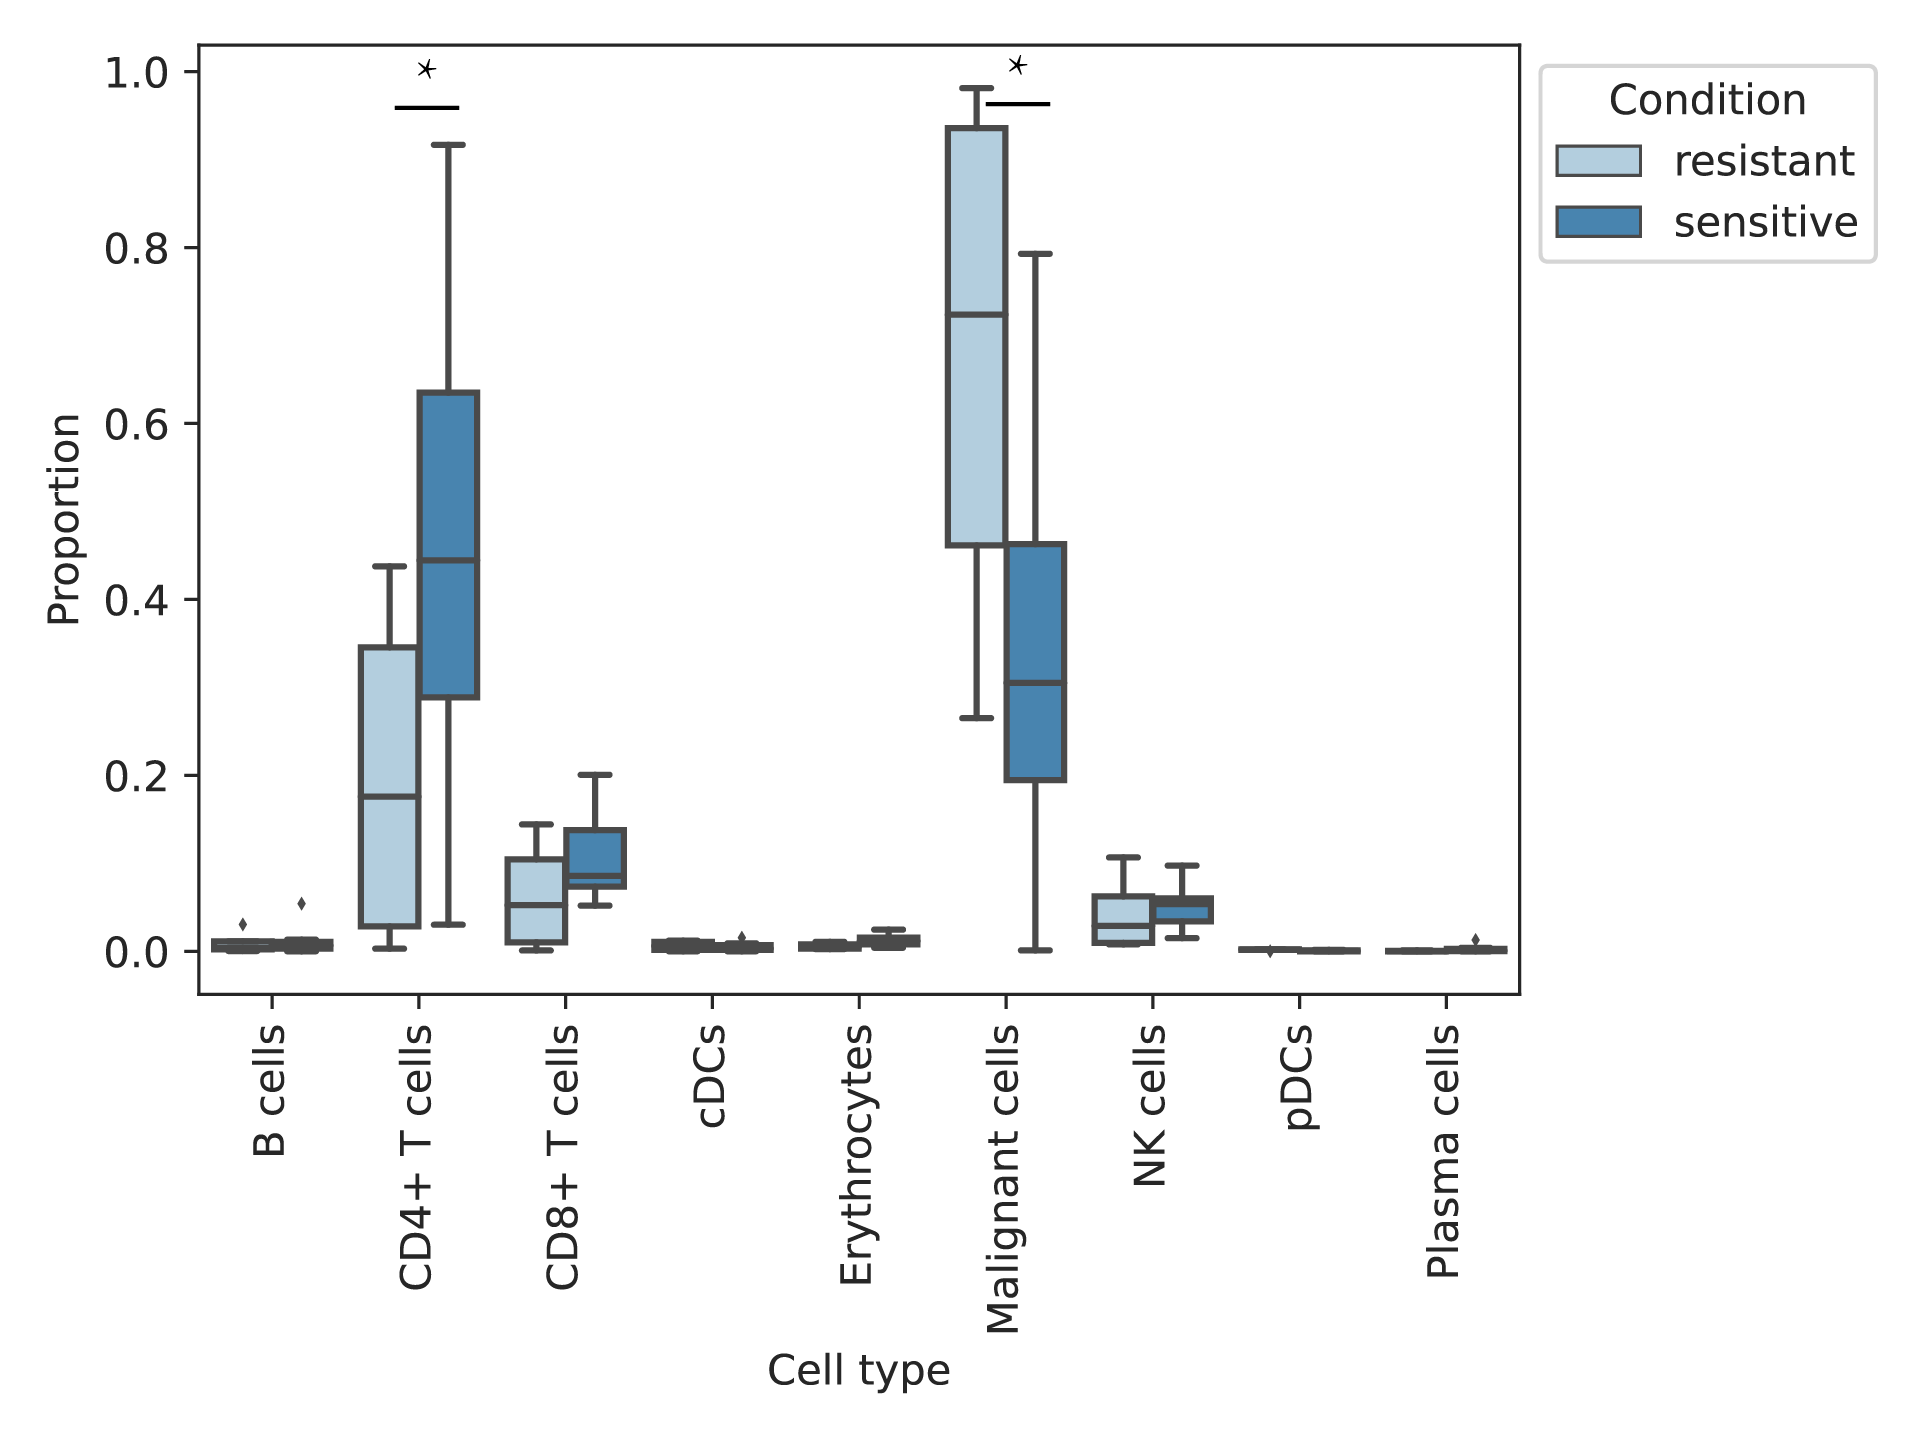
| In the pre-treatment samples, the cell composition of the resistant and sensitive groups were compared. * represents significant difference. (If the image exists, the user can click on it to enlarge it in a new window.) |
 |
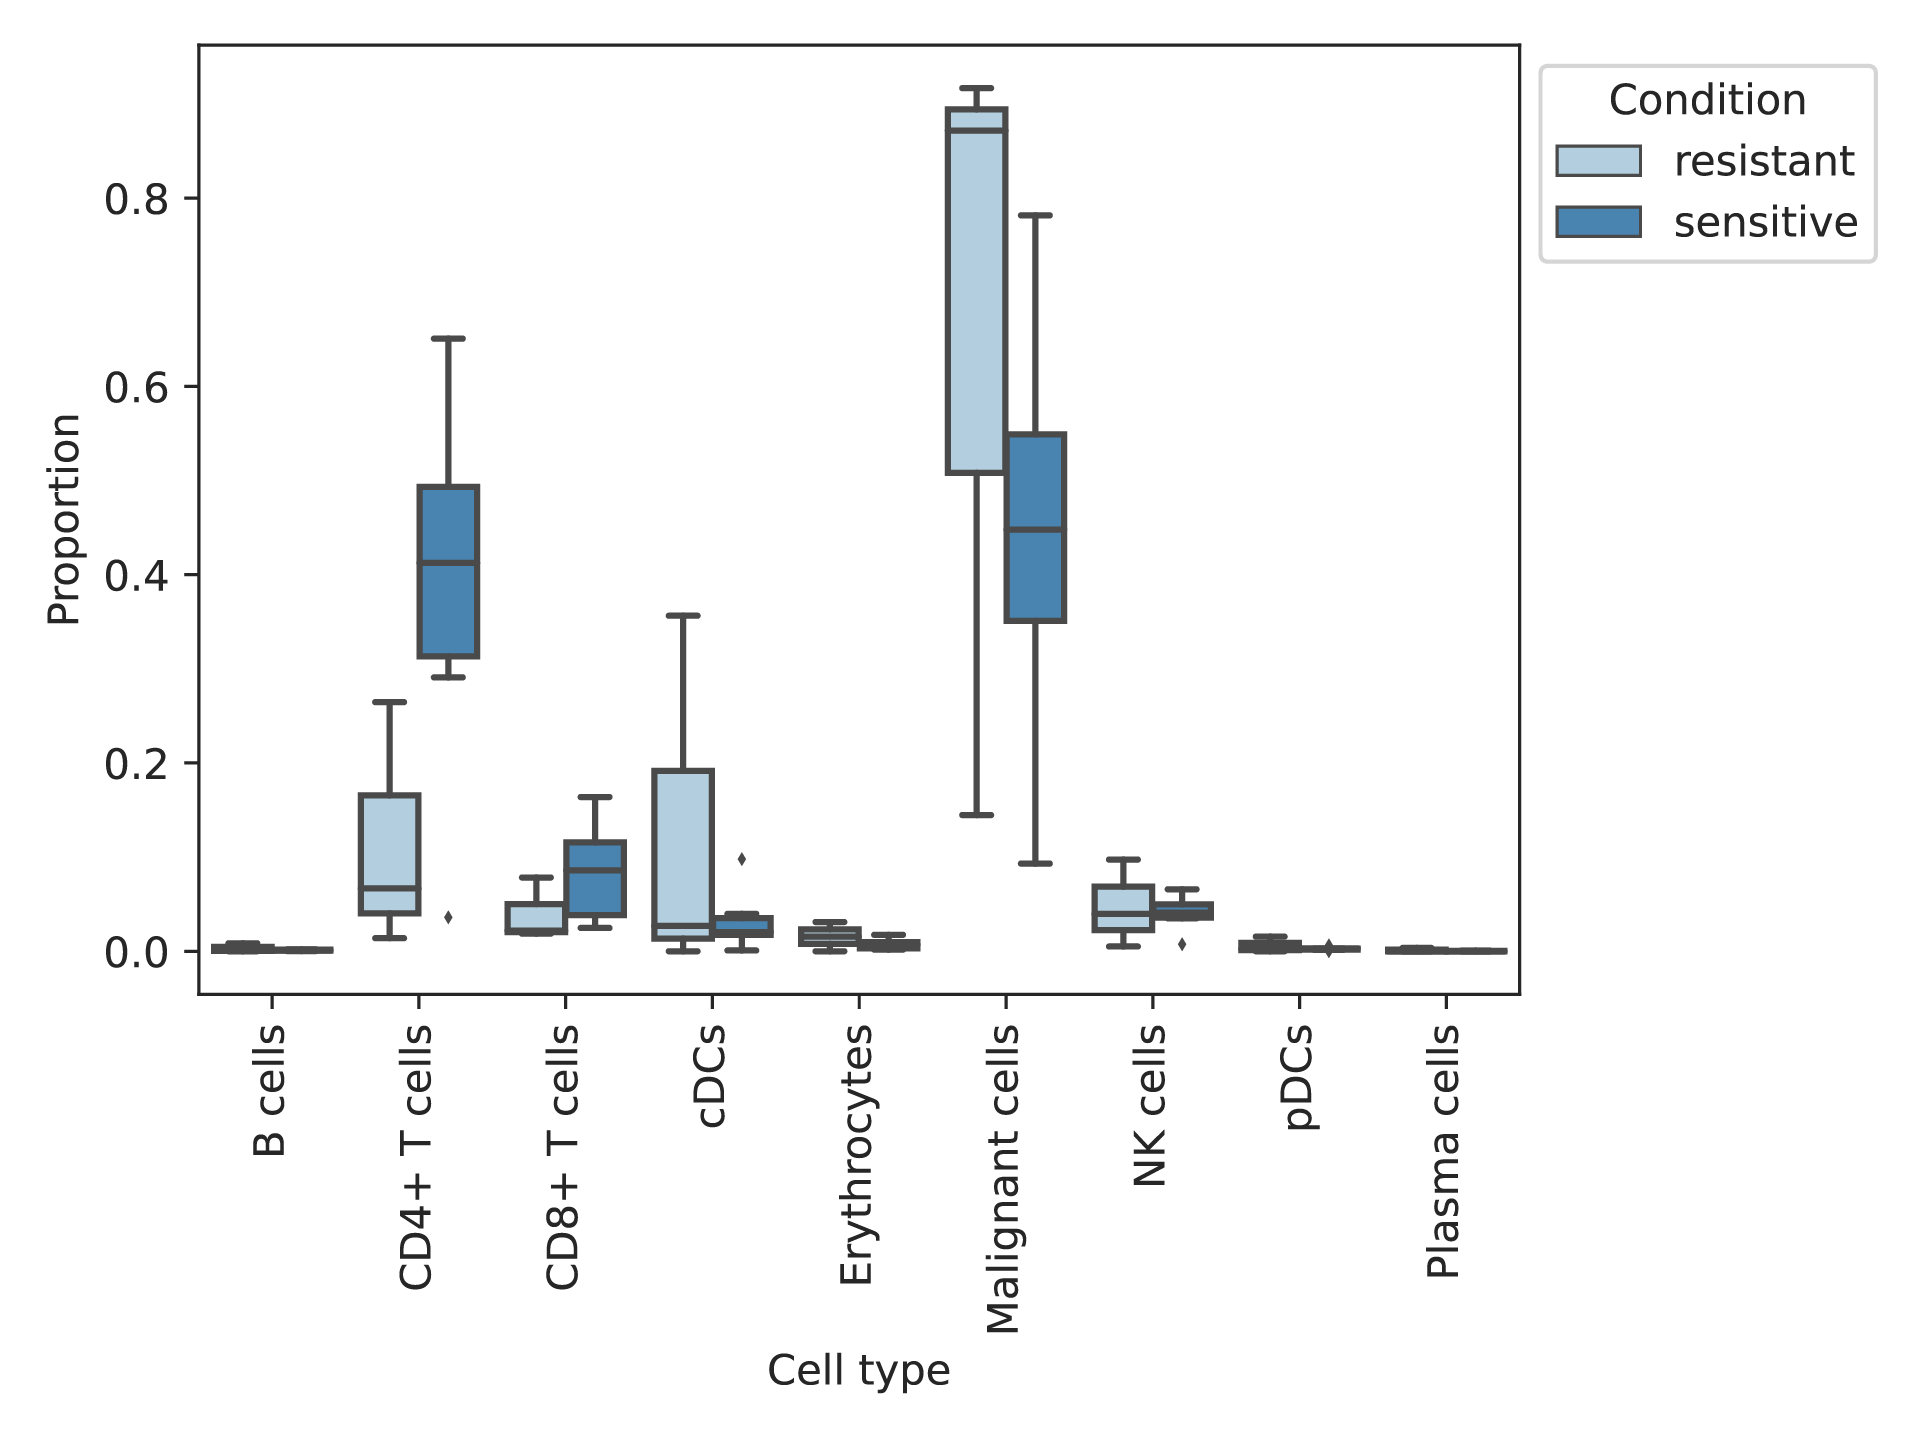
| In the post-treatment samples, the cell composition of the resistant and sensitive groups were compared. * represents significant difference. (If the image exists, the user can click on it to enlarge it in a new window.) |
 |
Top |
Comparison of ITH and EMT scores of malignant cells between the resistant and sensitive groups |
| Comparison of ITH (intra-tumoral heterogeneity) and EMT (epithelial-mesenchymal transition) scores of malignant cells between the resistant and sensitive groups. ITH represents intratumoral heterogeneity, EMT represents epithelial mesenchymal transition, pre represents pre-treatment, post represents post-treatment, post2 represents longer post-treatment. (If the image exists, the user can click on it to enlarge it in a new window.) |
Comparison of ITH scores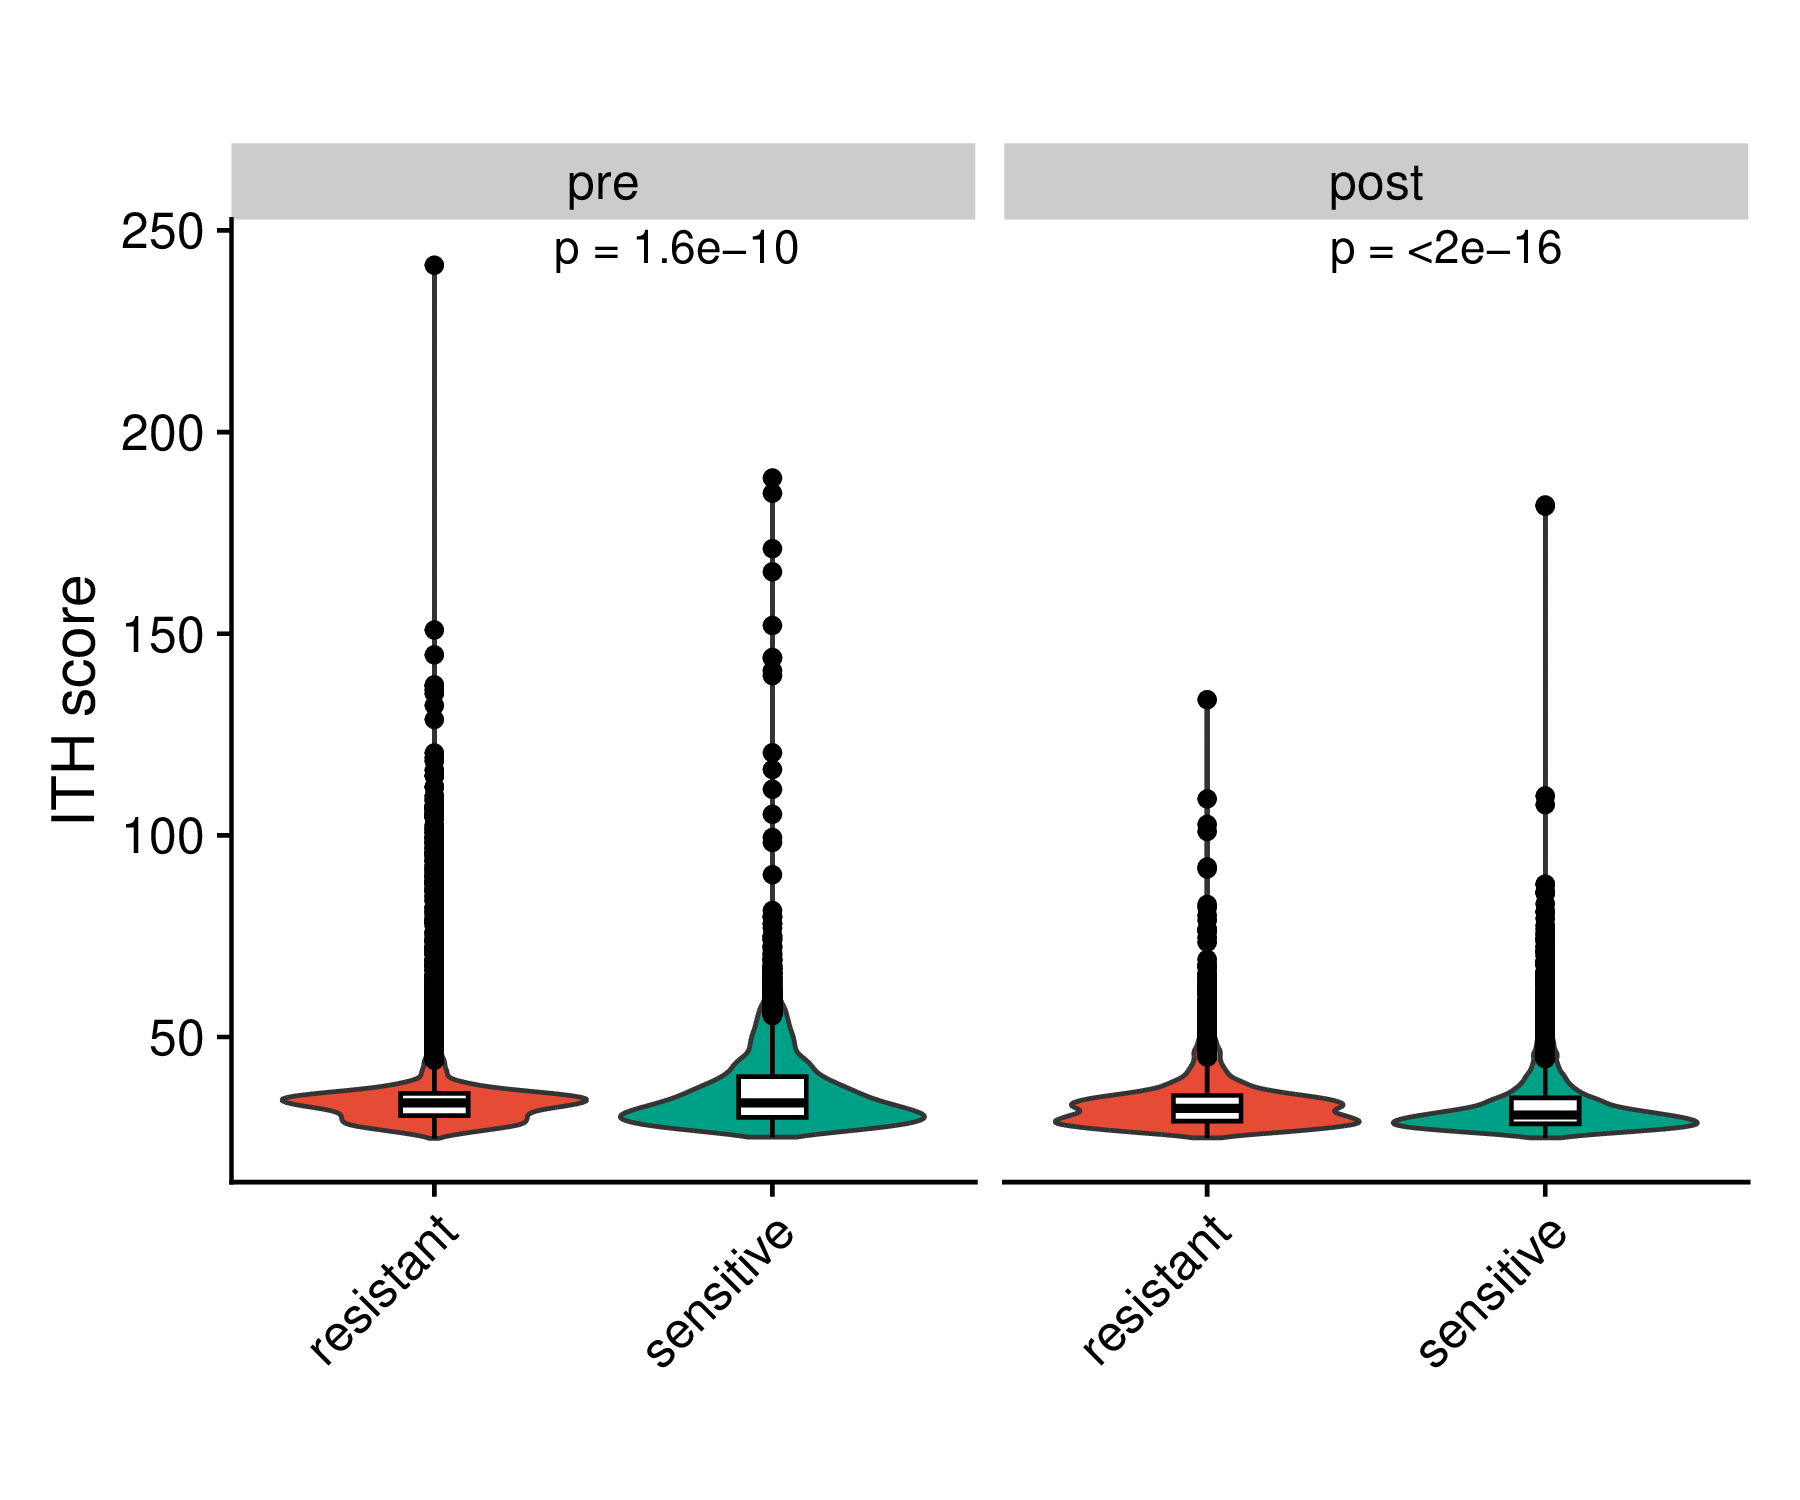 | Comparison of EMT scores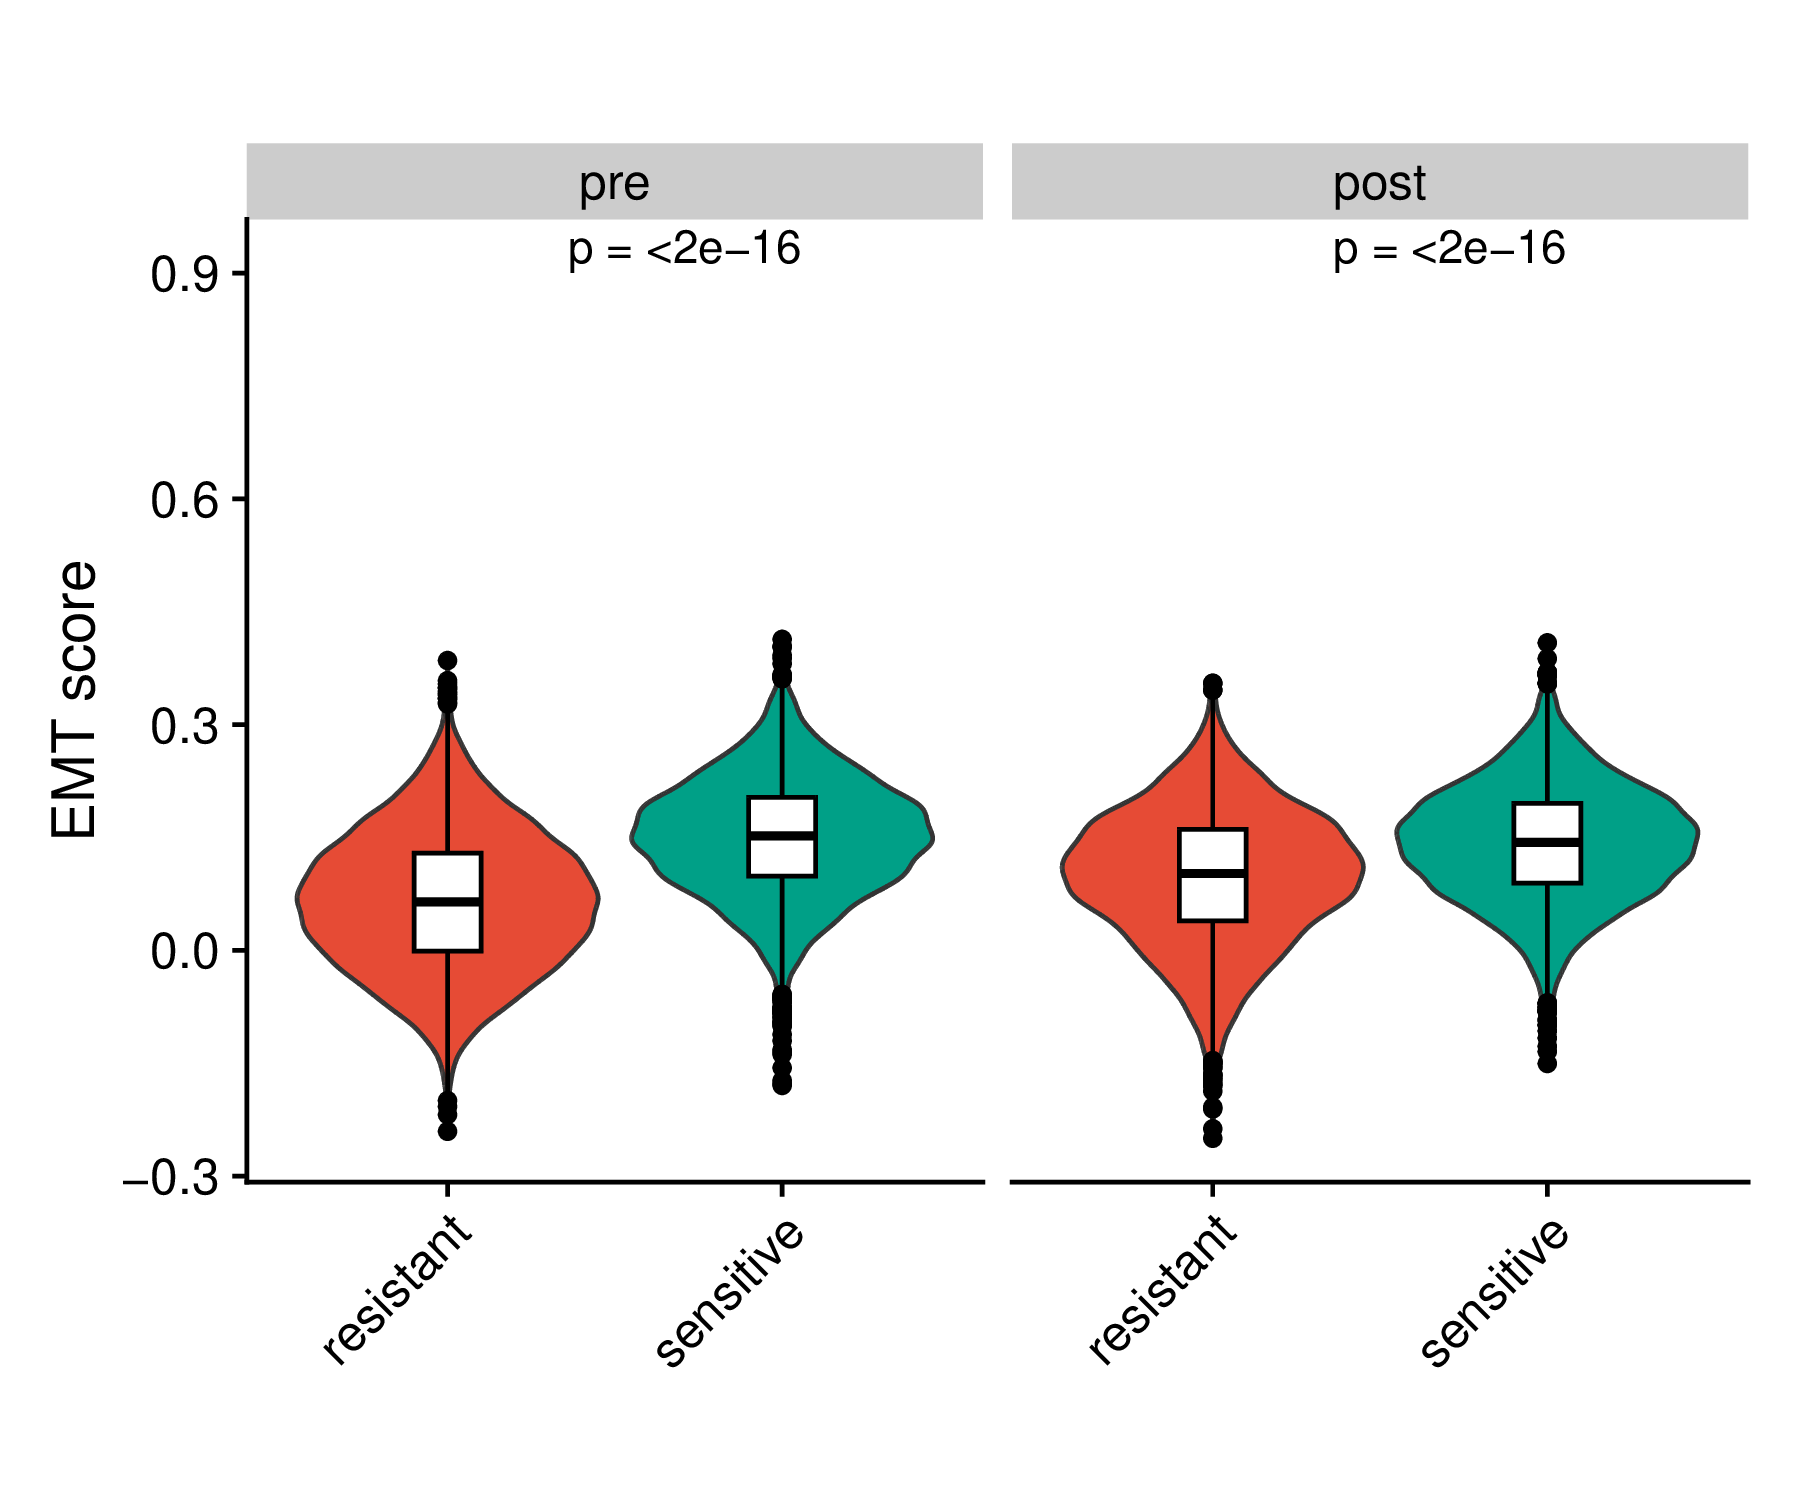 |
Top |
Difference of cell-cell interactions between the resistant and sensitive groups |
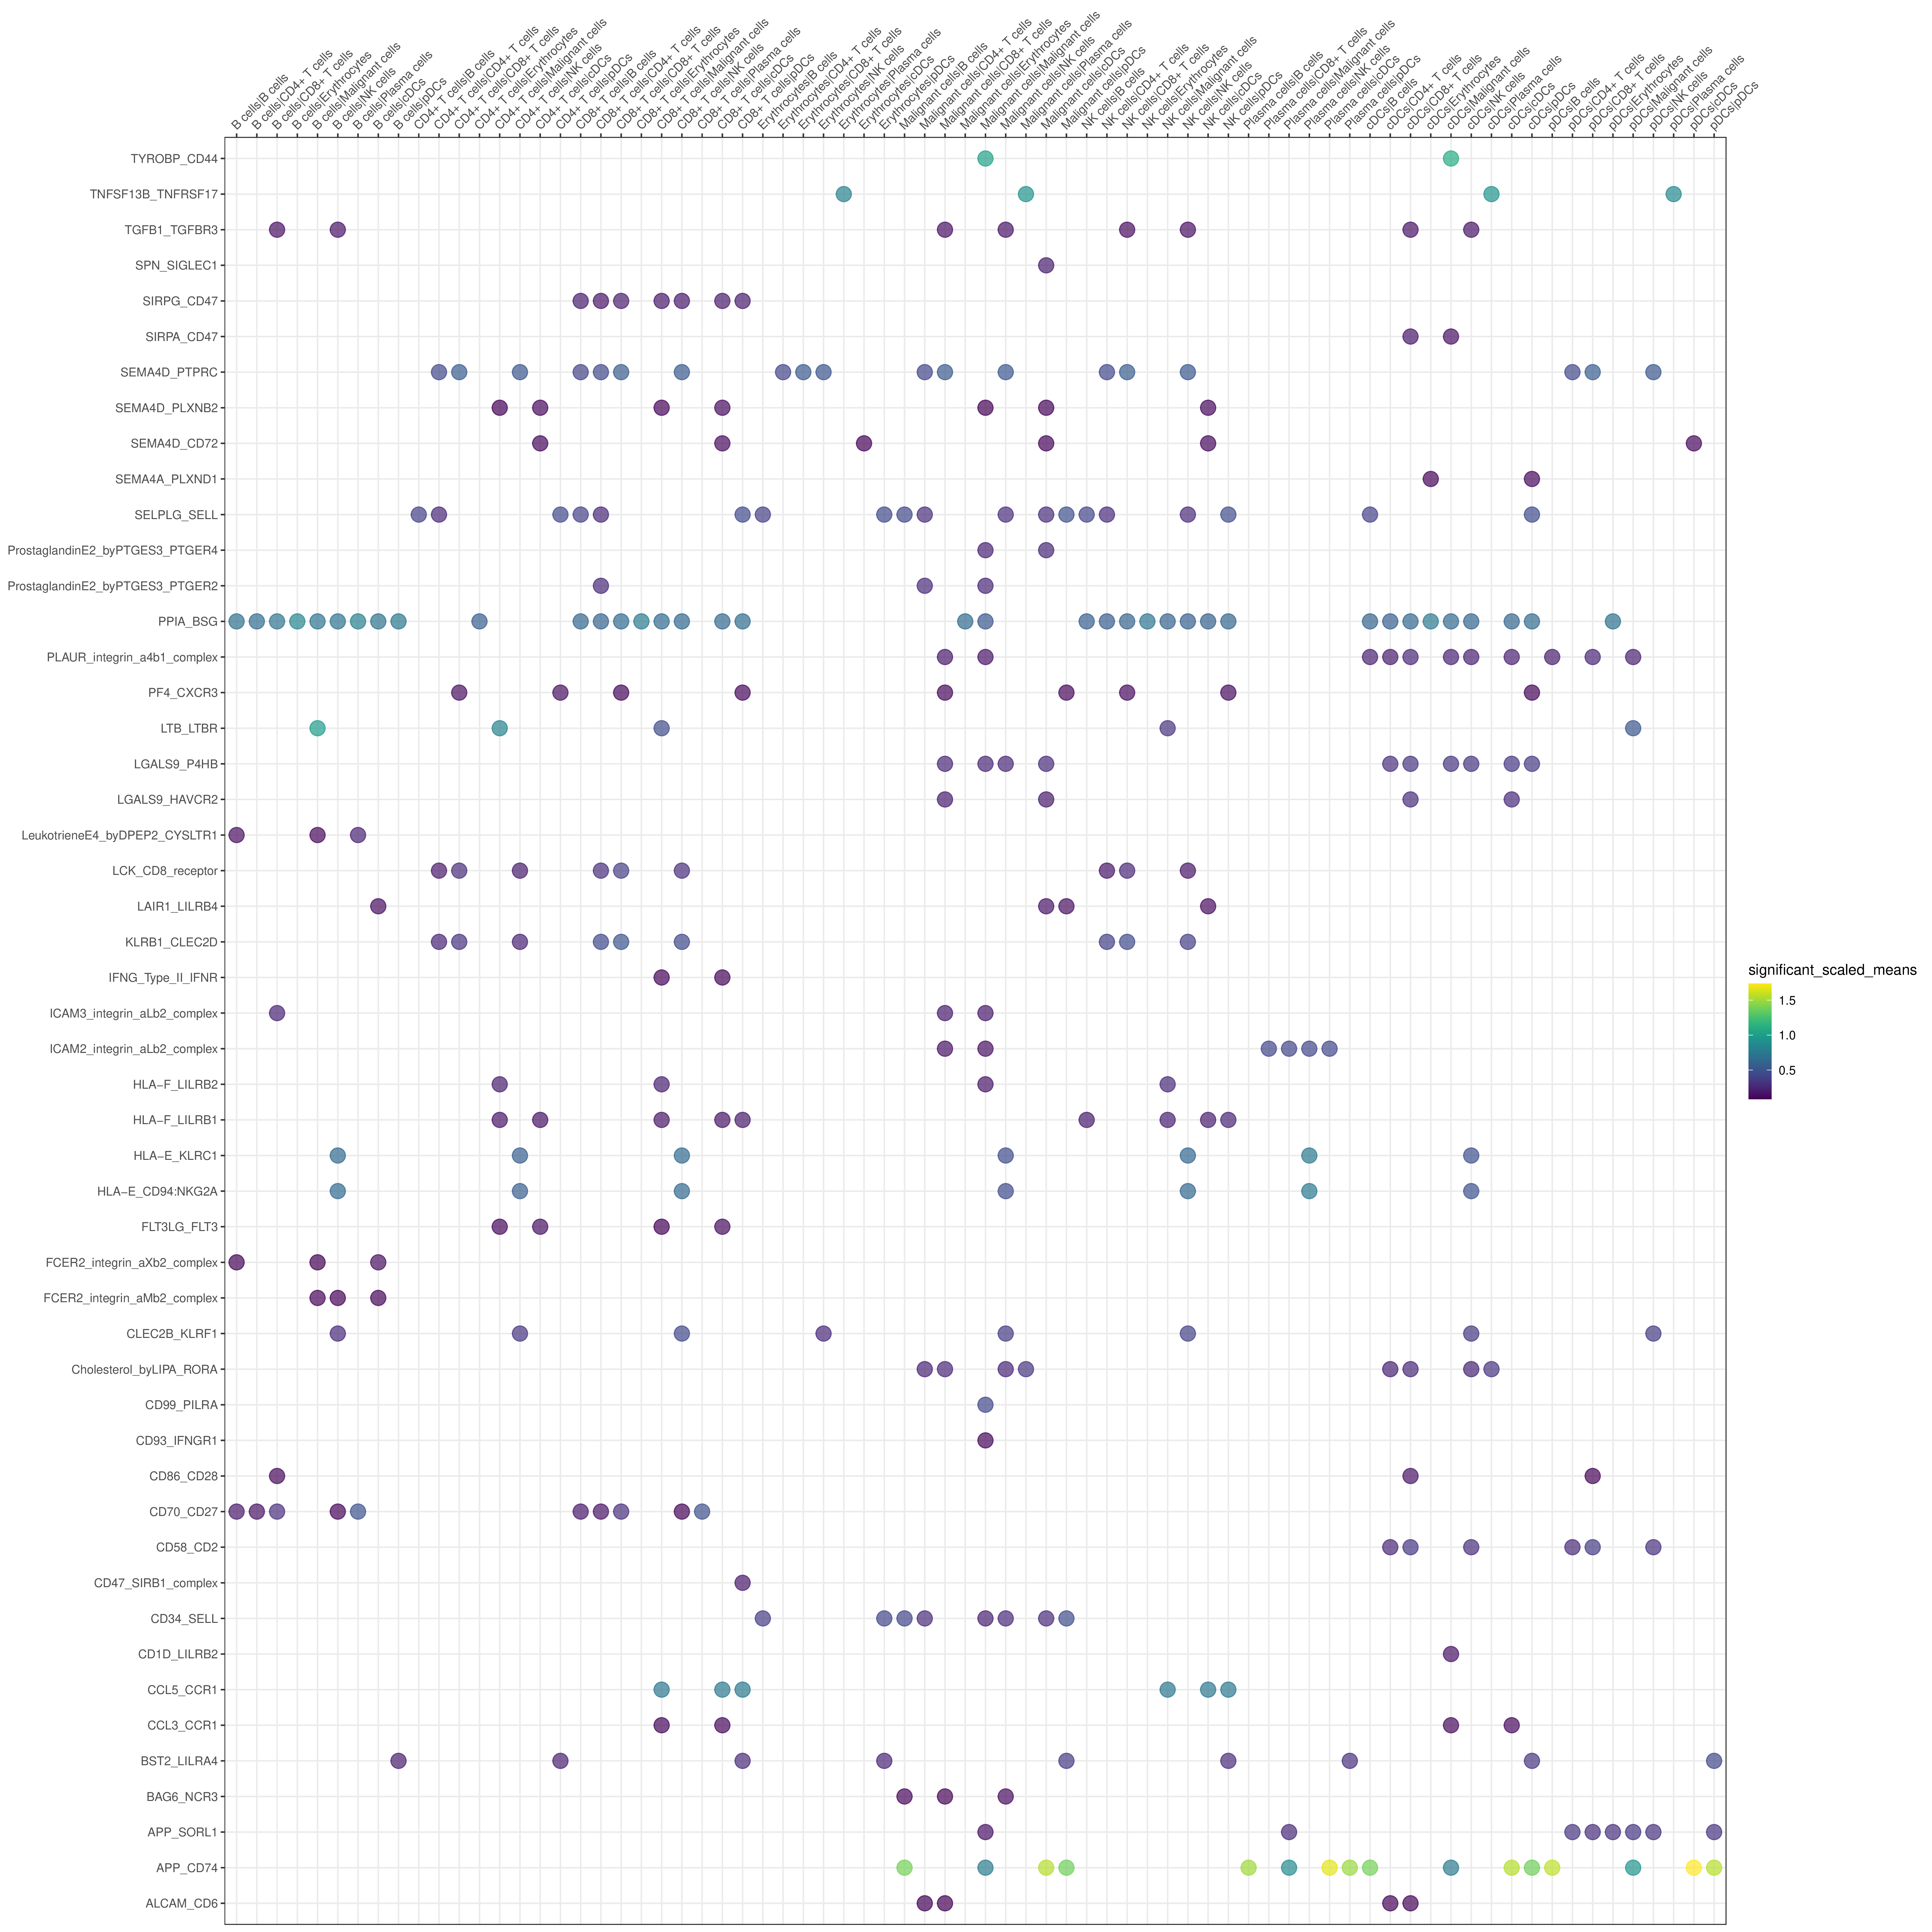
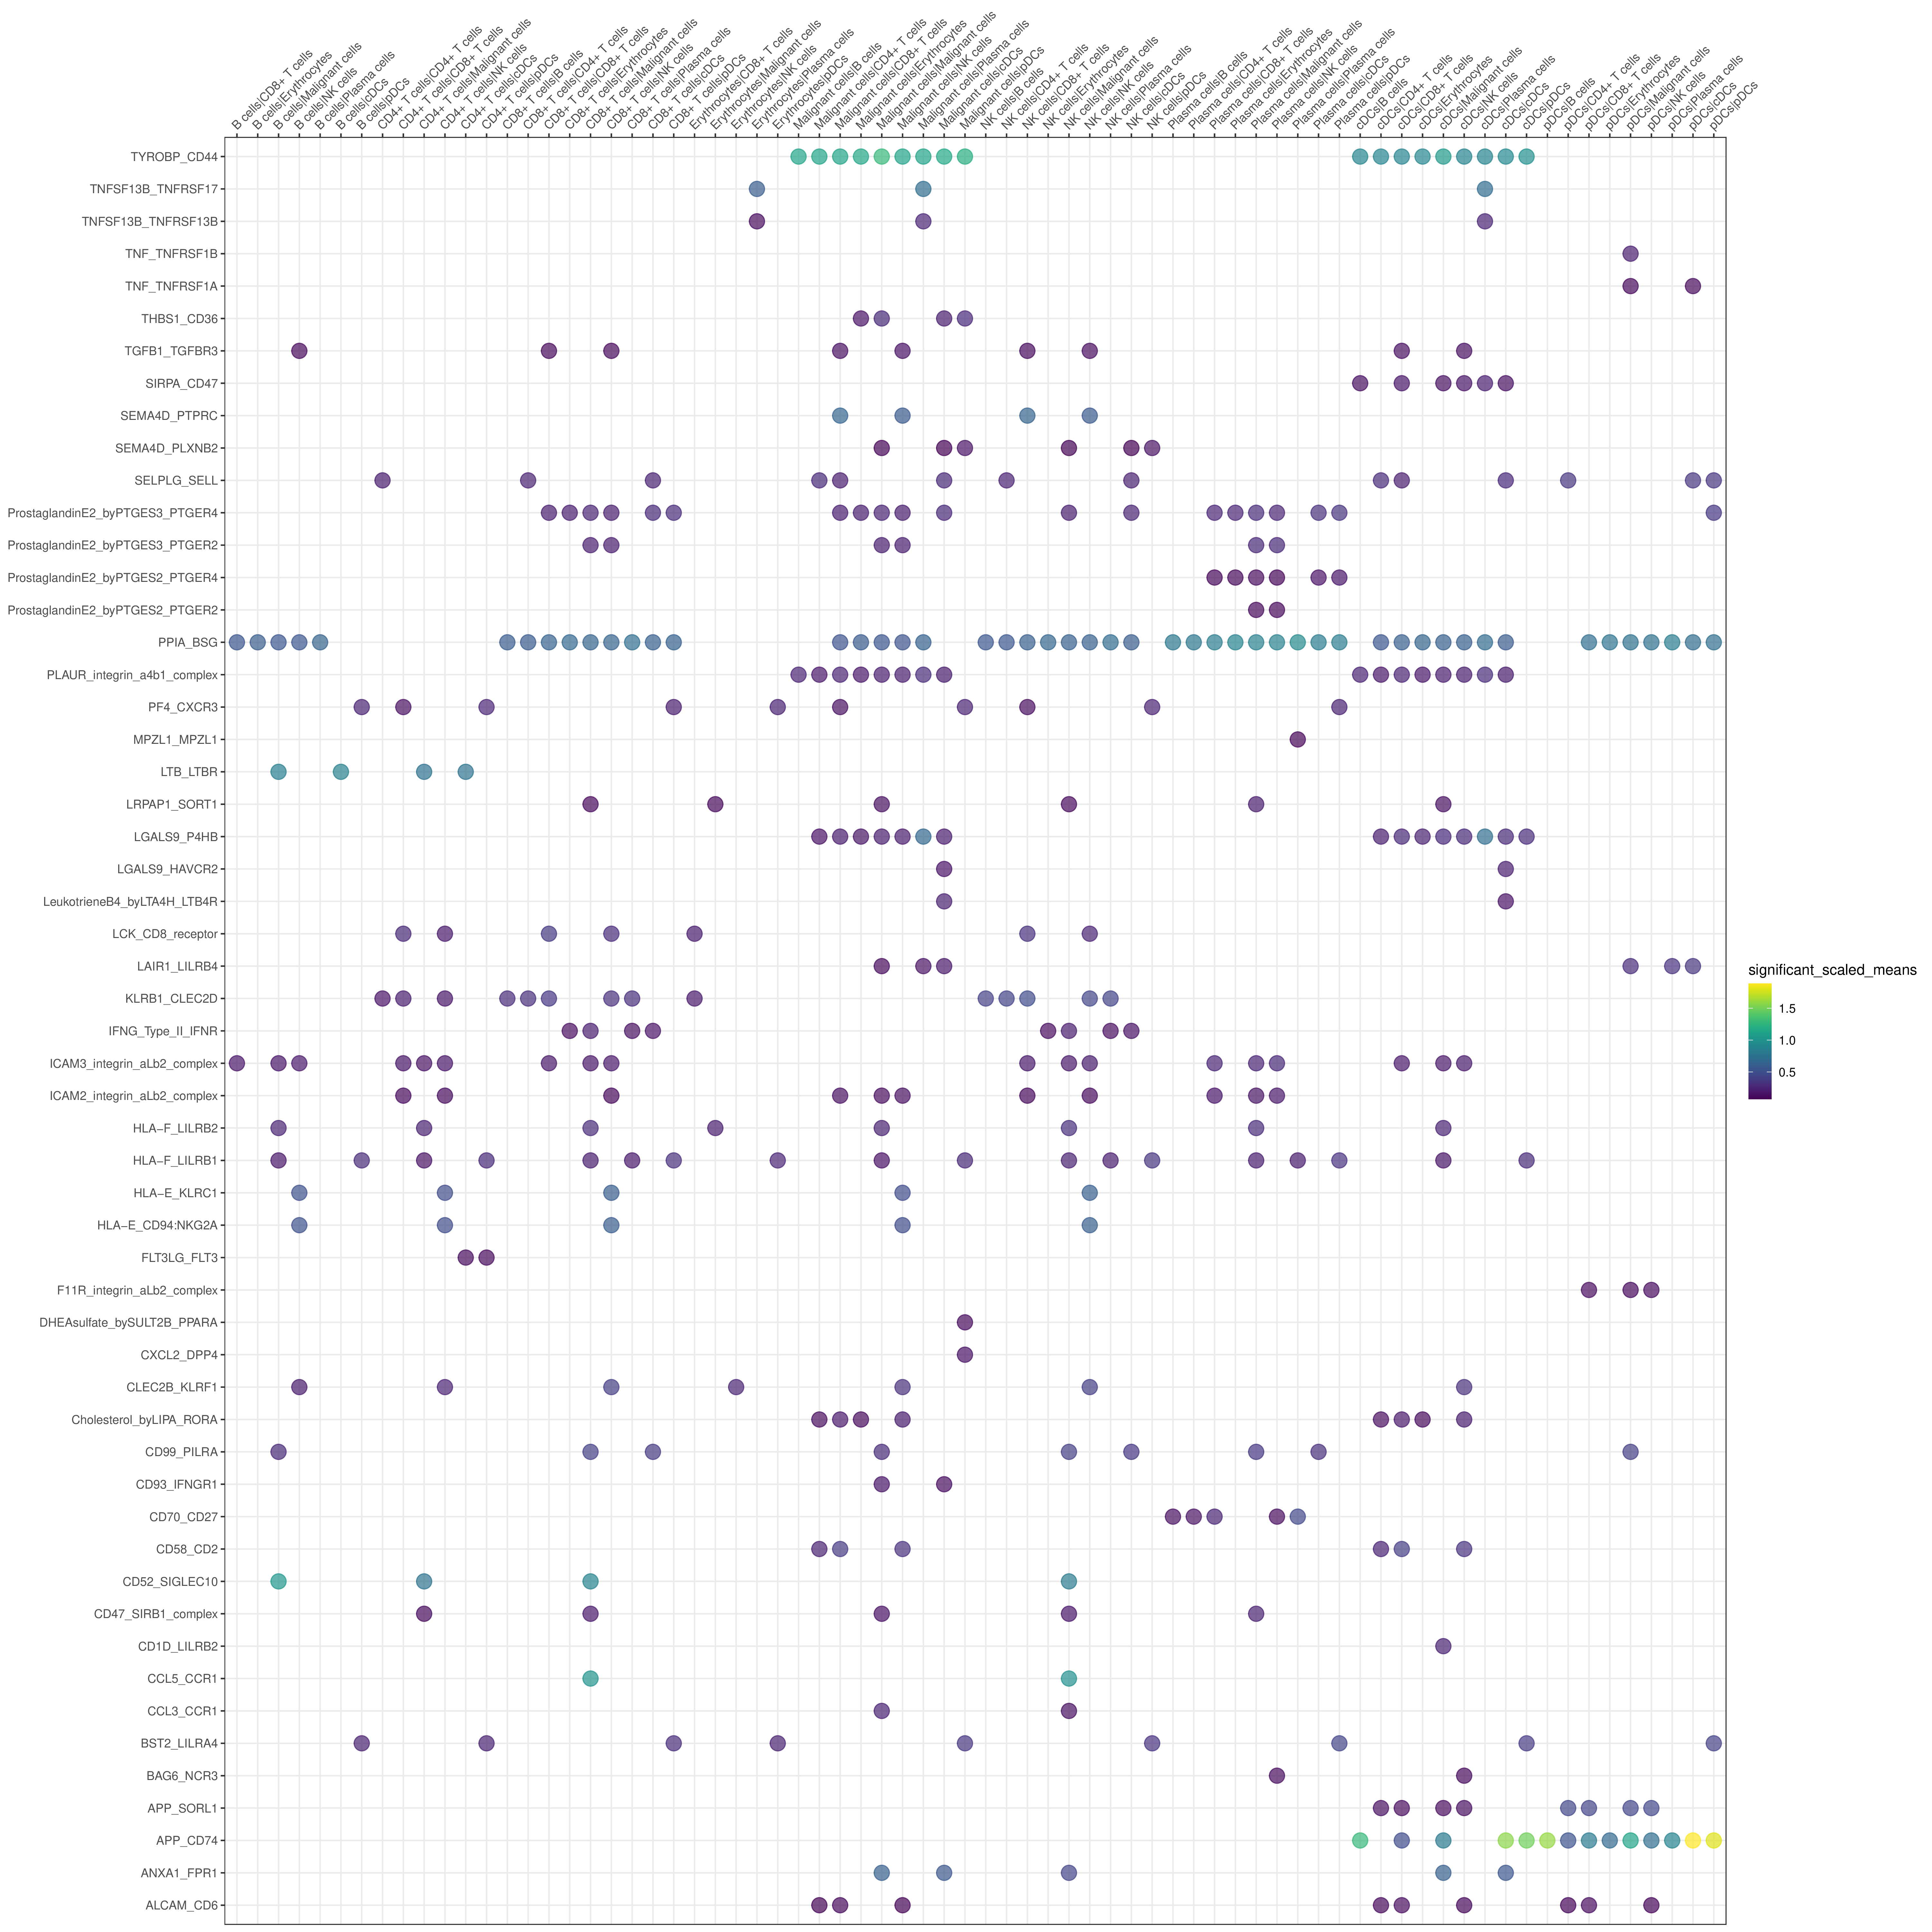
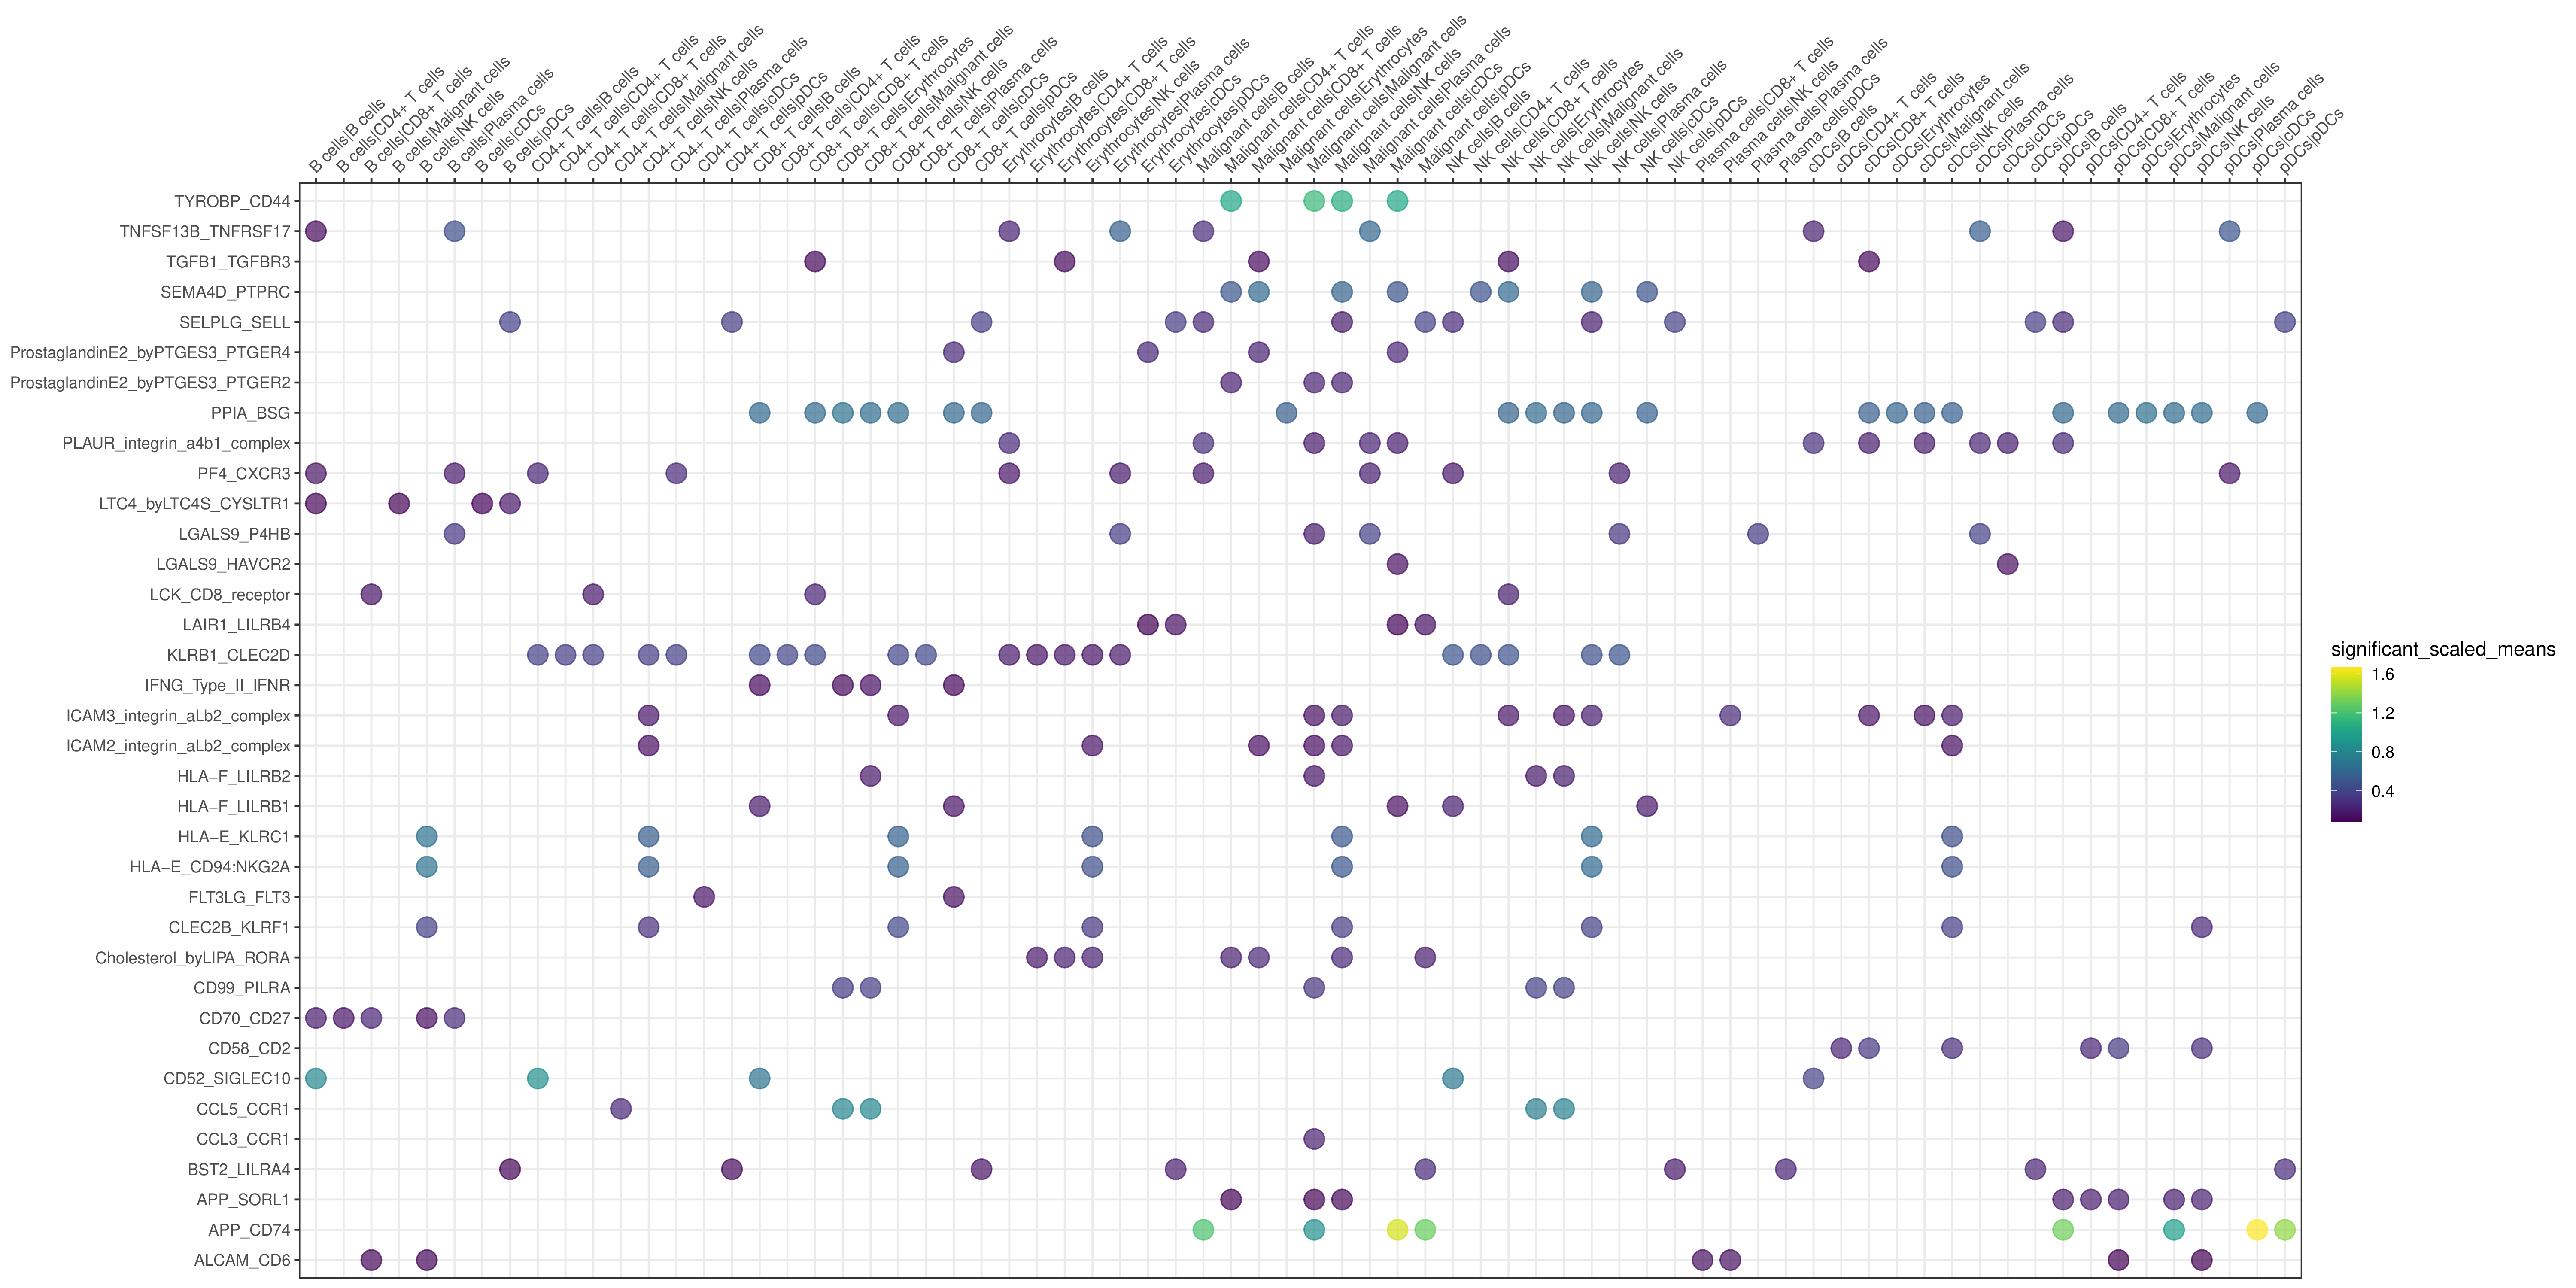
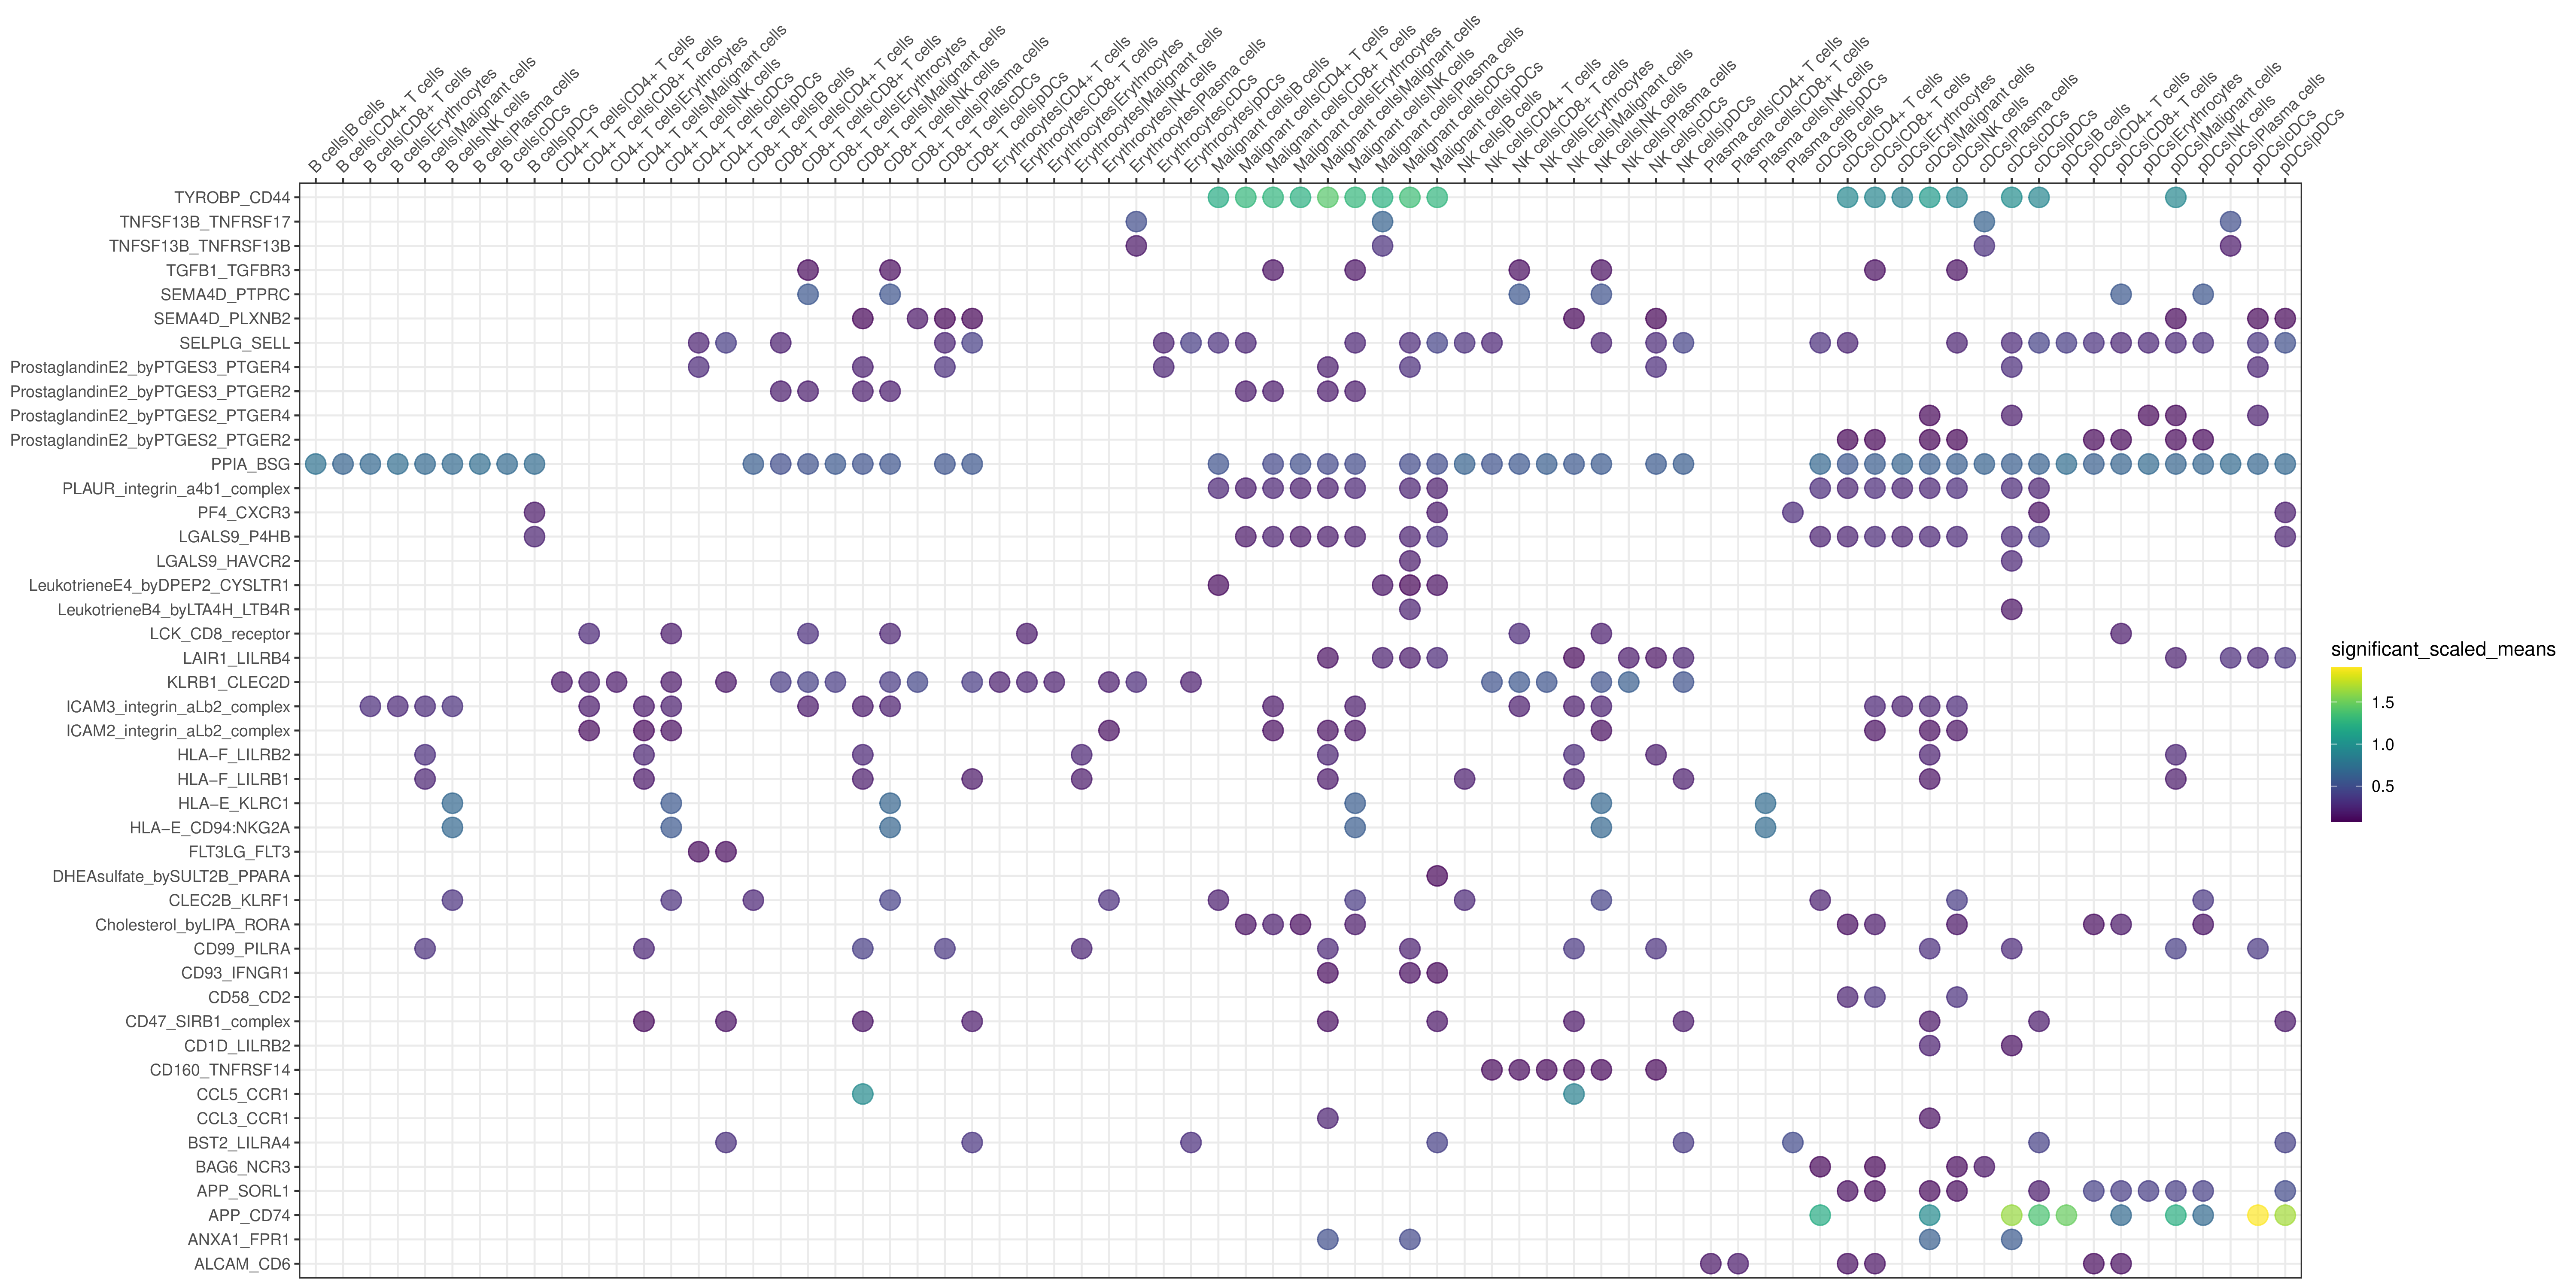
| In the pre-treatment samples, the difference in cell-cell interactions between the resistant and sensitive groups was compared. The numbers indicate the count of cell-cell interactions that were either higher or lower in the resistant group compared to the sensitive group. The dot plots of significant ligand-receptor pairs in the resistant group and sensitive group are subsequently displayed. (If the image exists, the user can click on it to enlarge it in a new window. Complete files can be downloaded from the download section.) |
resistant vs. sensitive 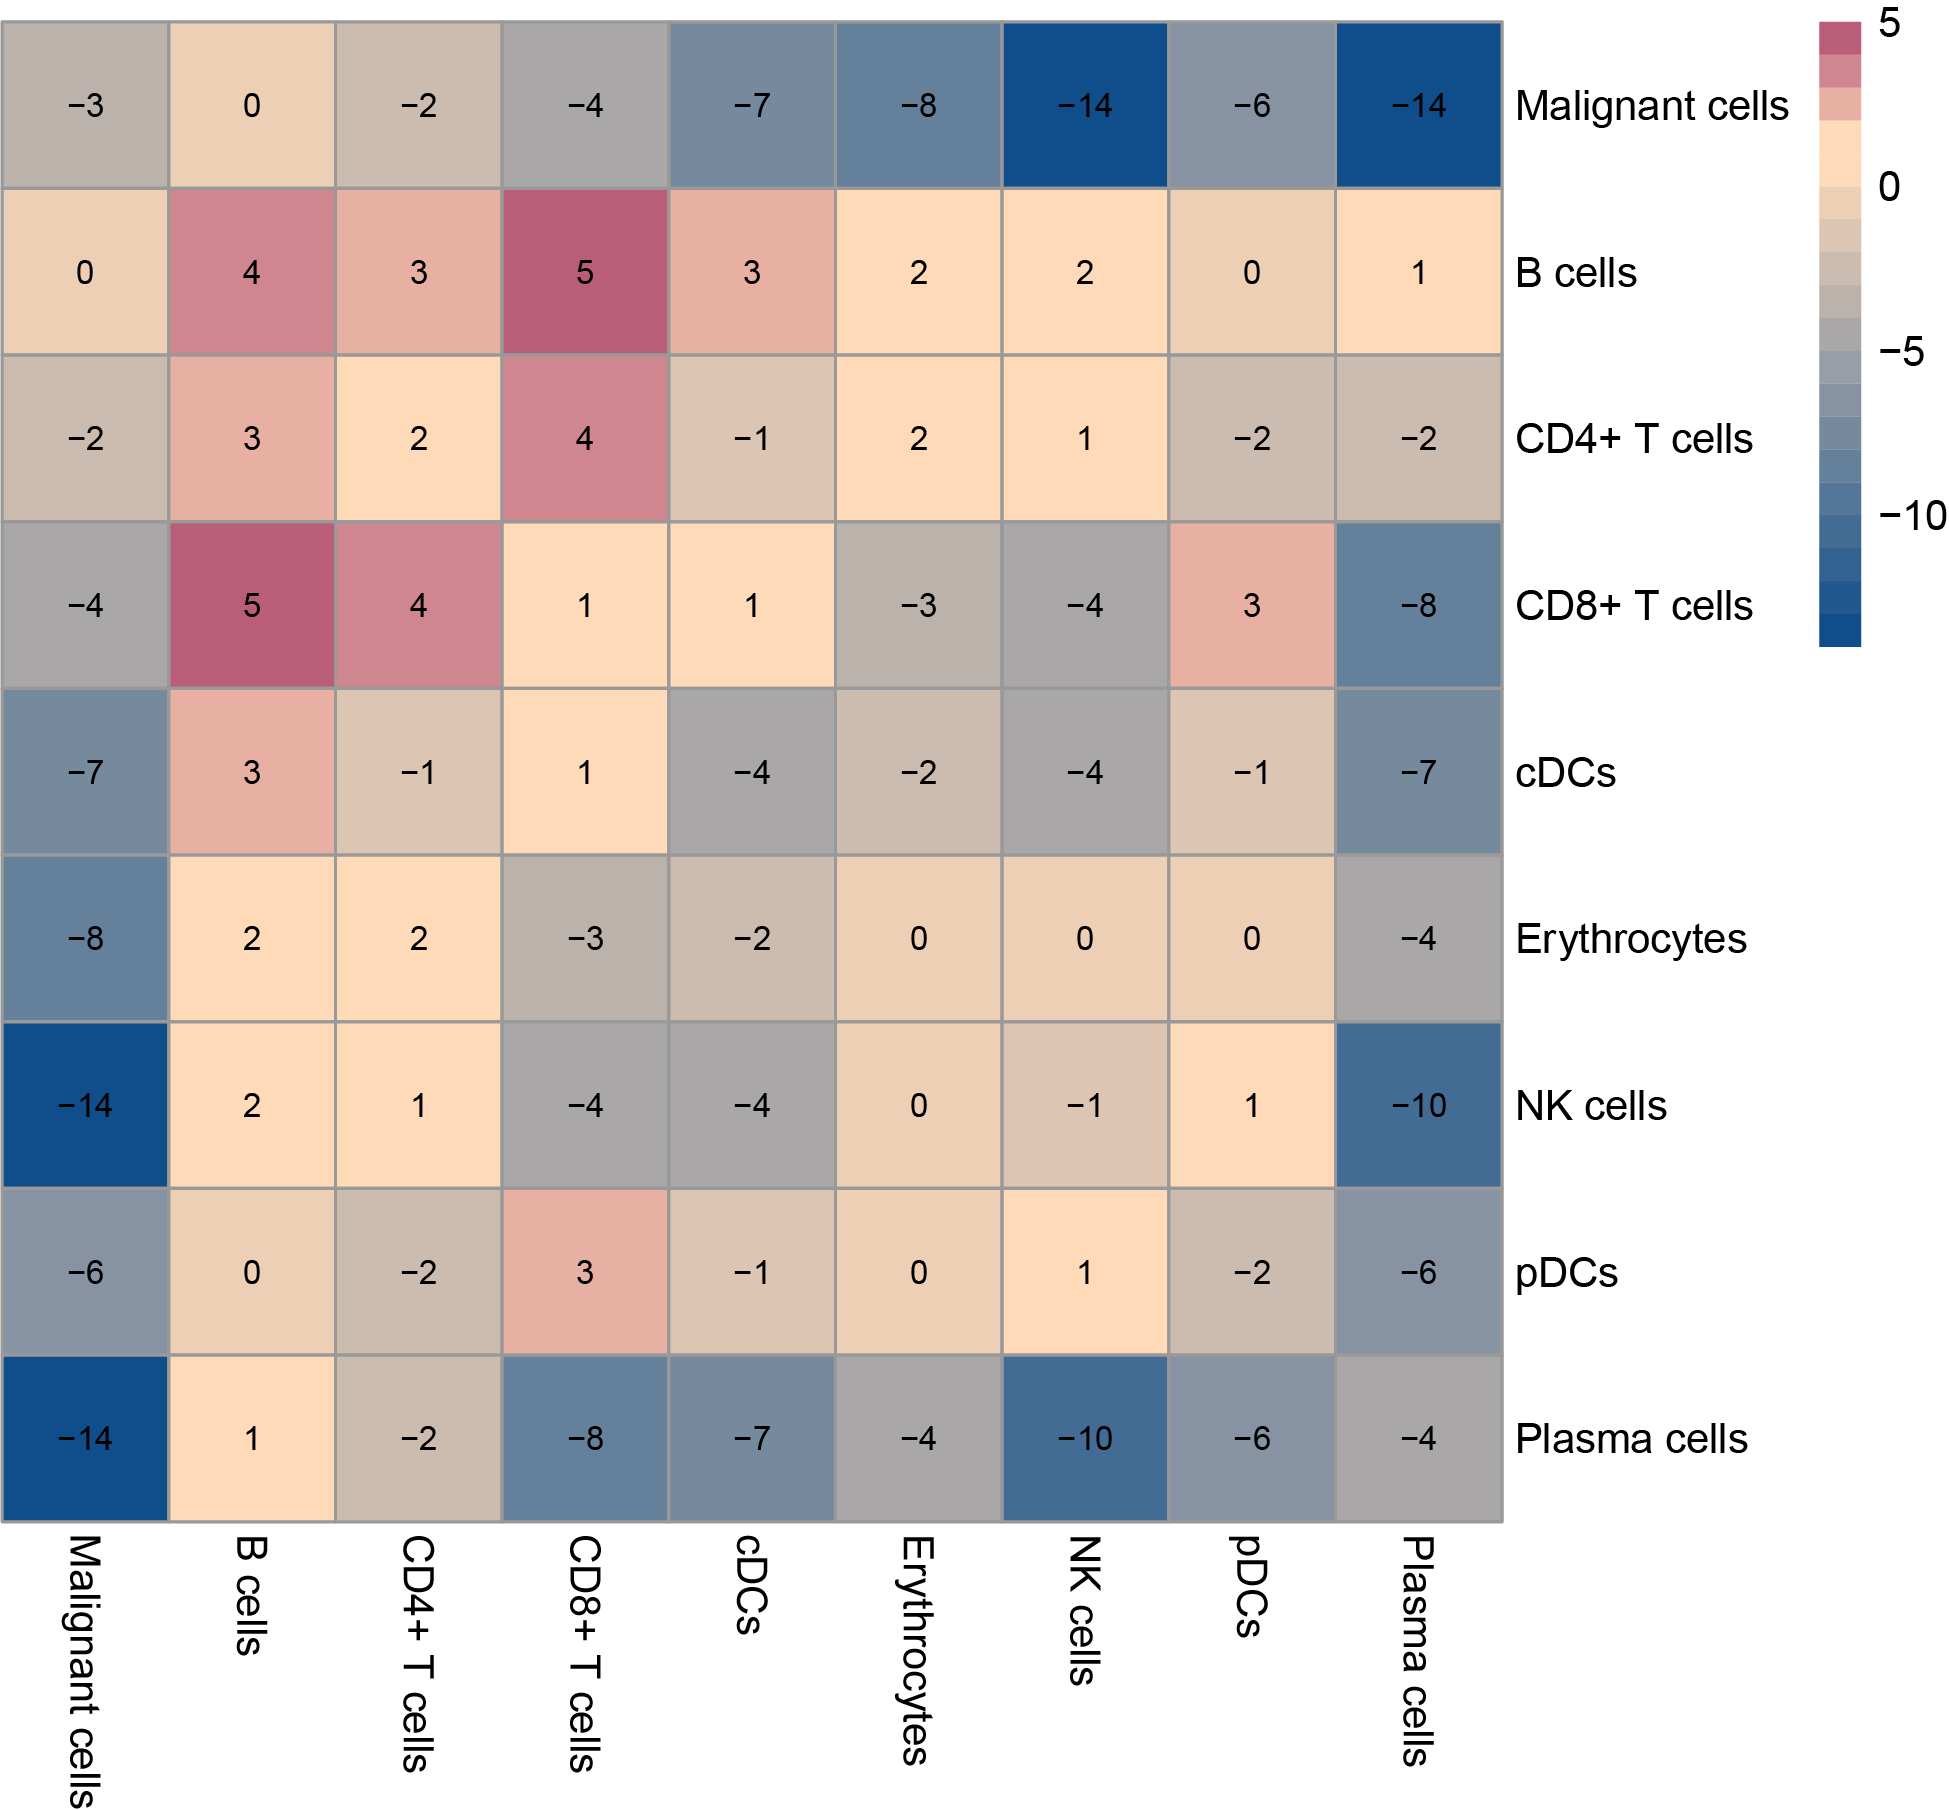 |
| Dot plot of significant ligand-receptor pairs in the resistant group | Dot plot of significant ligand-receptor pairs in the sensitive group |
 |  |
| In the post-treatment samples, the difference in cell-cell interactions between the resistant and sensitive groups was compared. The numbers indicate the count of cell-cell interactions that were either higher or lower in the resistant group compared to the sensitive group. The dot plots of significant ligand-receptor pairs in the resistant group and sensitive group are subsequently displayed. (If the image exists, the user can click on it to enlarge it in a new window. Complete files can be downloaded from the download section.) |
resistant vs. sensitive 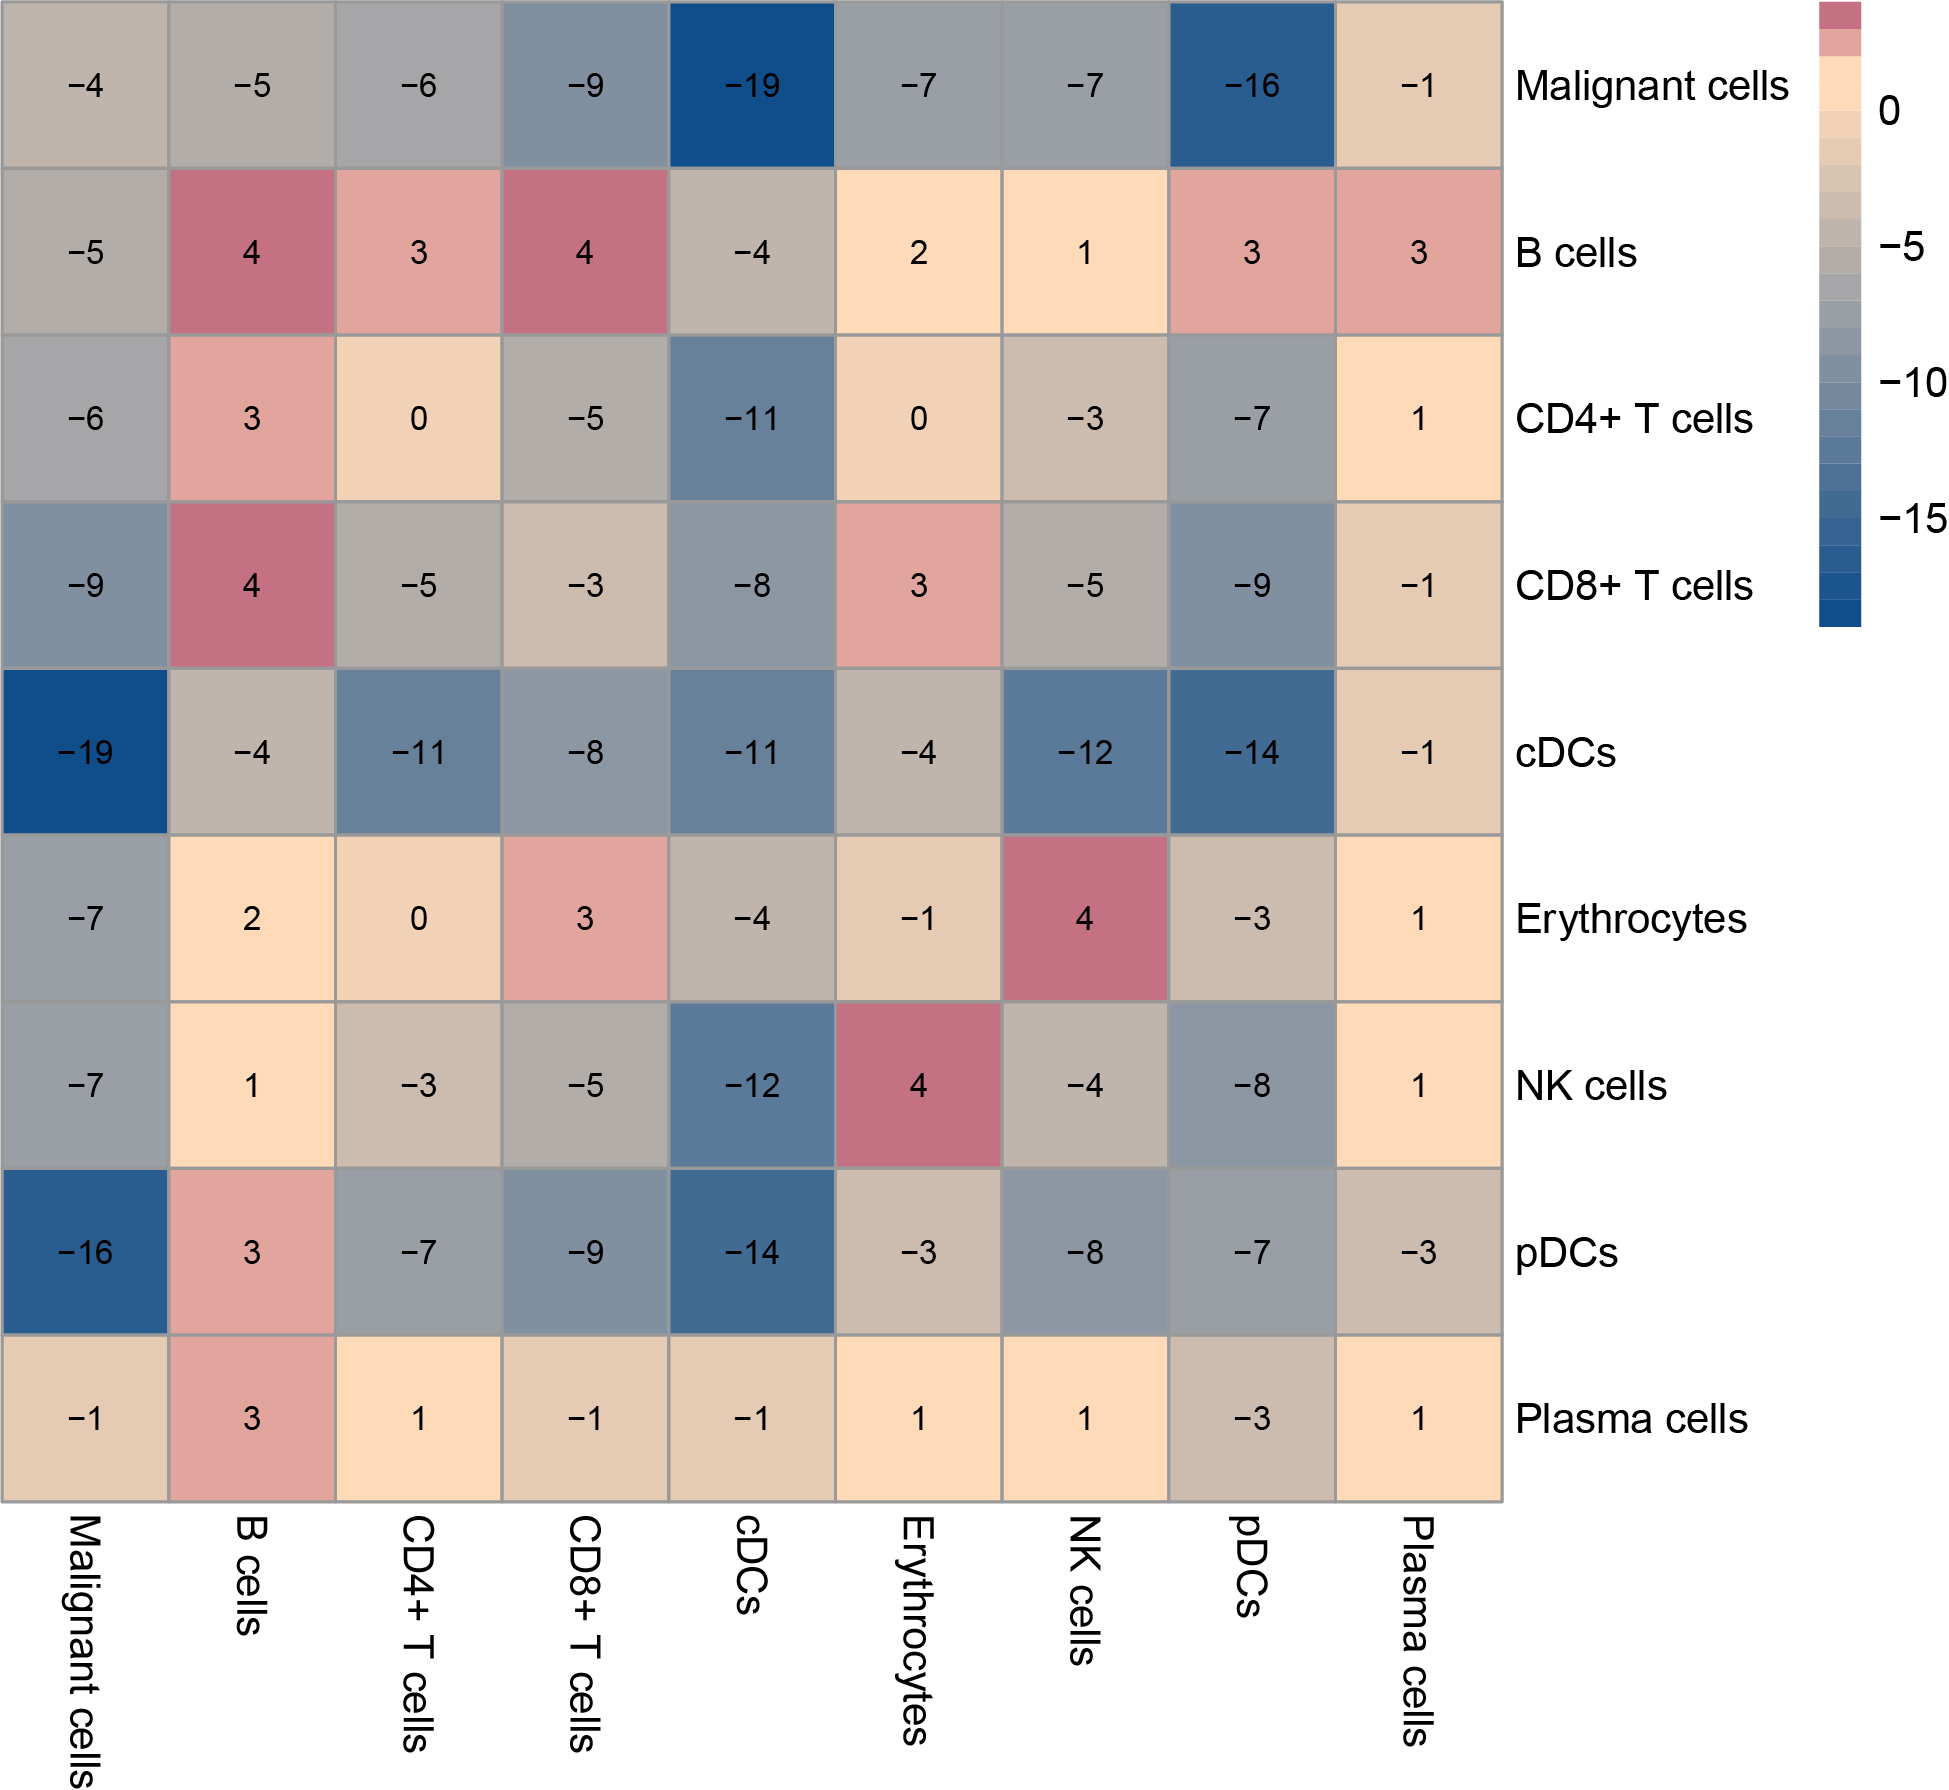 |
| Dot plot of significant ligand-receptor pairs in the resistant group | Dot plot of significant ligand-receptor pairs in the sensitive group |
 |  |
| This dataset only has one patient or is a cell line dataset, the resistant sample is the post-treatment sample and the sensitive sample is the pre-treatment sample. The difference in cell-cell interactions between the resistant and sensitive groups was compared. The numbers indicate the count of cell-cell interactions that were either higher or lower in the resistant group compared to the sensitive group. The dot plots of significant ligand-receptor pairs in the resistant group and sensitive group are subsequently displayed. (If the image exists, the user can click on it to enlarge it in a new window. Complete files can be downloaded from the download section.) |
Top |
Differentially expressed genes (DEGs) between the resistant and sensitive groups for each cell type |
| In the pre-treatment samples, the differentially expressed genes (|avg_log2FC|>0.25 & p_val_adj<0.05) between the resistant and sensitive groups for each cell type. |
| Gene symbol | Gene id | avg_log2FC | p_val | p_val_adj | pct.1 | pct.2 | Cell type | Timepoint |
RPL36A | ENSG00000241343 | 0.62492 | 4.57e-20 | 8.44e-16 | 0.884 | 0.7 | NK cells | pre |
RPS29 | ENSG00000213741 | 0.619981 | 1.22e-32 | 2.25e-28 | 1 | 1 | NK cells | pre |
MT-ND3 | ENSG00000198840 | 0.596179 | 6.66e-24 | 1.23e-19 | 1 | 0.987 | NK cells | pre |
IFITM3 | ENSG00000142089 | 0.573961 | 1.97e-11 | 3.64e-07 | 0.378 | 0.173 | NK cells | pre |
RPS28 | ENSG00000233927 | 0.560697 | 7.09e-33 | 1.31e-28 | 1 | 1 | NK cells | pre |
RPS21 | ENSG00000171858 | 0.506809 | 2.88e-22 | 5.33e-18 | 1 | 0.992 | NK cells | pre |
DONSON | ENSG00000159147 | 0.482524 | 1.38e-18 | 2.54e-14 | 0.489 | 0.195 | NK cells | pre |
RPL37 | ENSG00000145592 | 0.479432 | 3.21e-29 | 5.94e-25 | 1 | 1 | NK cells | pre |
RPL38 | ENSG00000172809 | 0.441247 | 7.74e-18 | 1.43e-13 | 0.996 | 0.99 | NK cells | pre |
RPL39 | ENSG00000198918 | 0.429866 | 8.94e-22 | 1.65e-17 | 1 | 1 | NK cells | pre |
RPS4Y1 | ENSG00000129824 | 0.422802 | 4.93e-12 | 9.12e-08 | 0.689 | 0.429 | NK cells | pre |
RPL37A | ENSG00000197756 | 0.42209 | 2.83e-21 | 5.23e-17 | 1 | 1 | NK cells | pre |
XCL2 | ENSG00000143185 | 0.419312 | 1.14e-06 | 2.11e-02 | 0.302 | 0.164 | NK cells | pre |
RPS27 | ENSG00000177954 | 0.406284 | 7.72e-16 | 1.43e-11 | 1 | 1 | NK cells | pre |
RPL36 | ENSG00000130255 | 0.401736 | 5.91e-18 | 1.09e-13 | 1 | 0.99 | NK cells | pre |
IFITM2 | ENSG00000185201 | 0.390679 | 1.66e-07 | 3.07e-03 | 0.827 | 0.723 | NK cells | pre |
IL2RB | ENSG00000100385 | 0.355208 | 1.16e-06 | 2.15e-02 | 0.347 | 0.2 | NK cells | pre |
RPL41 | ENSG00000229117 | 0.351875 | 1.10e-21 | 2.03e-17 | 1 | 1 | NK cells | pre |
IFITM1 | ENSG00000185885 | 0.349942 | 2.75e-07 | 5.09e-03 | 0.413 | 0.255 | NK cells | pre |
RPL23 | ENSG00000125691 | 0.342229 | 9.53e-11 | 1.76e-06 | 0.991 | 0.98 | NK cells | pre |
EIF5A | ENSG00000288145 | 0.330288 | 1.09e-08 | 2.02e-04 | 0.427 | 0.234 | NK cells | pre |
MT-ND2 | ENSG00000198763 | 0.317908 | 2.68e-11 | 4.96e-07 | 1 | 0.998 | NK cells | pre |
CD44 | ENSG00000026508 | 0.299992 | 1.74e-08 | 3.22e-04 | 0.489 | 0.277 | NK cells | pre |
RPL31 | ENSG00000071082 | 0.298289 | 2.51e-10 | 4.64e-06 | 1 | 1 | NK cells | pre |
S100A8 | ENSG00000143546 | 0.288125 | 1.63e-07 | 3.02e-03 | 0.449 | 0.264 | NK cells | pre |
RPS24 | ENSG00000138326 | 0.279524 | 3.20e-10 | 5.92e-06 | 1 | 0.998 | NK cells | pre |
FXYD5 | ENSG00000089327 | 0.27064 | 1.35e-06 | 2.49e-02 | 0.631 | 0.442 | NK cells | pre |
RPL35A | ENSG00000182899 | 0.261778 | 3.29e-09 | 6.09e-05 | 0.996 | 1 | NK cells | pre |
RPS19 | ENSG00000105372 | 0.25707 | 2.36e-08 | 4.36e-04 | 1 | 1 | NK cells | pre |
EMP3 | ENSG00000142227 | -0.362687 | 6.95e-07 | 1.29e-02 | 0.662 | 0.766 | NK cells | pre |
GIMAP7 | ENSG00000179144 | -0.370117 | 1.05e-08 | 1.95e-04 | 0.267 | 0.489 | NK cells | pre |
ANXA1 | ENSG00000135046 | -0.39027 | 1.15e-07 | 2.12e-03 | 0.422 | 0.625 | NK cells | pre |
SUB1 | ENSG00000113387 | -0.424887 | 2.38e-08 | 4.39e-04 | 0.649 | 0.766 | NK cells | pre |
GZMH | ENSG00000100450 | -0.503043 | 1.95e-09 | 3.60e-05 | 0.547 | 0.738 | NK cells | pre |
GZMA | ENSG00000145649 | -0.514777 | 8.00e-12 | 1.48e-07 | 0.809 | 0.941 | NK cells | pre |
FGFBP2 | ENSG00000137441 | -0.550693 | 2.80e-12 | 5.18e-08 | 0.271 | 0.54 | NK cells | pre |
LGALS1 | ENSG00000100097 | -0.578071 | 5.13e-07 | 9.48e-03 | 0.6 | 0.74 | NK cells | pre |
CCL5 | ENSG00000274233 | -0.617981 | 1.01e-15 | 1.86e-11 | 0.827 | 0.936 | NK cells | pre |
IFI6 | ENSG00000126709 | 0.844363 | 0.00e+00 | 0.00e+00 | 0.551 | 0.352 | Malignant cells | pre |
ANKRD28 | ENSG00000206560 | 0.815207 | 0.00e+00 | 0.00e+00 | 0.48 | 0.287 | Malignant cells | pre |
ISG15 | ENSG00000187608 | 0.771683 | 0.00e+00 | 0.00e+00 | 0.535 | 0.373 | Malignant cells | pre |
RPS29 | ENSG00000213741 | 0.749428 | 0.00e+00 | 0.00e+00 | 1 | 0.997 | Malignant cells | pre |
CD99 | ENSG00000002586 | 0.739337 | 0.00e+00 | 0.00e+00 | 0.544 | 0.377 | Malignant cells | pre |
RP11-620J15.3 | NA | 0.736126 | 0.00e+00 | 0.00e+00 | 0.387 | 0.043 | Malignant cells | pre |
RPS21 | ENSG00000171858 | 0.726499 | 0.00e+00 | 0.00e+00 | 0.993 | 0.955 | Malignant cells | pre |
MGST1 | ENSG00000008394 | 0.700026 | 0.00e+00 | 0.00e+00 | 0.506 | 0.273 | Malignant cells | pre |
HINT1 | ENSG00000169567 | 0.68751 | 0.00e+00 | 0.00e+00 | 0.729 | 0.699 | Malignant cells | pre |
RPS3 | ENSG00000149273 | 0.649272 | 0.00e+00 | 0.00e+00 | 0.997 | 0.998 | Malignant cells | pre |
SERPINB1 | ENSG00000021355 | 0.640085 | 0.00e+00 | 0.00e+00 | 0.627 | 0.439 | Malignant cells | pre |
RPL31 | ENSG00000071082 | 0.625954 | 0.00e+00 | 0.00e+00 | 0.995 | 0.985 | Malignant cells | pre |
| Page: 1 2 3 4 5 6 7 8 9 |
| In the post-treatment samples, the differentially expressed genes (|avg_log2FC|>0.25 & p_val_adj<0.05) between the resistant and sensitive groups for each cell type. |
| Gene symbol | Gene id | avg_log2FC | p_val | p_val_adj | pct.1 | pct.2 | Cell type | Timepoint |
FAM65B | NA | 0.533292 | 1.37e-25 | 2.54e-21 | 0.553 | 0.308 | cDCs | post |
PLAC8 | ENSG00000145287 | 0.528587 | 2.21e-21 | 4.09e-17 | 0.456 | 0.225 | cDCs | post |
PPBP | ENSG00000163736 | 0.505803 | 2.08e-20 | 3.85e-16 | 0.333 | 0.117 | cDCs | post |
CST3 | ENSG00000101439 | 0.480046 | 1.81e-14 | 3.35e-10 | 1 | 1 | cDCs | post |
DDX5 | ENSG00000108654 | 0.472657 | 1.56e-24 | 2.89e-20 | 0.909 | 0.857 | cDCs | post |
IFI16 | ENSG00000163565 | 0.438091 | 1.43e-20 | 2.64e-16 | 0.608 | 0.404 | cDCs | post |
TMSB4X | ENSG00000205542 | 0.429935 | 1.68e-44 | 3.07e-40 | 1 | 1 | cDCs | post |
OFD1 | ENSG00000046651 | 0.425462 | 3.67e-20 | 6.78e-16 | 0.364 | 0.151 | cDCs | post |
MT-ND5 | ENSG00000198786 | 0.421819 | 3.28e-20 | 6.06e-16 | 0.962 | 0.938 | cDCs | post |
PNRC1 | ENSG00000146278 | 0.413966 | 2.08e-19 | 3.84e-15 | 0.729 | 0.538 | cDCs | post |
IFI6 | ENSG00000126709 | 0.39485 | 2.75e-13 | 5.08e-09 | 0.346 | 0.18 | cDCs | post |
MARCKS | ENSG00000277443 | 0.390306 | 4.53e-16 | 8.37e-12 | 0.383 | 0.193 | cDCs | post |
DUSP1 | ENSG00000120129 | 0.38905 | 1.78e-15 | 3.30e-11 | 0.869 | 0.824 | cDCs | post |
UBC | ENSG00000150991 | 0.38515 | 3.08e-16 | 5.69e-12 | 0.909 | 0.852 | cDCs | post |
ISG15 | ENSG00000187608 | 0.377621 | 1.25e-08 | 2.31e-04 | 0.388 | 0.251 | cDCs | post |
NKG7 | ENSG00000105374 | 0.374803 | 2.28e-14 | 4.22e-10 | 0.351 | 0.171 | cDCs | post |
TPM3 | ENSG00000143549 | 0.371497 | 1.24e-13 | 2.29e-09 | 0.847 | 0.777 | cDCs | post |
PSAP | ENSG00000197746 | 0.368768 | 1.41e-14 | 2.61e-10 | 0.809 | 0.721 | cDCs | post |
ITGA4 | ENSG00000115232 | 0.357326 | 2.23e-16 | 4.13e-12 | 0.421 | 0.225 | cDCs | post |
CALM2 | ENSG00000143933 | 0.351482 | 8.02e-12 | 1.48e-07 | 0.927 | 0.904 | cDCs | post |
CKLF | ENSG00000217555 | 0.326515 | 8.97e-08 | 1.66e-03 | 0.646 | 0.579 | cDCs | post |
MEF2C | ENSG00000081189 | 0.326301 | 1.20e-12 | 2.22e-08 | 0.668 | 0.521 | cDCs | post |
MYL12A | ENSG00000101608 | 0.318112 | 1.99e-14 | 3.67e-10 | 0.959 | 0.934 | cDCs | post |
ZFAS1 | ENSG00000177410 | 0.3178 | 4.50e-12 | 8.31e-08 | 0.766 | 0.622 | cDCs | post |
N4BP2L2 | ENSG00000244754 | 0.314094 | 2.91e-13 | 5.38e-09 | 0.526 | 0.348 | cDCs | post |
RNASET2 | ENSG00000026297 | 0.31317 | 3.28e-12 | 6.07e-08 | 0.748 | 0.626 | cDCs | post |
FTL | ENSG00000087086 | 0.30647 | 1.85e-06 | 3.42e-02 | 1 | 1 | cDCs | post |
HLA-DPA1 | ENSG00000228163 | 0.305883 | 2.12e-15 | 3.92e-11 | 0.994 | 1 | cDCs | post |
MORF4L1 | ENSG00000185787 | 0.305408 | 7.90e-11 | 1.46e-06 | 0.636 | 0.496 | cDCs | post |
DHRS9 | ENSG00000073737 | 0.299966 | 5.37e-19 | 9.92e-15 | 0.254 | 0.074 | cDCs | post |
FOS | ENSG00000170345 | 0.299254 | 1.17e-08 | 2.16e-04 | 0.968 | 0.974 | cDCs | post |
PTPRC | ENSG00000262418 | 0.298734 | 7.35e-10 | 1.36e-05 | 0.781 | 0.718 | cDCs | post |
PKIB | ENSG00000135549 | 0.294745 | 2.64e-14 | 4.88e-10 | 0.305 | 0.136 | cDCs | post |
NCF1 | ENSG00000158517 | 0.294525 | 8.95e-11 | 1.65e-06 | 0.349 | 0.196 | cDCs | post |
RPS19 | ENSG00000105372 | 0.292499 | 5.01e-30 | 9.26e-26 | 1 | 1 | cDCs | post |
HLA-A | ENSG00000227715 | 0.289387 | 8.65e-09 | 1.60e-04 | 0.877 | 0.834 | cDCs | post |
DUSP6 | ENSG00000139318 | 0.286079 | 2.61e-12 | 4.82e-08 | 0.254 | 0.106 | cDCs | post |
CCL5 | ENSG00000274233 | 0.284856 | 2.31e-06 | 4.28e-02 | 0.254 | 0.153 | cDCs | post |
RP11-386I14.4 | NA | 0.284473 | 1.90e-07 | 3.52e-03 | 0.373 | 0.257 | cDCs | post |
B2M | ENSG00000273686 | 0.28138 | 3.06e-26 | 5.66e-22 | 1 | 1 | cDCs | post |
SEPT7 | NA | 0.280877 | 1.33e-09 | 2.46e-05 | 0.614 | 0.478 | cDCs | post |
NPM1 | ENSG00000181163 | 0.279749 | 2.53e-07 | 4.68e-03 | 0.777 | 0.775 | cDCs | post |
C12orf57 | ENSG00000111678 | 0.276805 | 5.43e-08 | 1.00e-03 | 0.378 | 0.251 | cDCs | post |
EMB | ENSG00000170571 | 0.272402 | 7.56e-10 | 1.40e-05 | 0.359 | 0.219 | cDCs | post |
RPL36AL | ENSG00000165502 | 0.265482 | 2.41e-11 | 4.46e-07 | 0.876 | 0.858 | cDCs | post |
LCP1 | ENSG00000136167 | 0.259586 | 4.33e-08 | 8.01e-04 | 0.738 | 0.63 | cDCs | post |
LST1 | ENSG00000235915 | 0.255836 | 3.58e-08 | 6.62e-04 | 0.954 | 0.935 | cDCs | post |
SH3BGRL | ENSG00000131171 | 0.254112 | 3.31e-08 | 6.13e-04 | 0.633 | 0.513 | cDCs | post |
CAPG | ENSG00000042493 | -0.250176 | 3.65e-13 | 6.75e-09 | 0.396 | 0.607 | cDCs | post |
PLD4 | ENSG00000166428 | -0.250526 | 6.92e-14 | 1.28e-09 | 0.179 | 0.364 | cDCs | post |
| Page: 1 2 3 4 5 6 7 8 9 10 11 12 |
| This dataset only has one patient or is a cell line dataset, the resistant sample is the post-treatment sample and the sensitive sample is the pre-treatment sample. The following are differentially expressed genes (|avg_log2FC|>0.25 & p_val_adj<0.05) between the resistant and sensitive groups for each cell type. |
Top |
Mechanism analysis of drug resistance-related DEGs for each cell type in the pre-treatment samples |
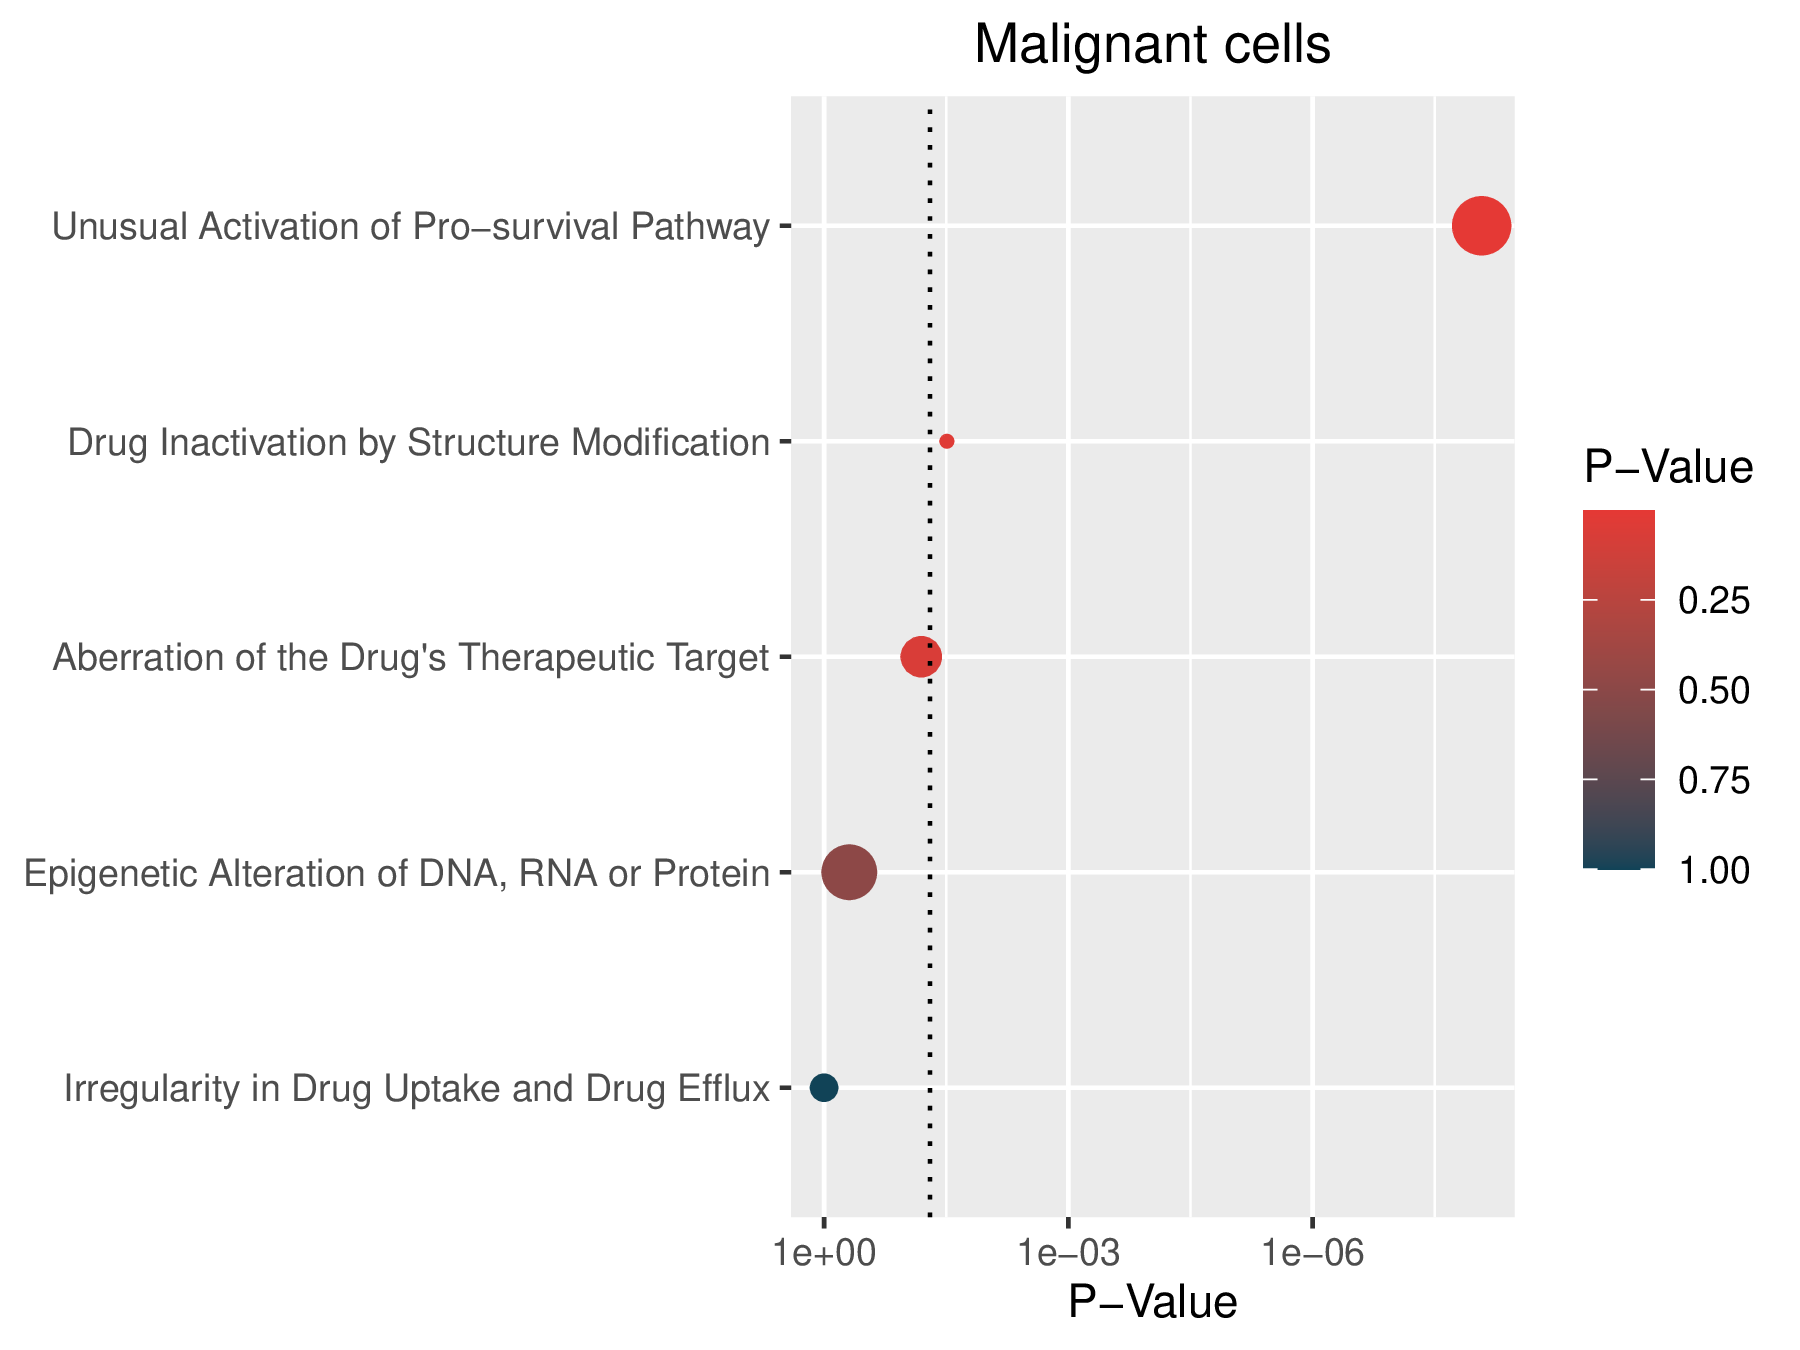
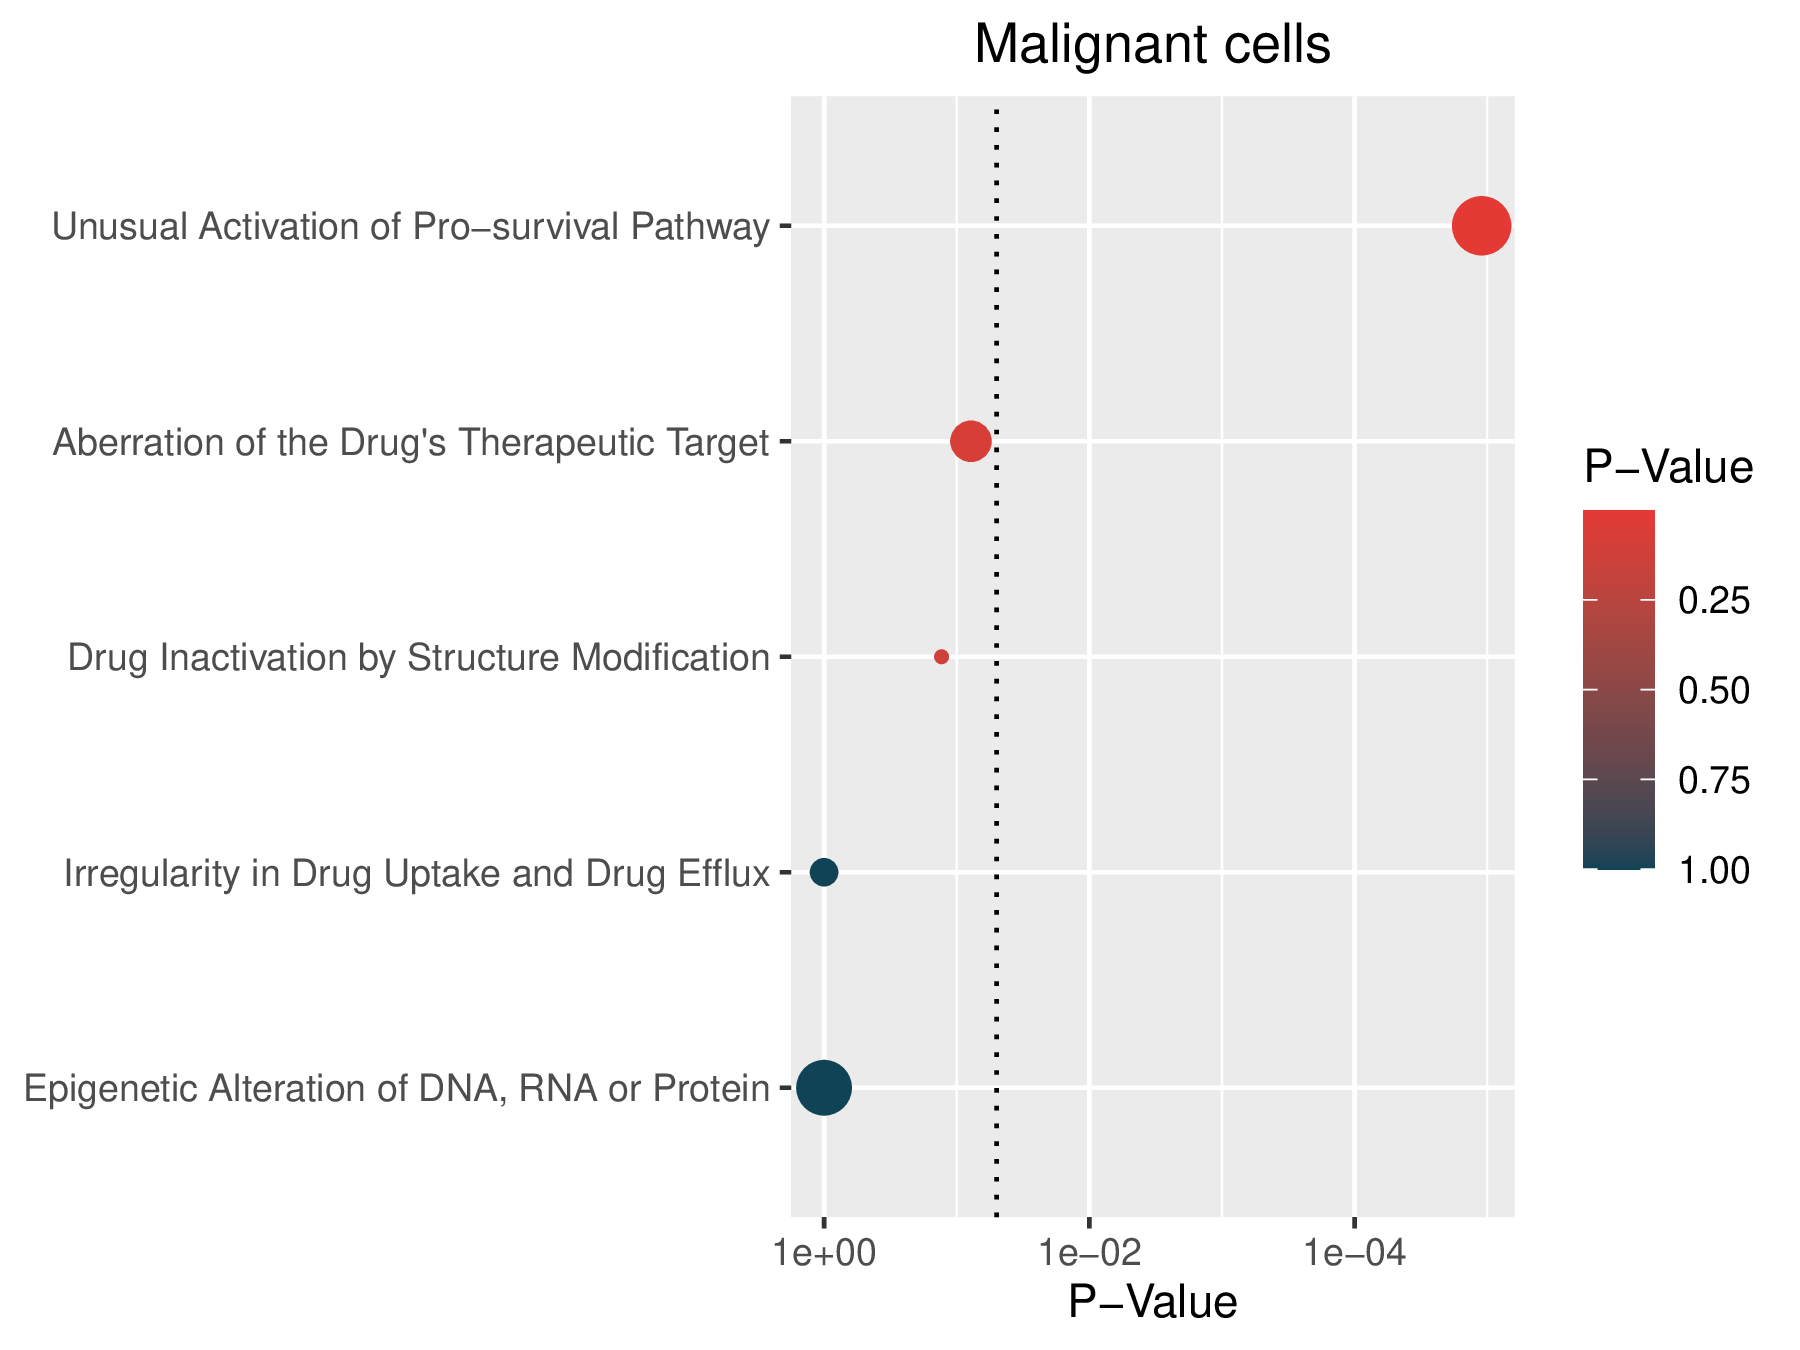
| Enrichment results for 5 known drug-resistant mechanisms in malignant cells and 1 known mechanism in TME cells.The "Signature" column represents the differentially expressed genes (DEGs) used for enrichment. The "Geneset" column represents the genes included in this mechanism. The "Overlap" column represents the number of genes in the "Geneset" that are enriched in the "Signature". The "Enriched Genes" column represents the genes in the "Geneset" that are enriched in the "Signature". (If the image exists, the user can click on it to enlarge it in a new window.) |
| Enrichment results for 5 known drug-resistant mechanisms in malignant cells |
 |
| Mechnism | Pval | FDR | Signature | Geneset | Overlap | Background | Cell type | Enriched Genes |
| Unusual Activation of Pro-survival Pathway | 8.40e-09 | 4.20e-08 | 239 | 781 | 28 | 23467 | Malignant cells | ANXA2,CDK6,GSTP1,ISG15,JUN,MCL1,MAP1LC3B,RPS6,S100A4,SOX4,HSPA5,BTG1,CD44,CLU,CXCR4,DUSP1,EGR1,GAPDH,NFKBIA,IL1B,MAP3K8,RAC1,HNRNPA1,S100A8,S100A11,SOD2,TNFAIP3,NPM1 |
| Drug Inactivation by Structure Modification | 3.10e-02 | 7.70e-02 | 239 | 27 | 2 | 23467 | Malignant cells | GSTP1,SOD2 |
| Aberration of the Drug's Therapeutic Target | 6.40e-02 | 1.10e-01 | 239 | 90 | 3 | 23467 | Malignant cells | CDK6,IL1B,NPM1 |
| Epigenetic Alteration of DNA, RNA or Protein | 4.90e-01 | 6.20e-01 | 239 | 455 | 5 | 23467 | Malignant cells | LMNA,CXCR4,GAPDH,MAP3K8,TIMP1 |
| Irregularity in Drug Uptake and Drug Efflux | 1.00e+00 | 1.00e+00 | 239 | 37 | 0 | 23467 | Malignant cells |
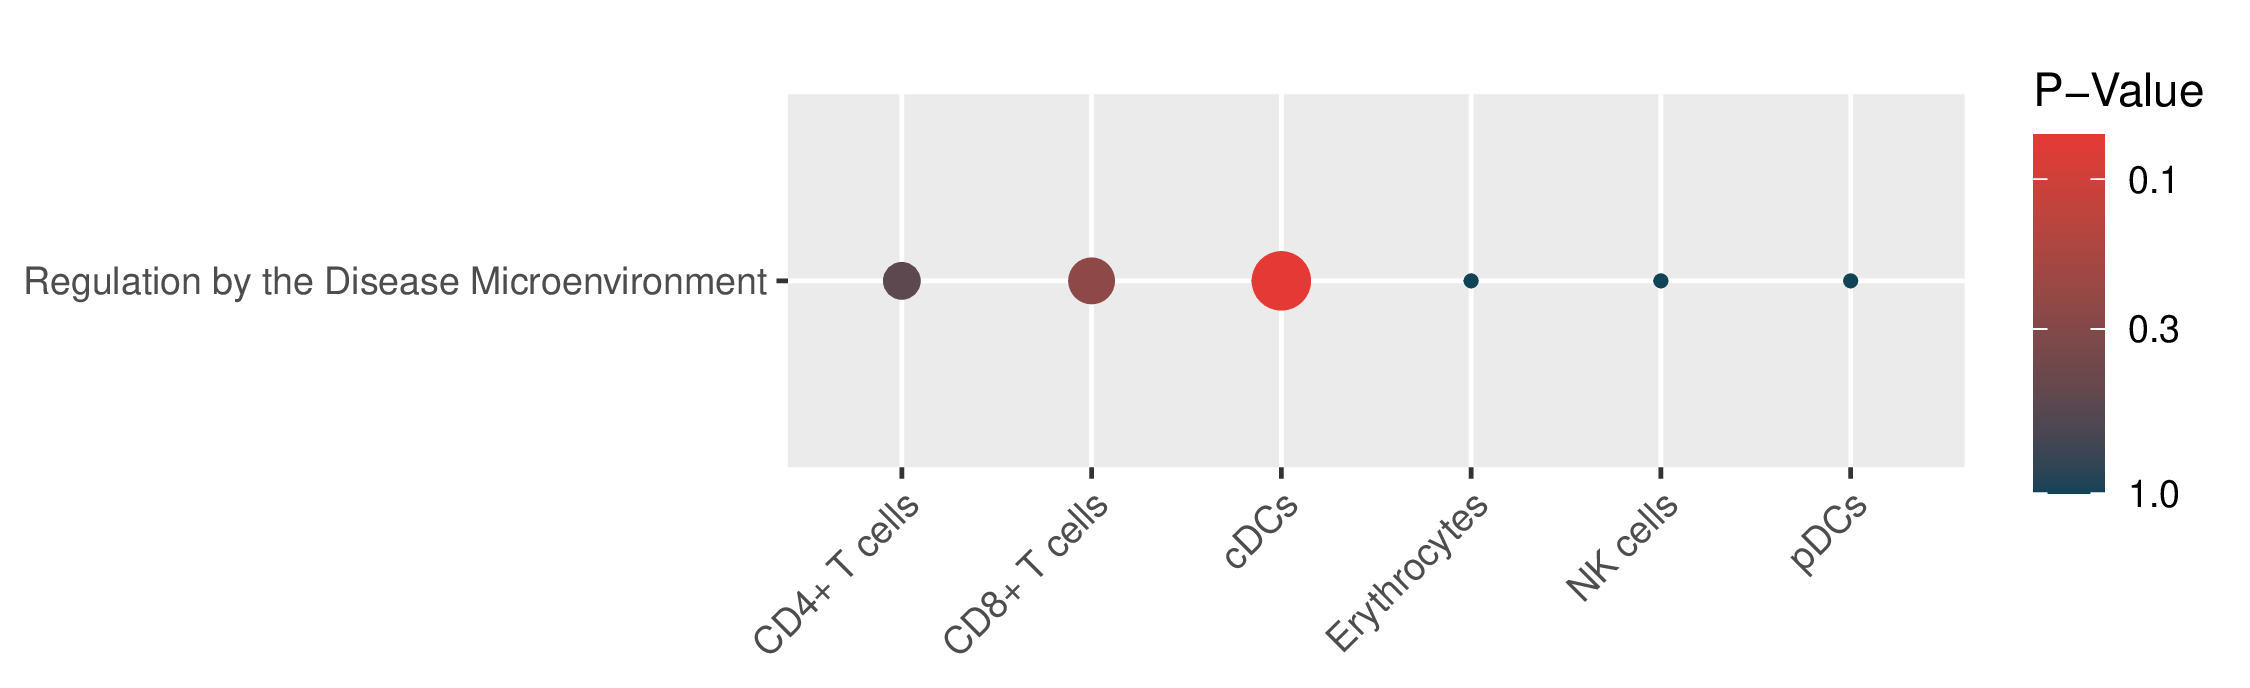
| Enrichment results for 1 known drug resistance mechanisms in TME cells |
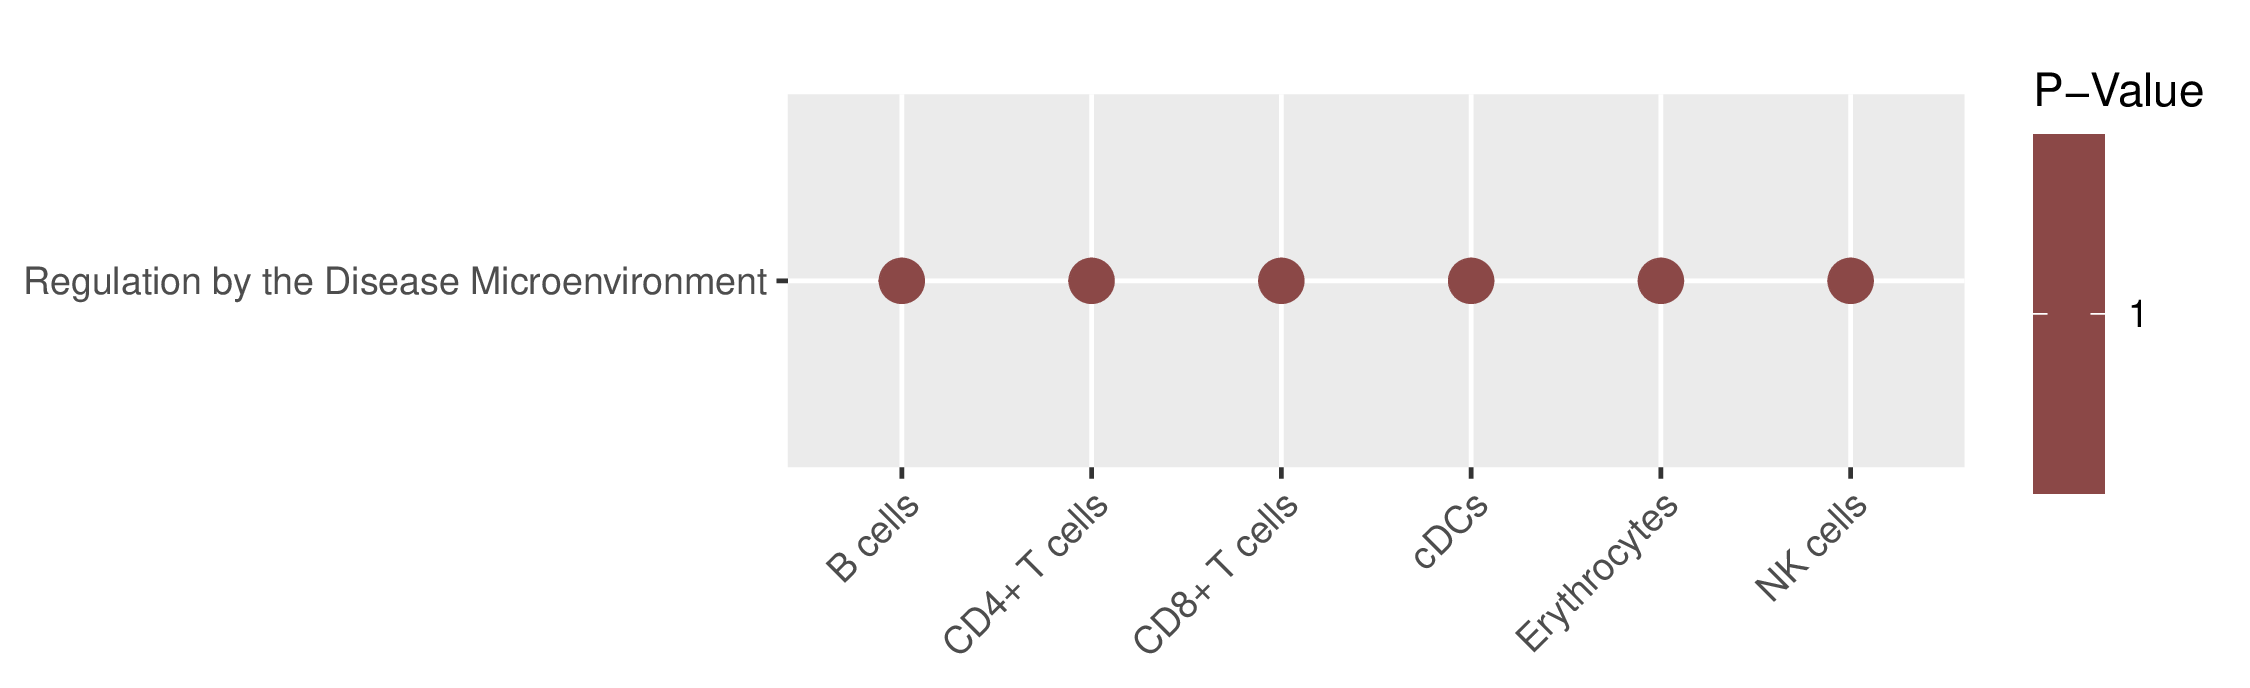 |
| Mechnism | Pval | FDR | Signature | Geneset | Overlap | Background | Cell type | Enriched Genes |
| Regulation by the Disease Microenvironment | 1.00e+00 | 1.00e+00 | 14 | 186 | 0 | 23467 | B cells | NA |
| Regulation by the Disease Microenvironment | 1.00e+00 | 1.00e+00 | 31 | 186 | 0 | 23467 | CD4+ T cells | NA |
| Regulation by the Disease Microenvironment | 1.00e+00 | 1.00e+00 | 40 | 186 | 0 | 23467 | CD8+ T cells | NA |
| Regulation by the Disease Microenvironment | 1.00e+00 | 1.00e+00 | 29 | 186 | 0 | 23467 | cDCs | NA |
| Regulation by the Disease Microenvironment | 1.00e+00 | 1.00e+00 | 20 | 186 | 0 | 23467 | Erythrocytes | NA |
| Regulation by the Disease Microenvironment | 1.00e+00 | 1.00e+00 | 38 | 186 | 0 | 23467 | NK cells | NA |
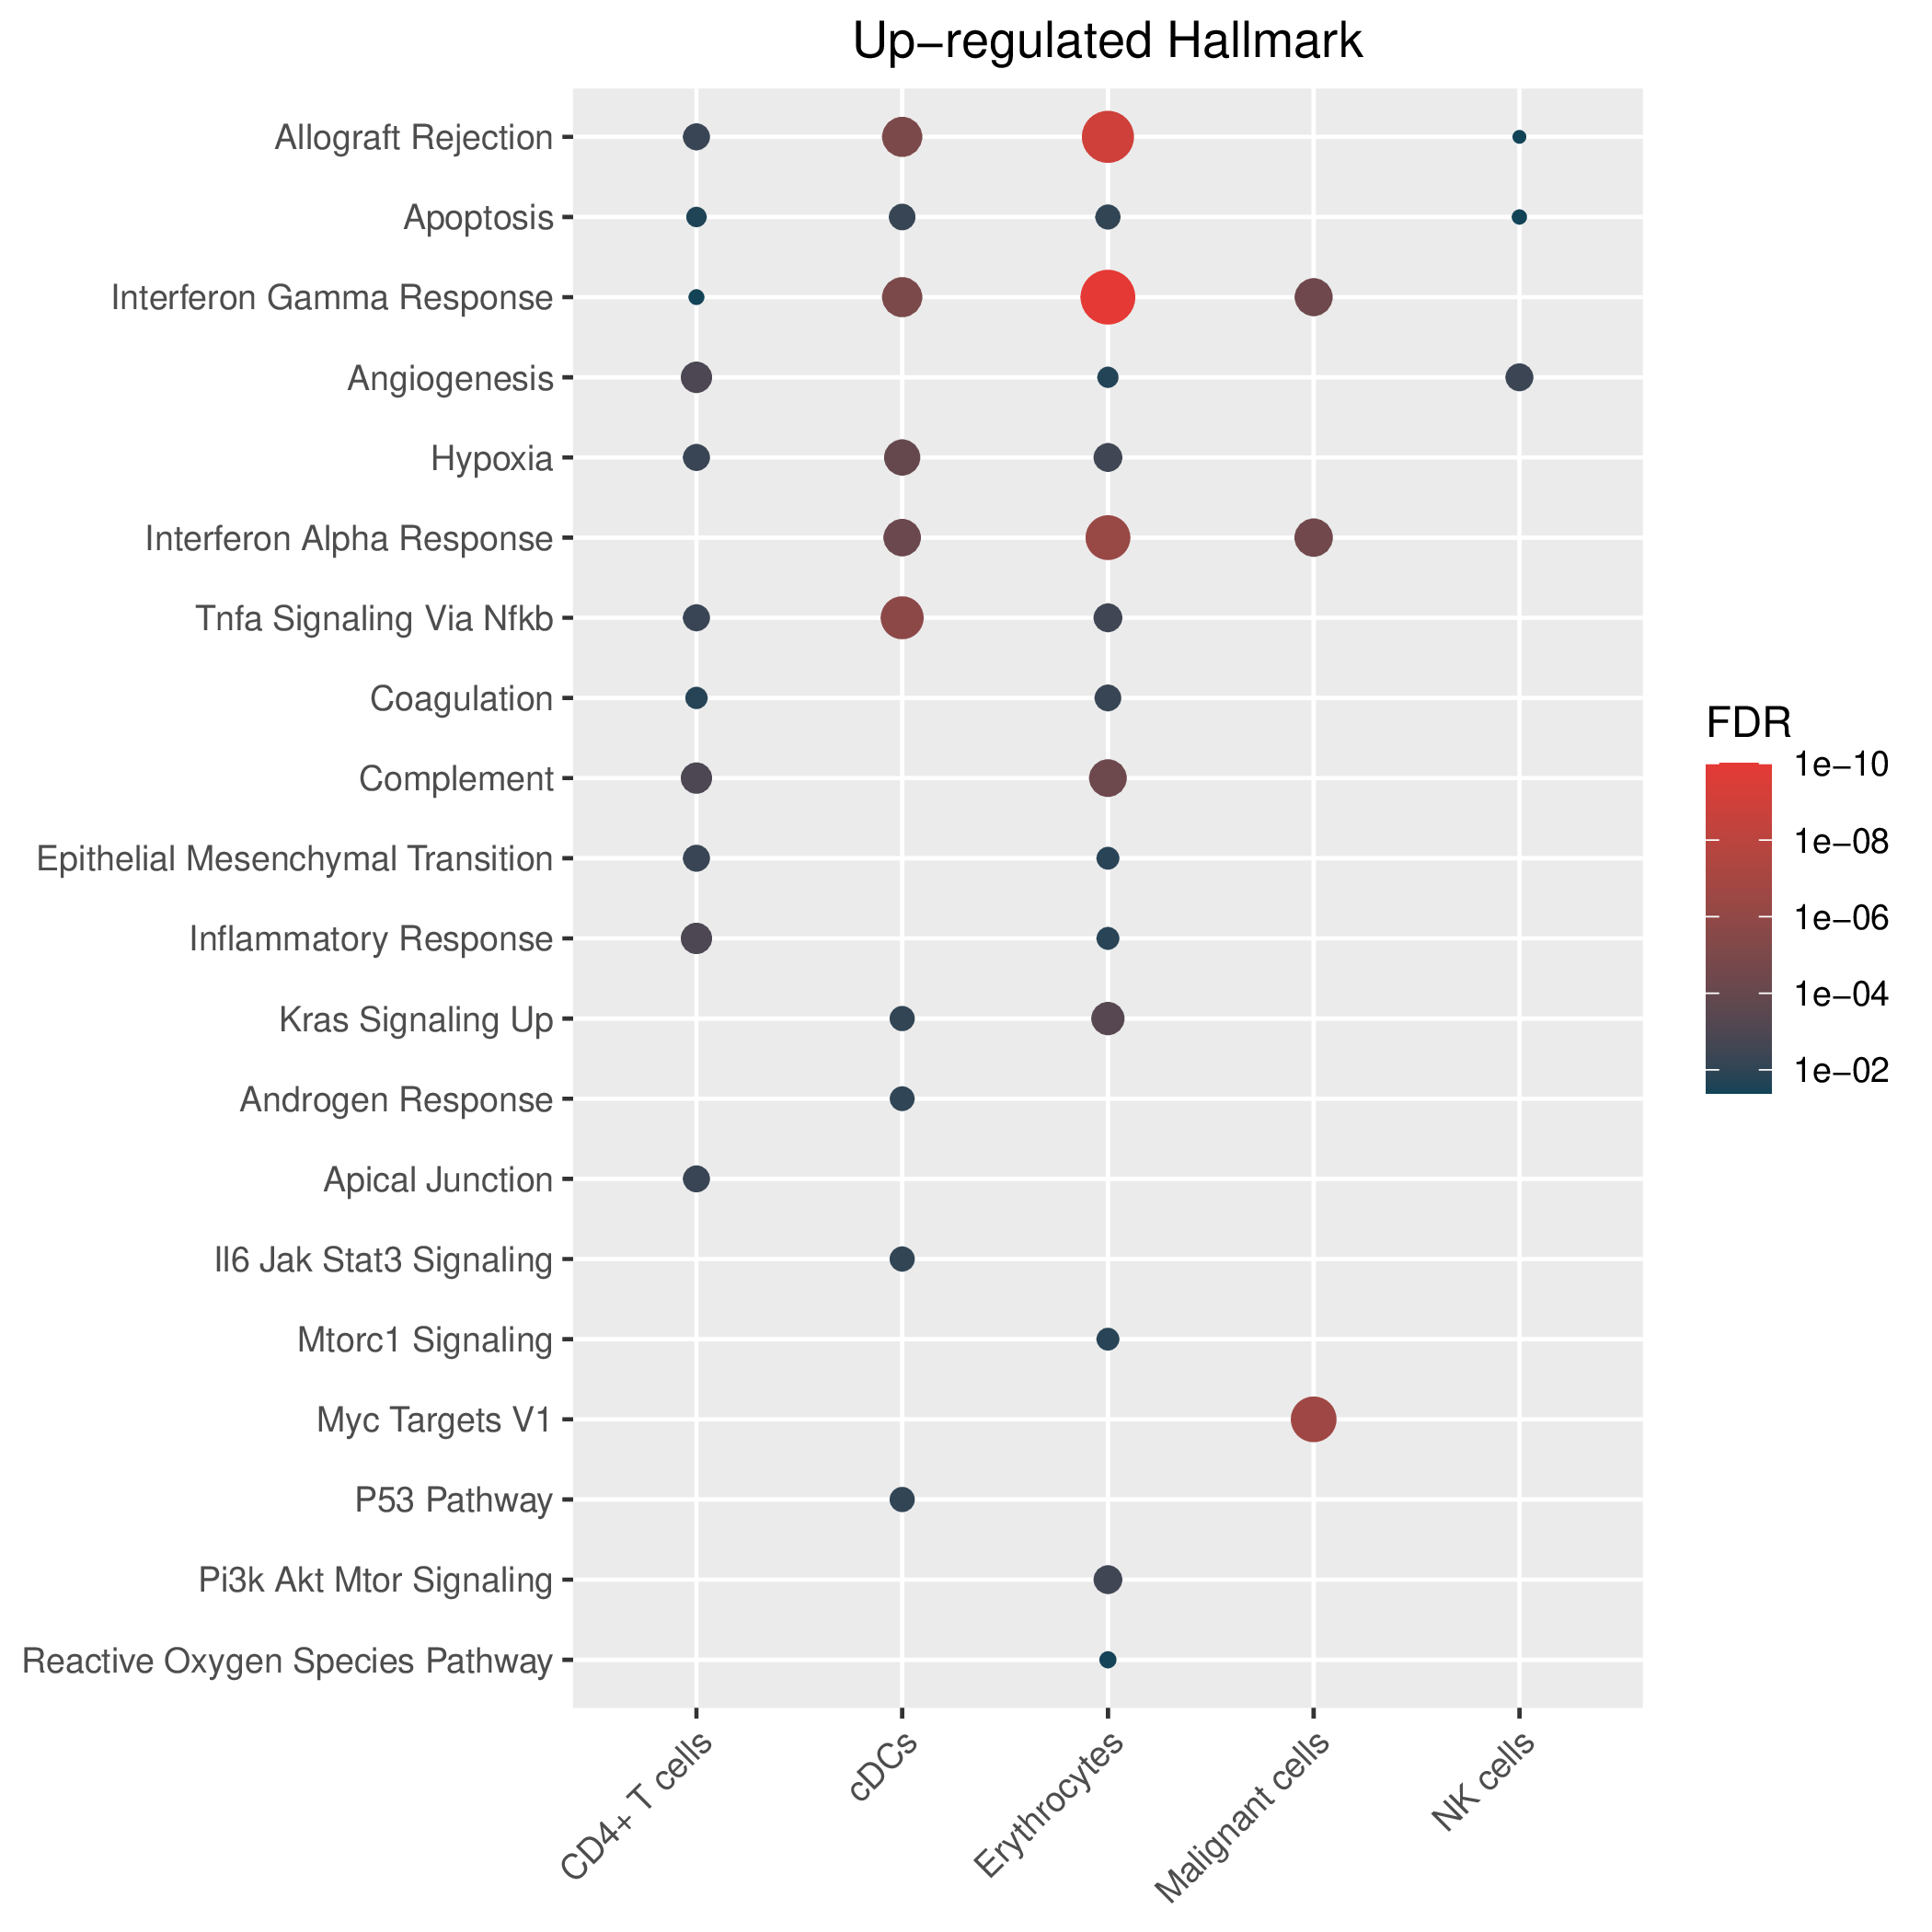
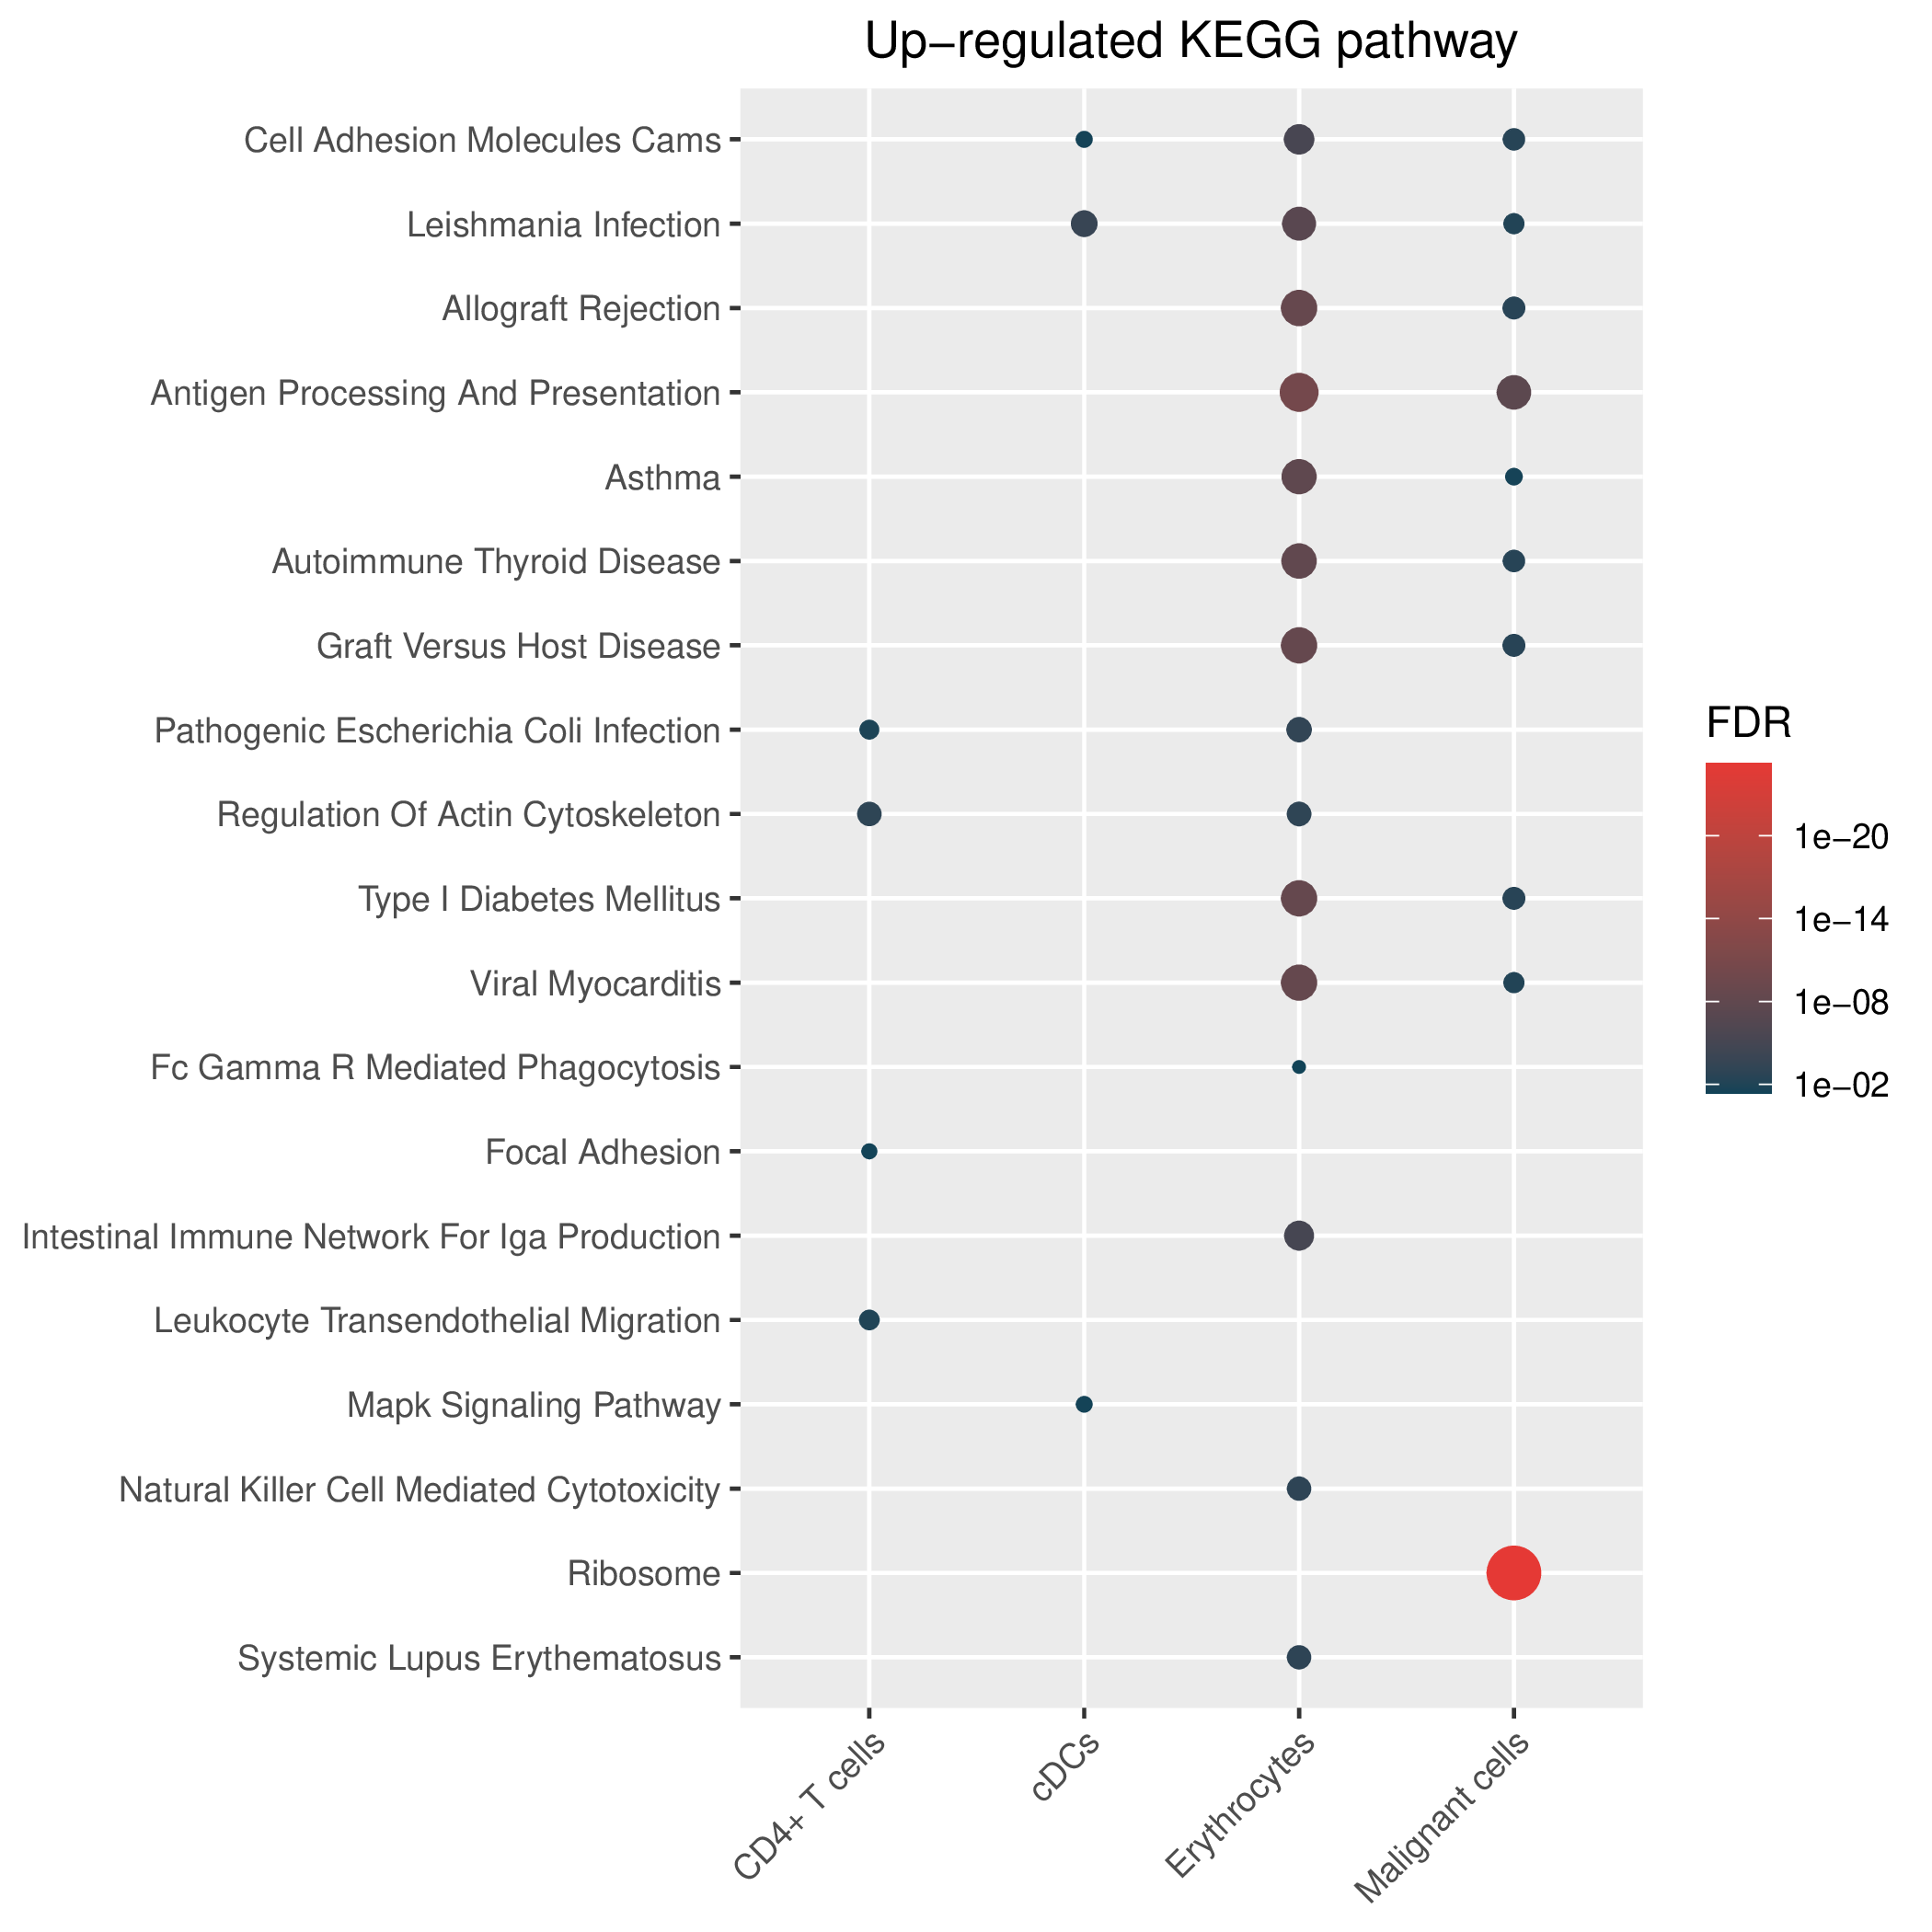
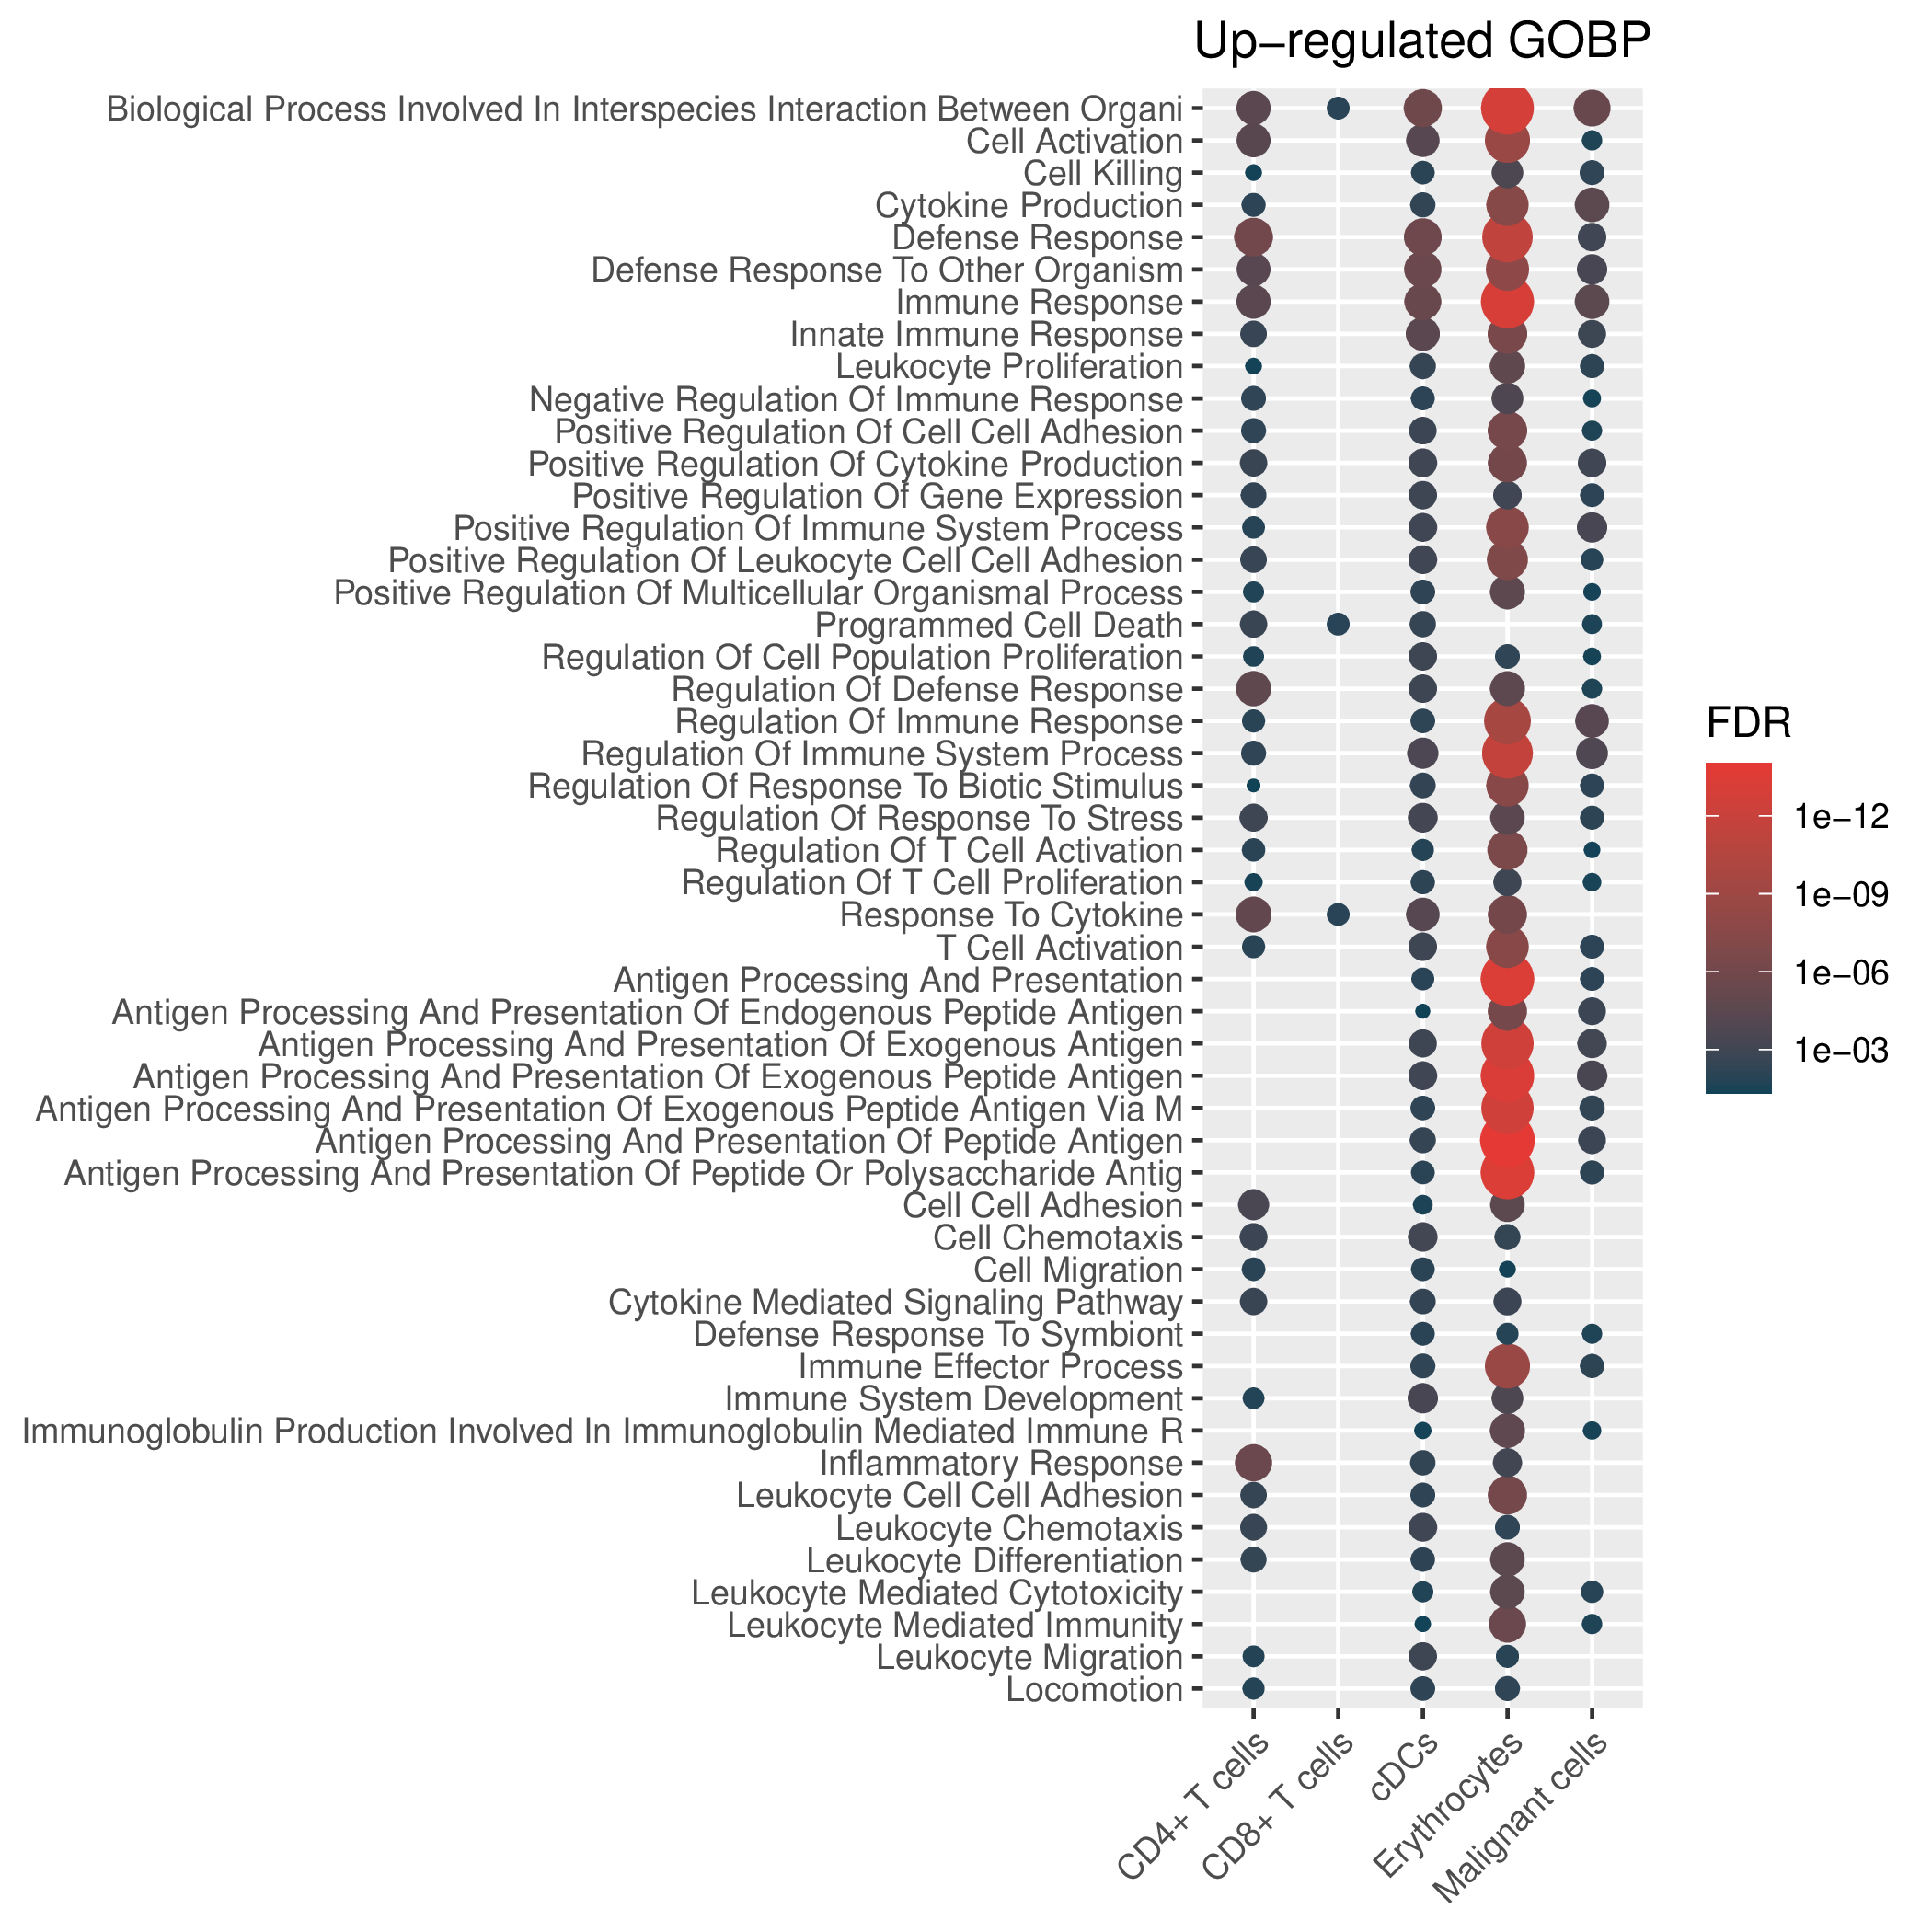
| Hallmark, KEGG and GOBP enrichment results for up-regulated genes in resistant group of pre-treatment samples. Only show the top 50 pathways with fdr<0.05. If certain cell types are not displayed, it means that there are no significant pathways based on DEGs in those cell types. (If the image exists, the user can click on it to enlarge it in a new window. Complete files can be downloaded from the download section.) |
| Up-regulated Hallmark | Up-regulated KEGG | Up-regulated GO BP |
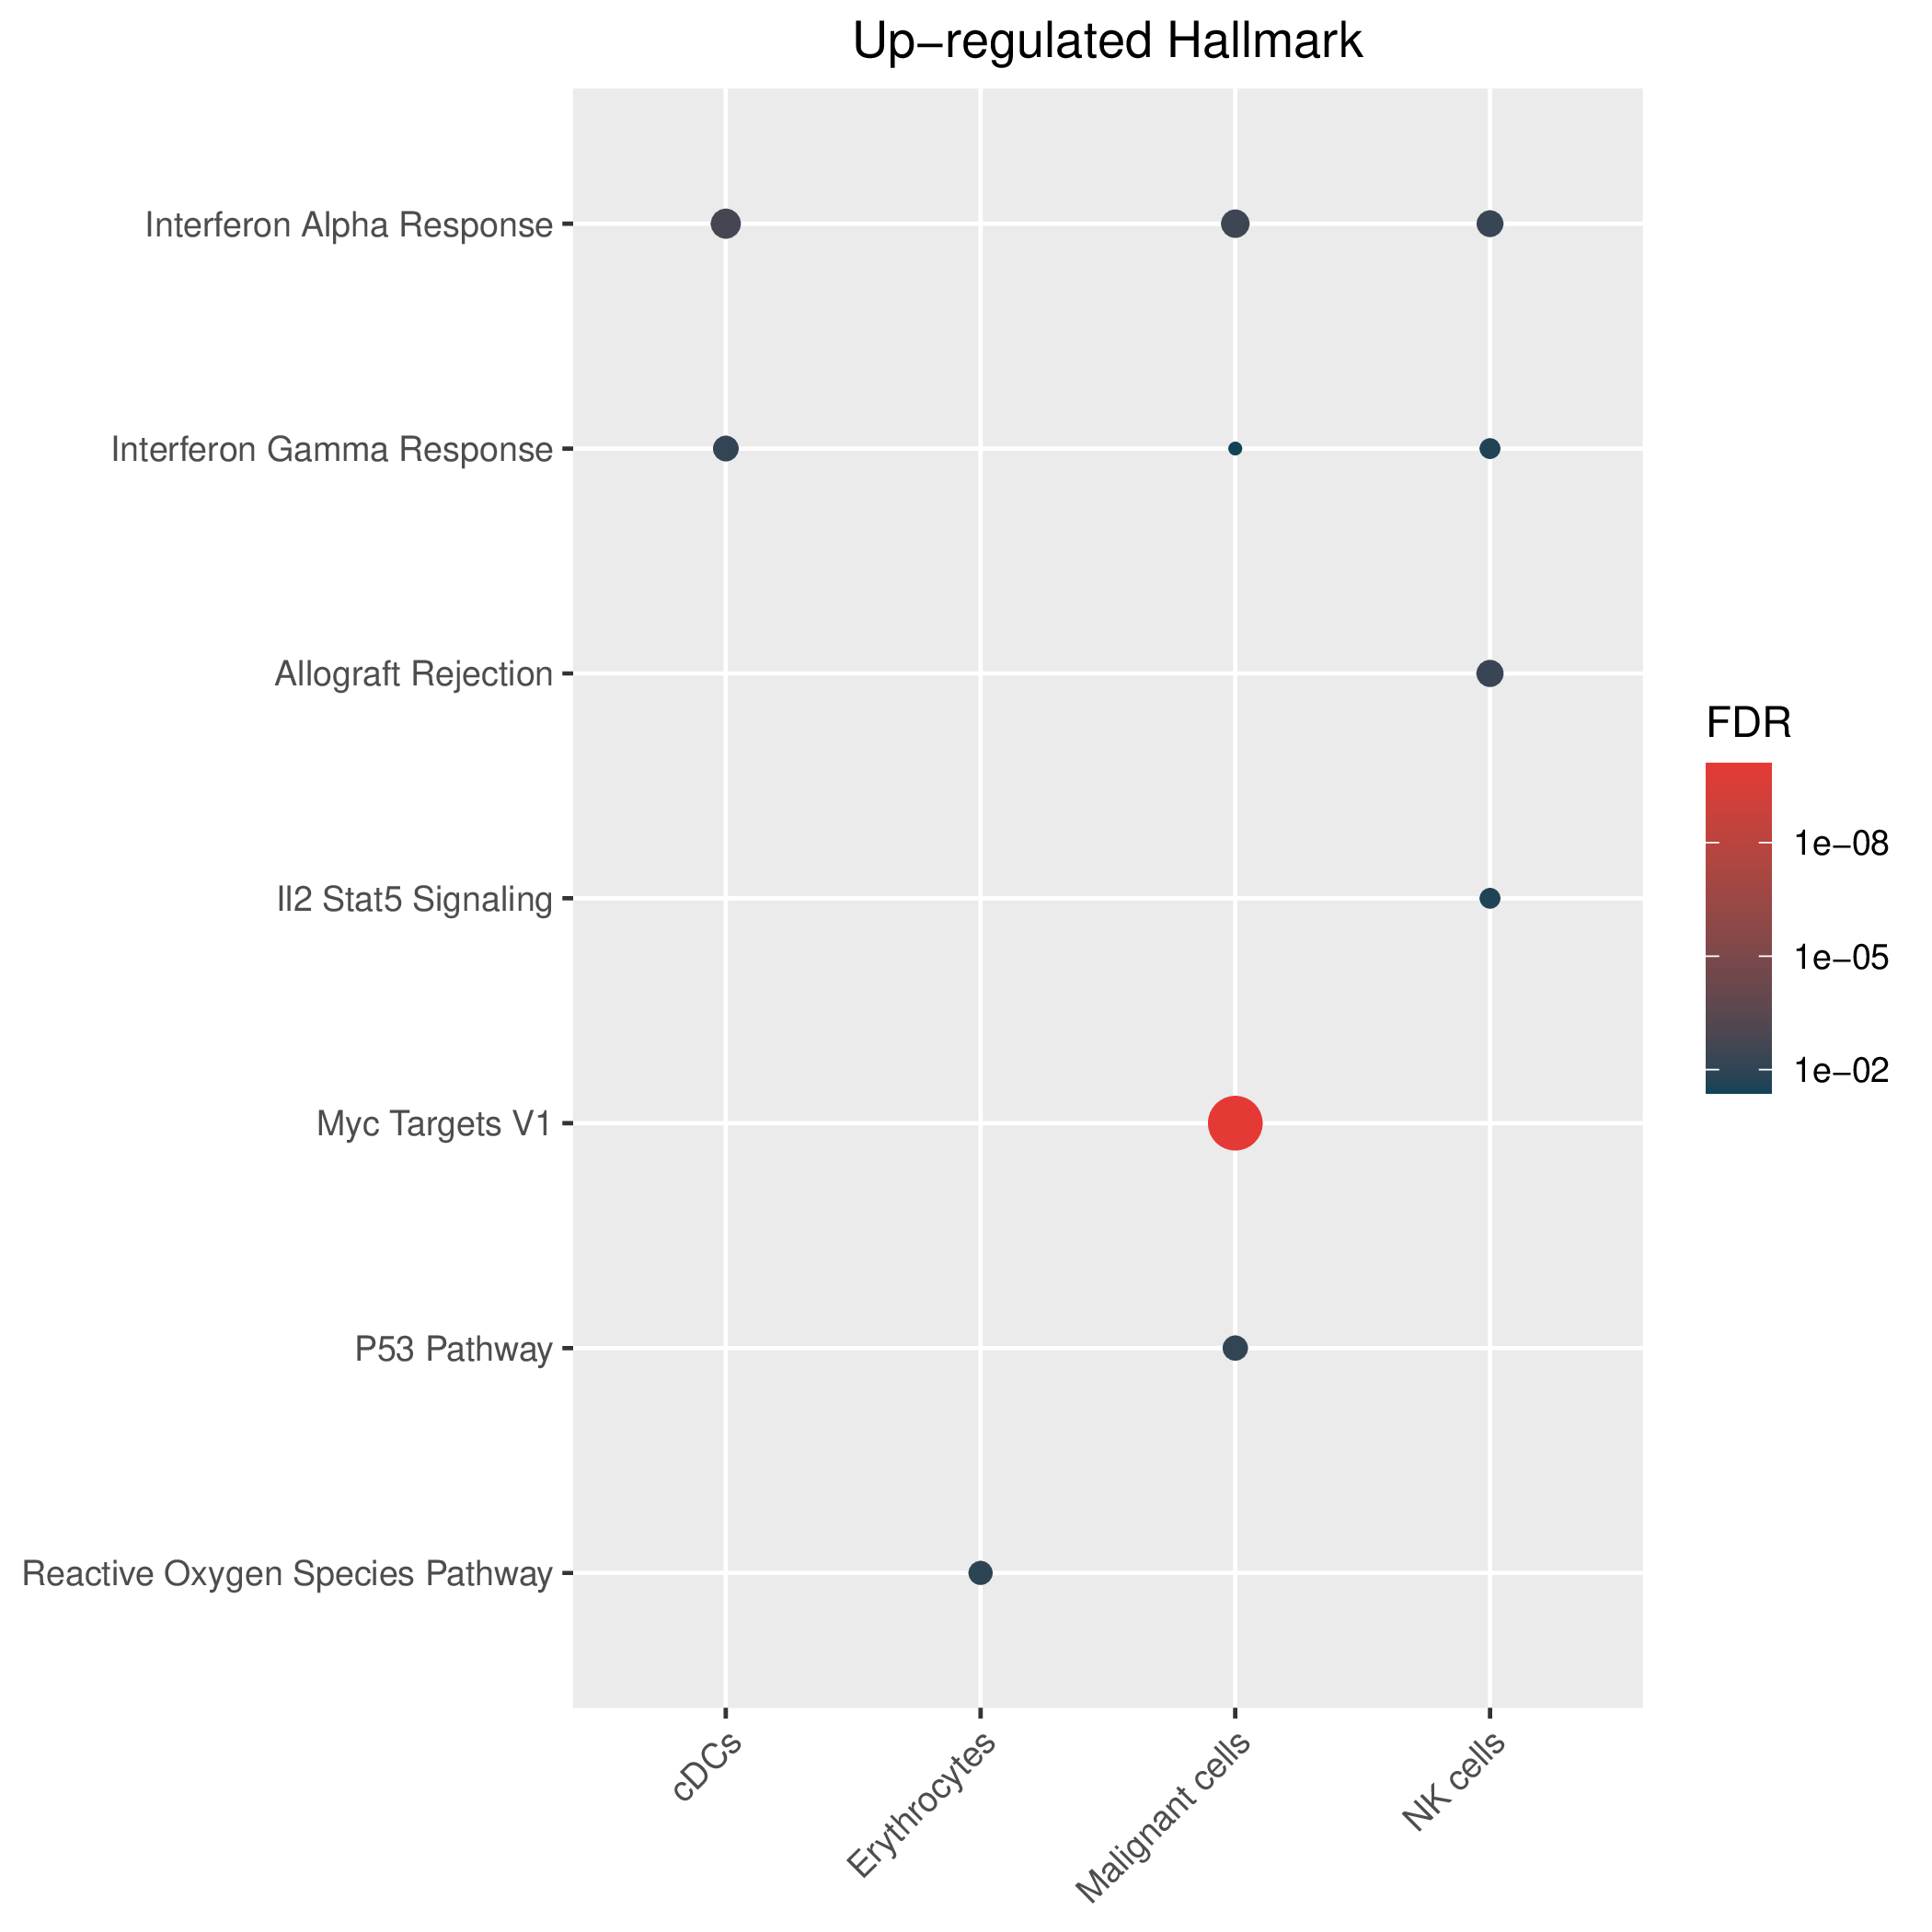 | 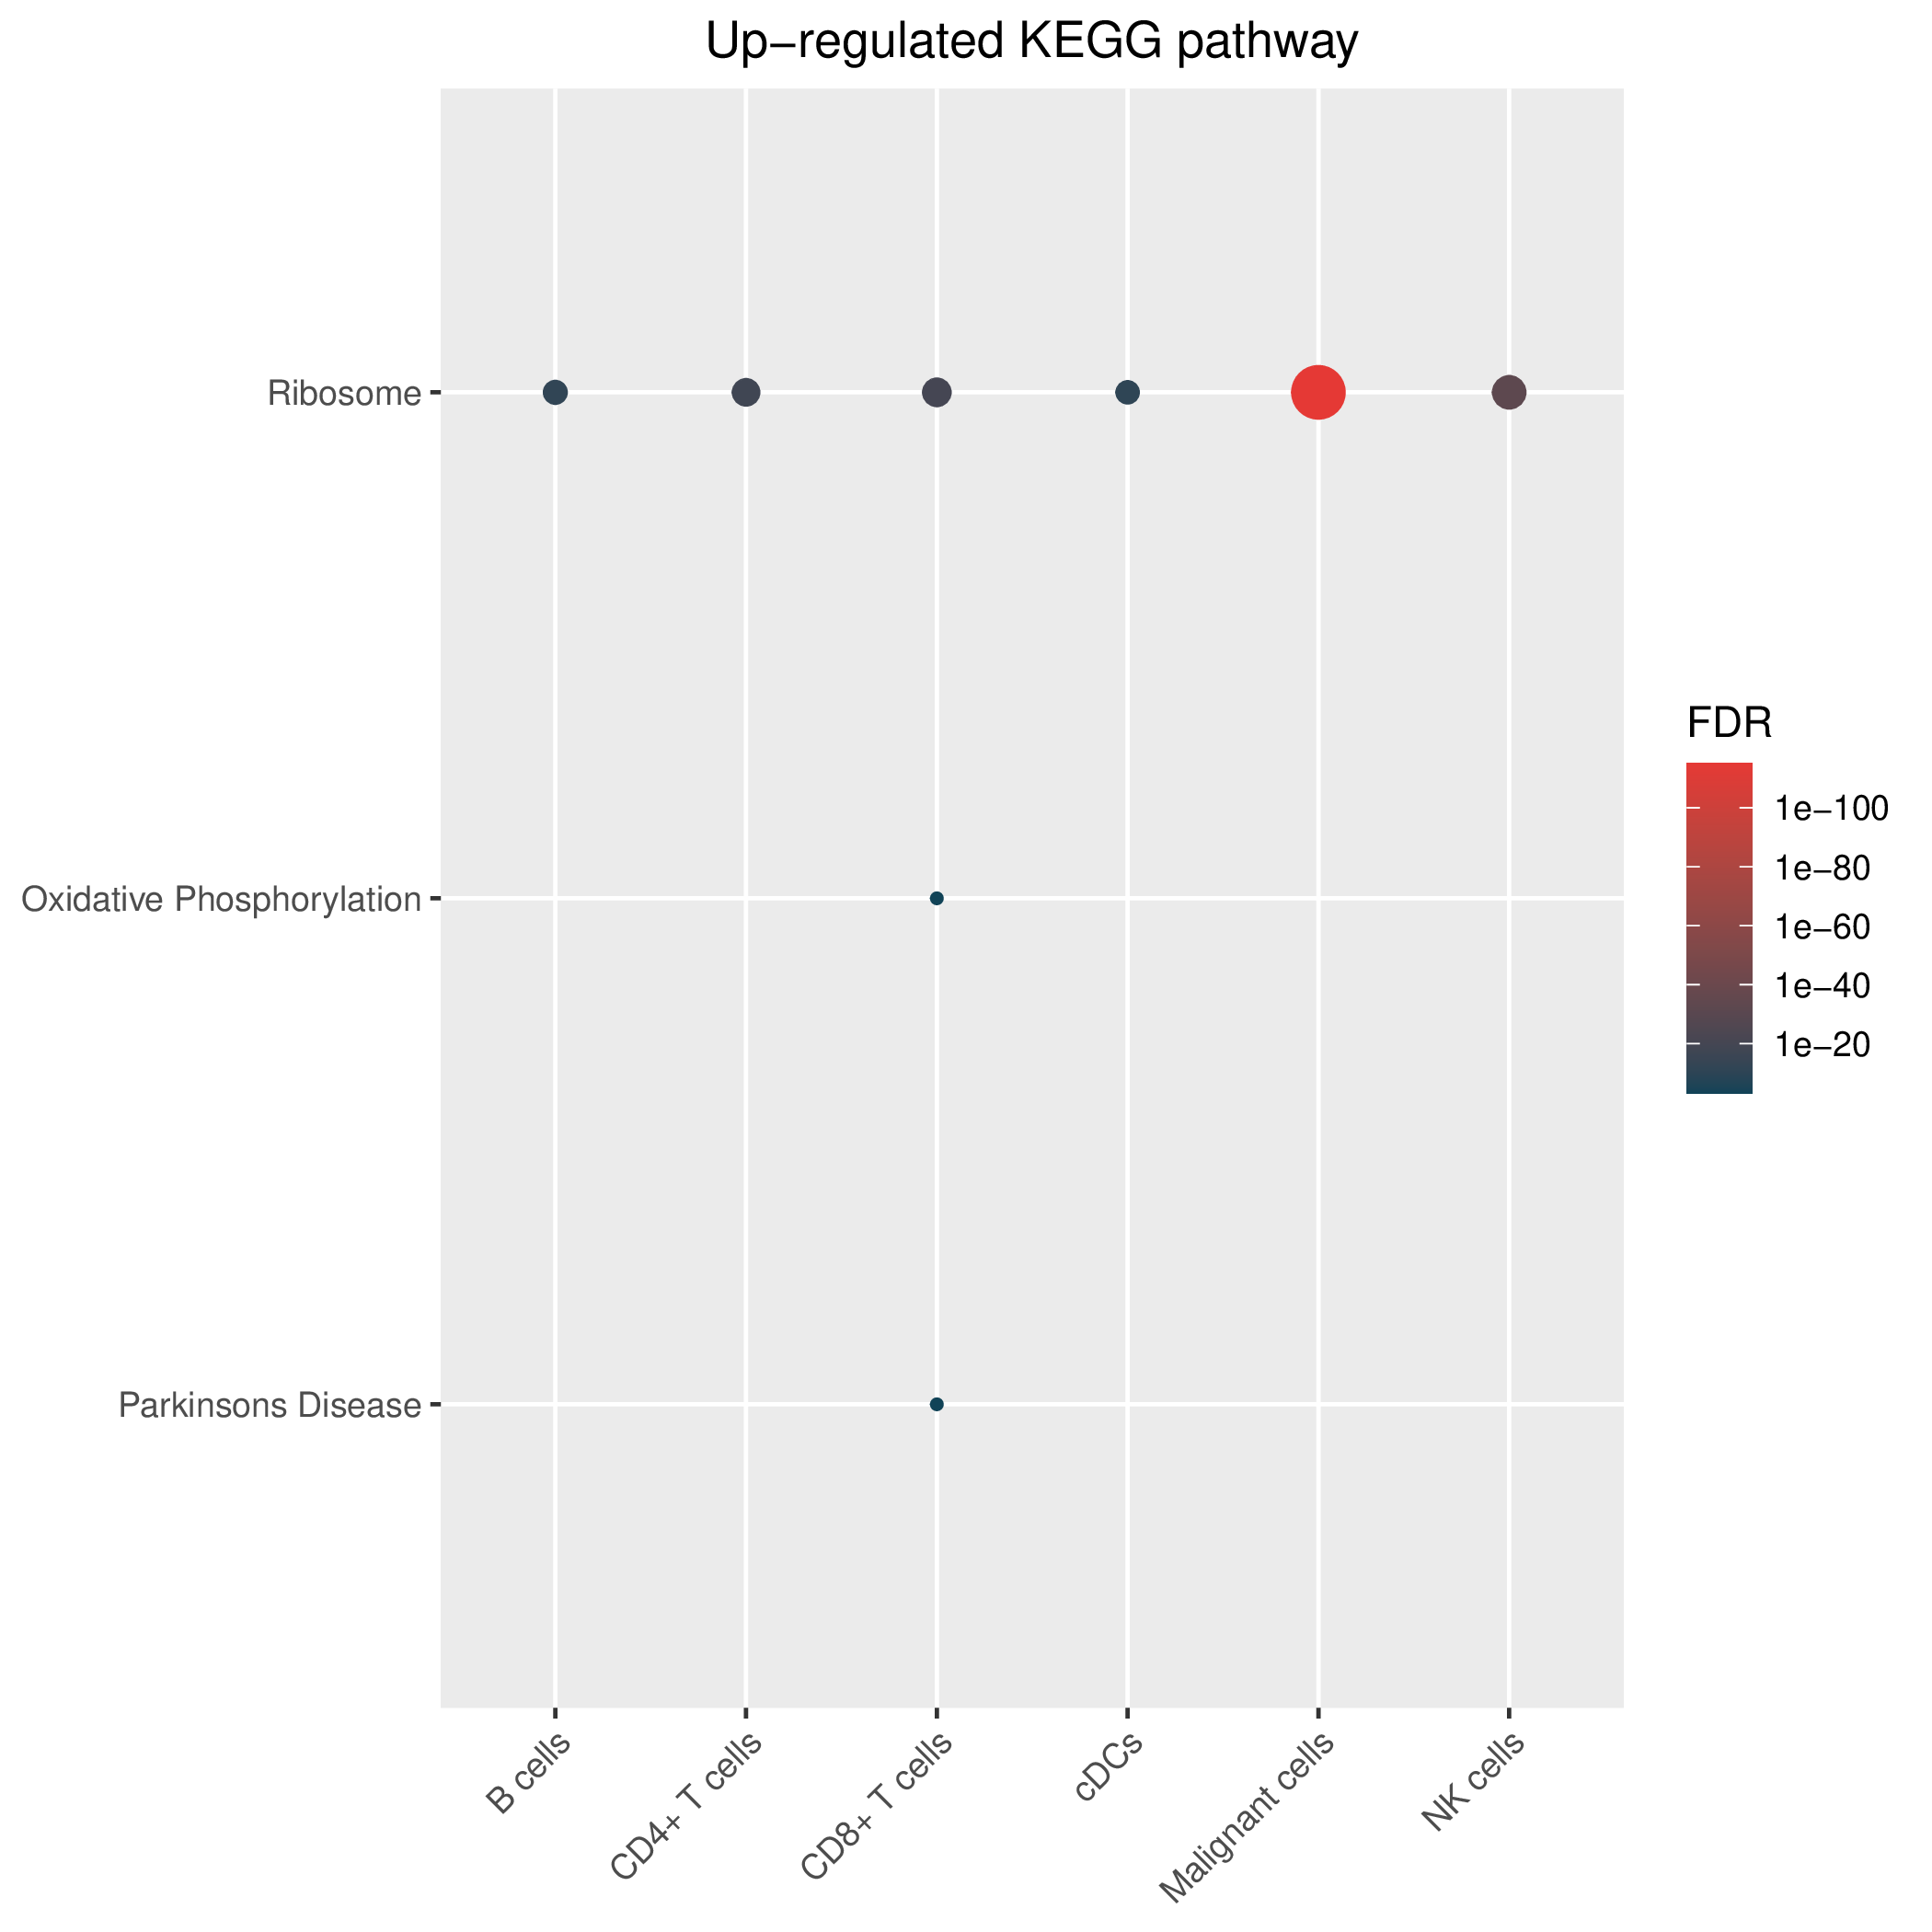 | 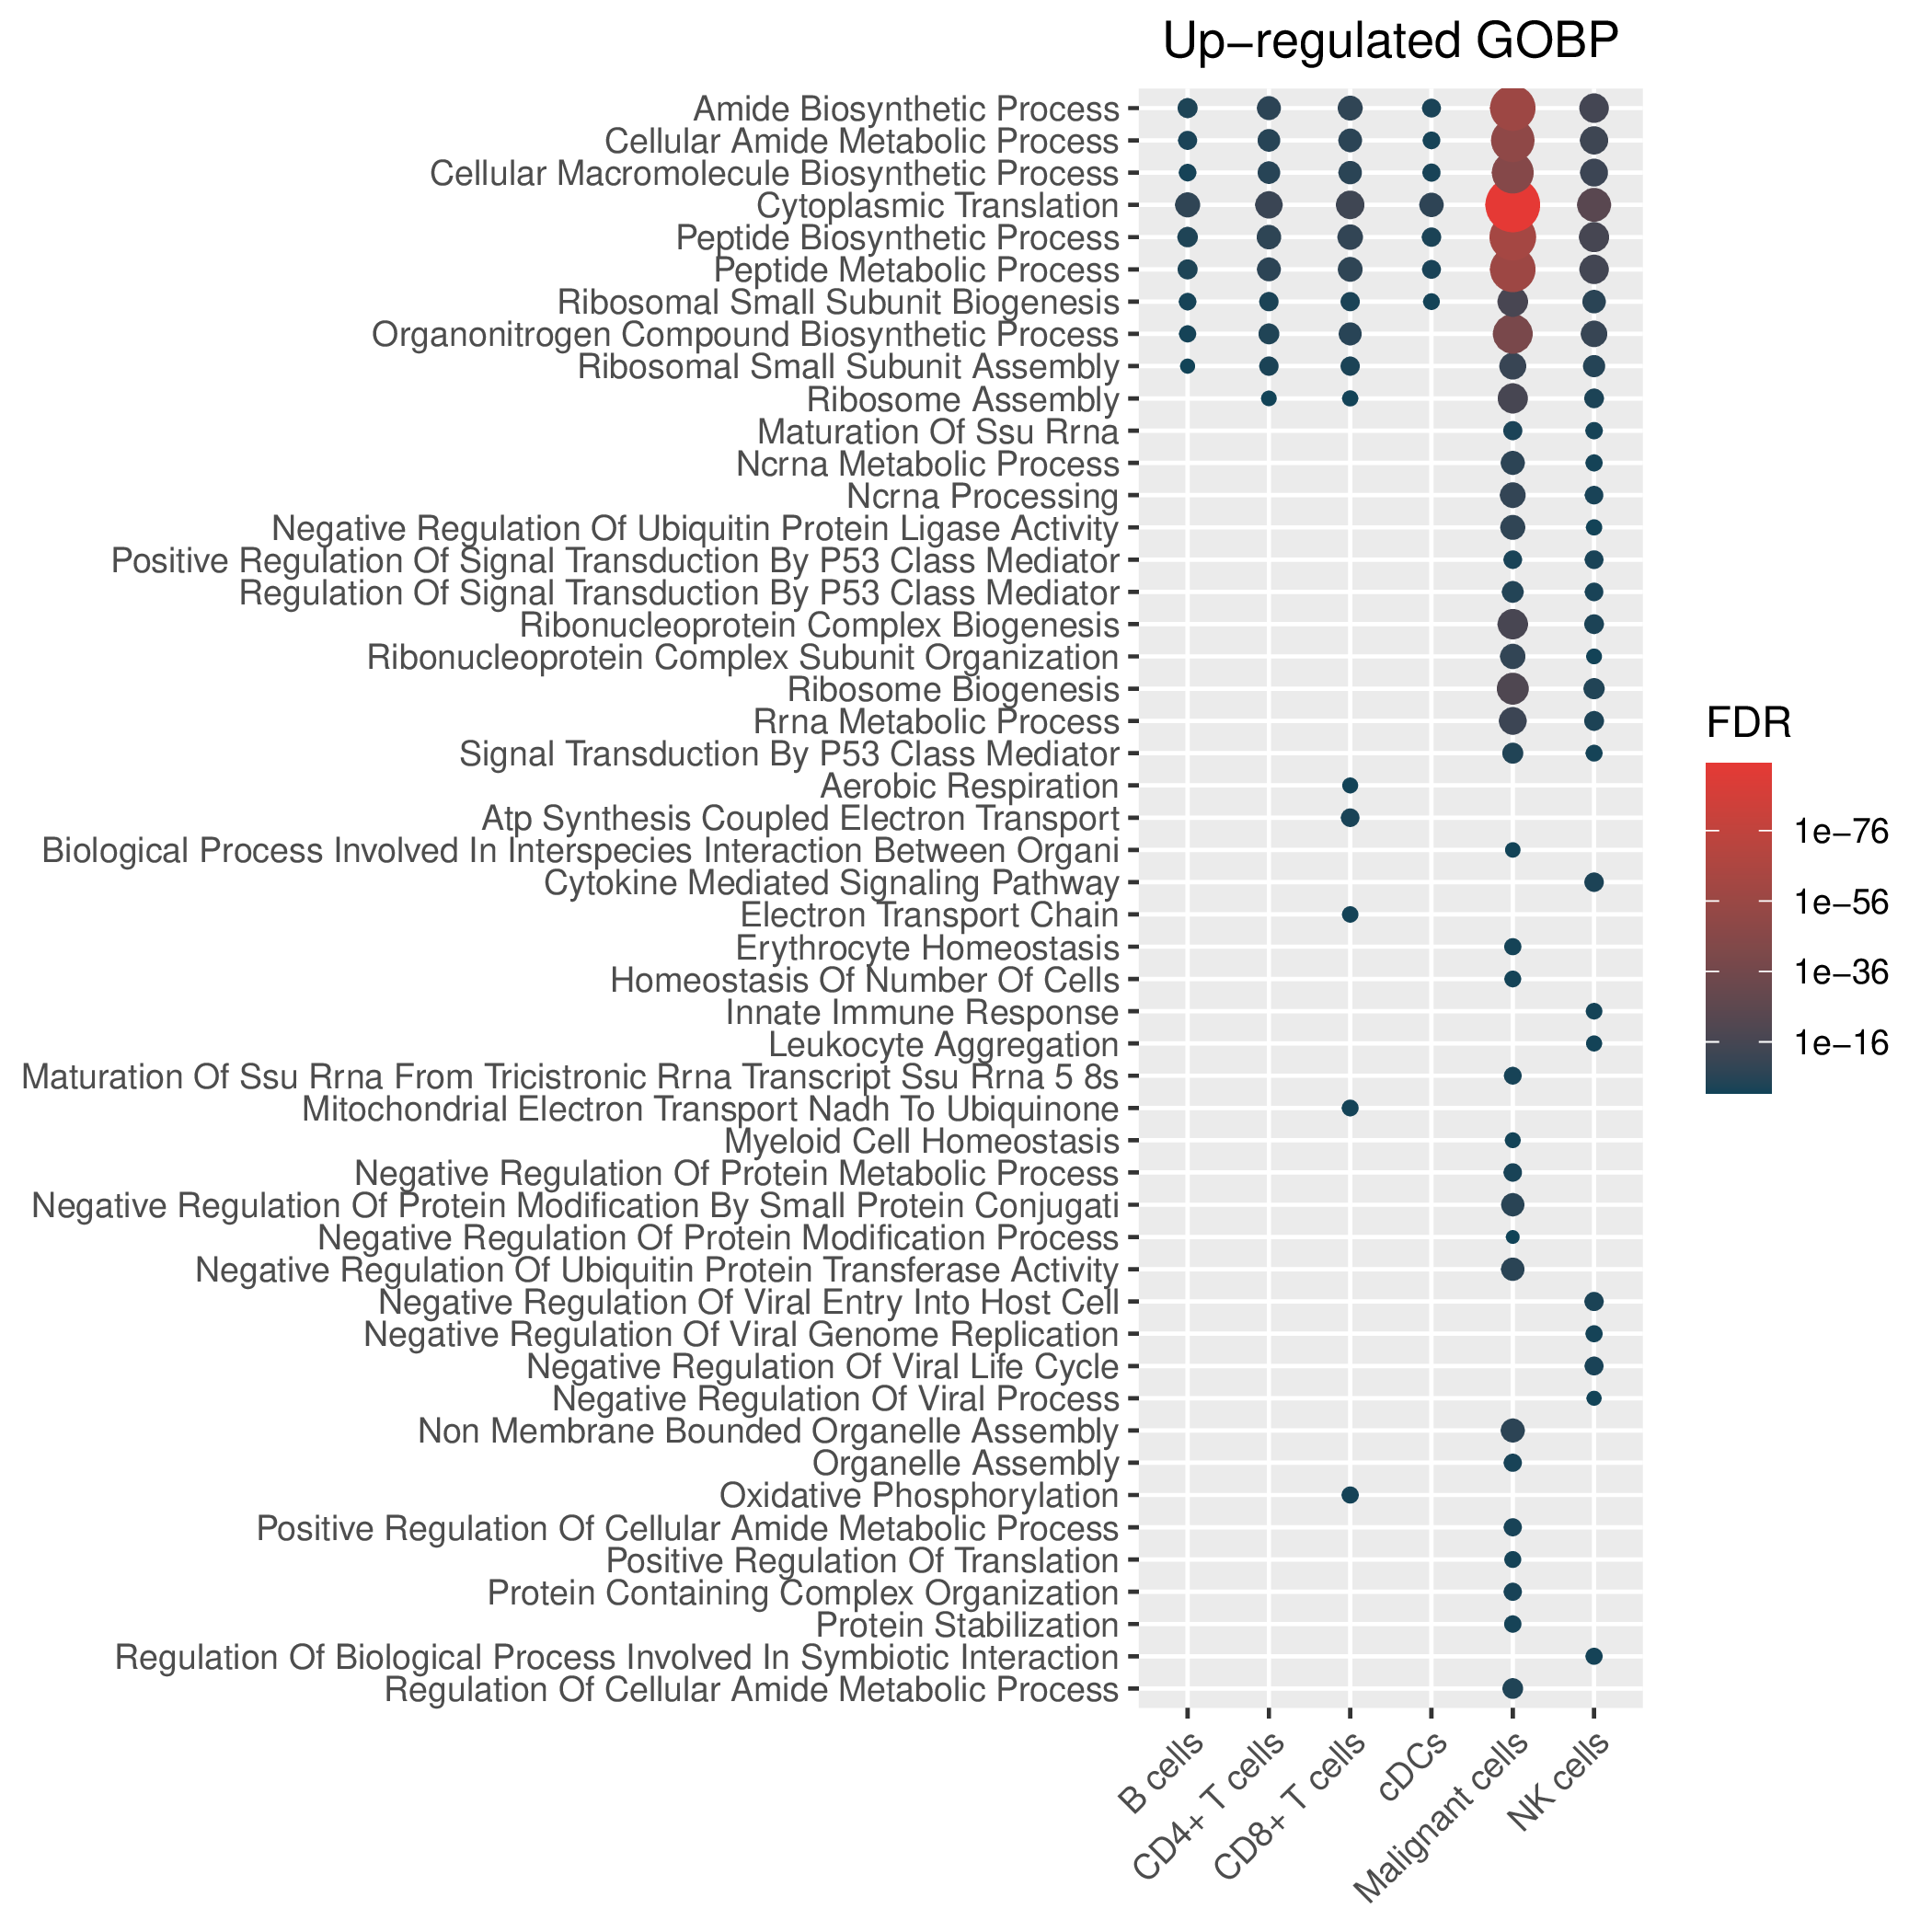 |
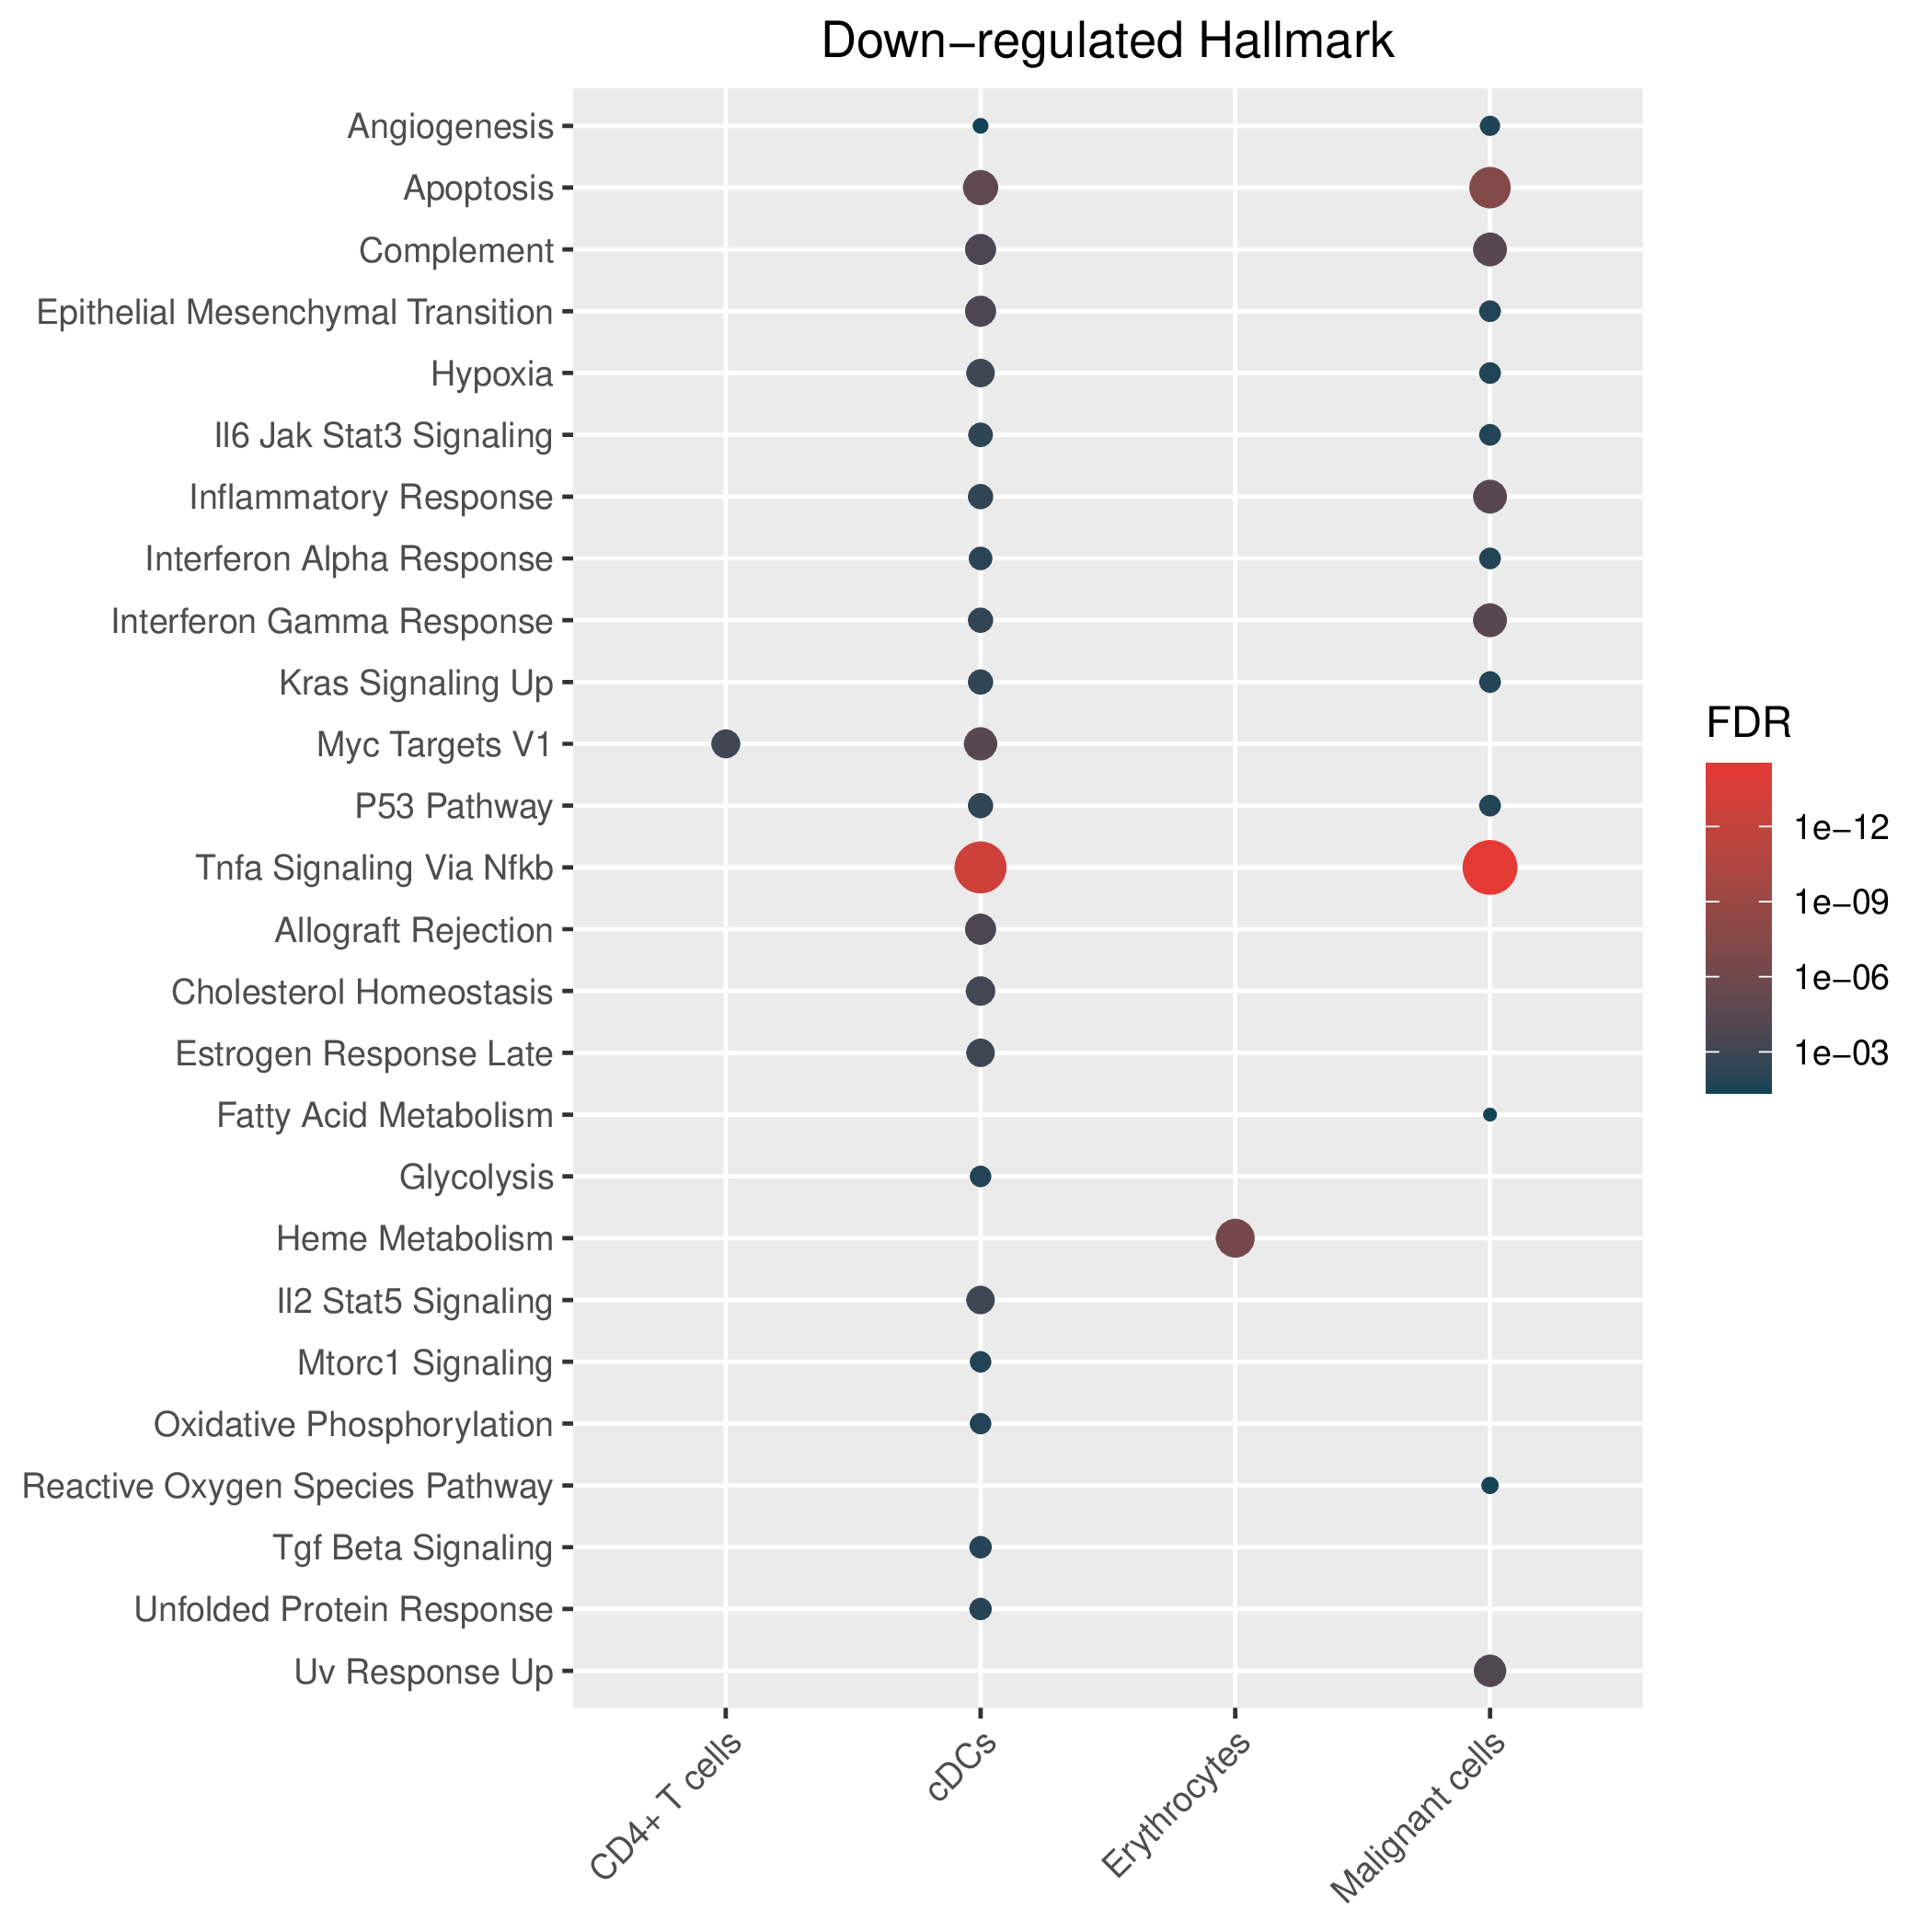
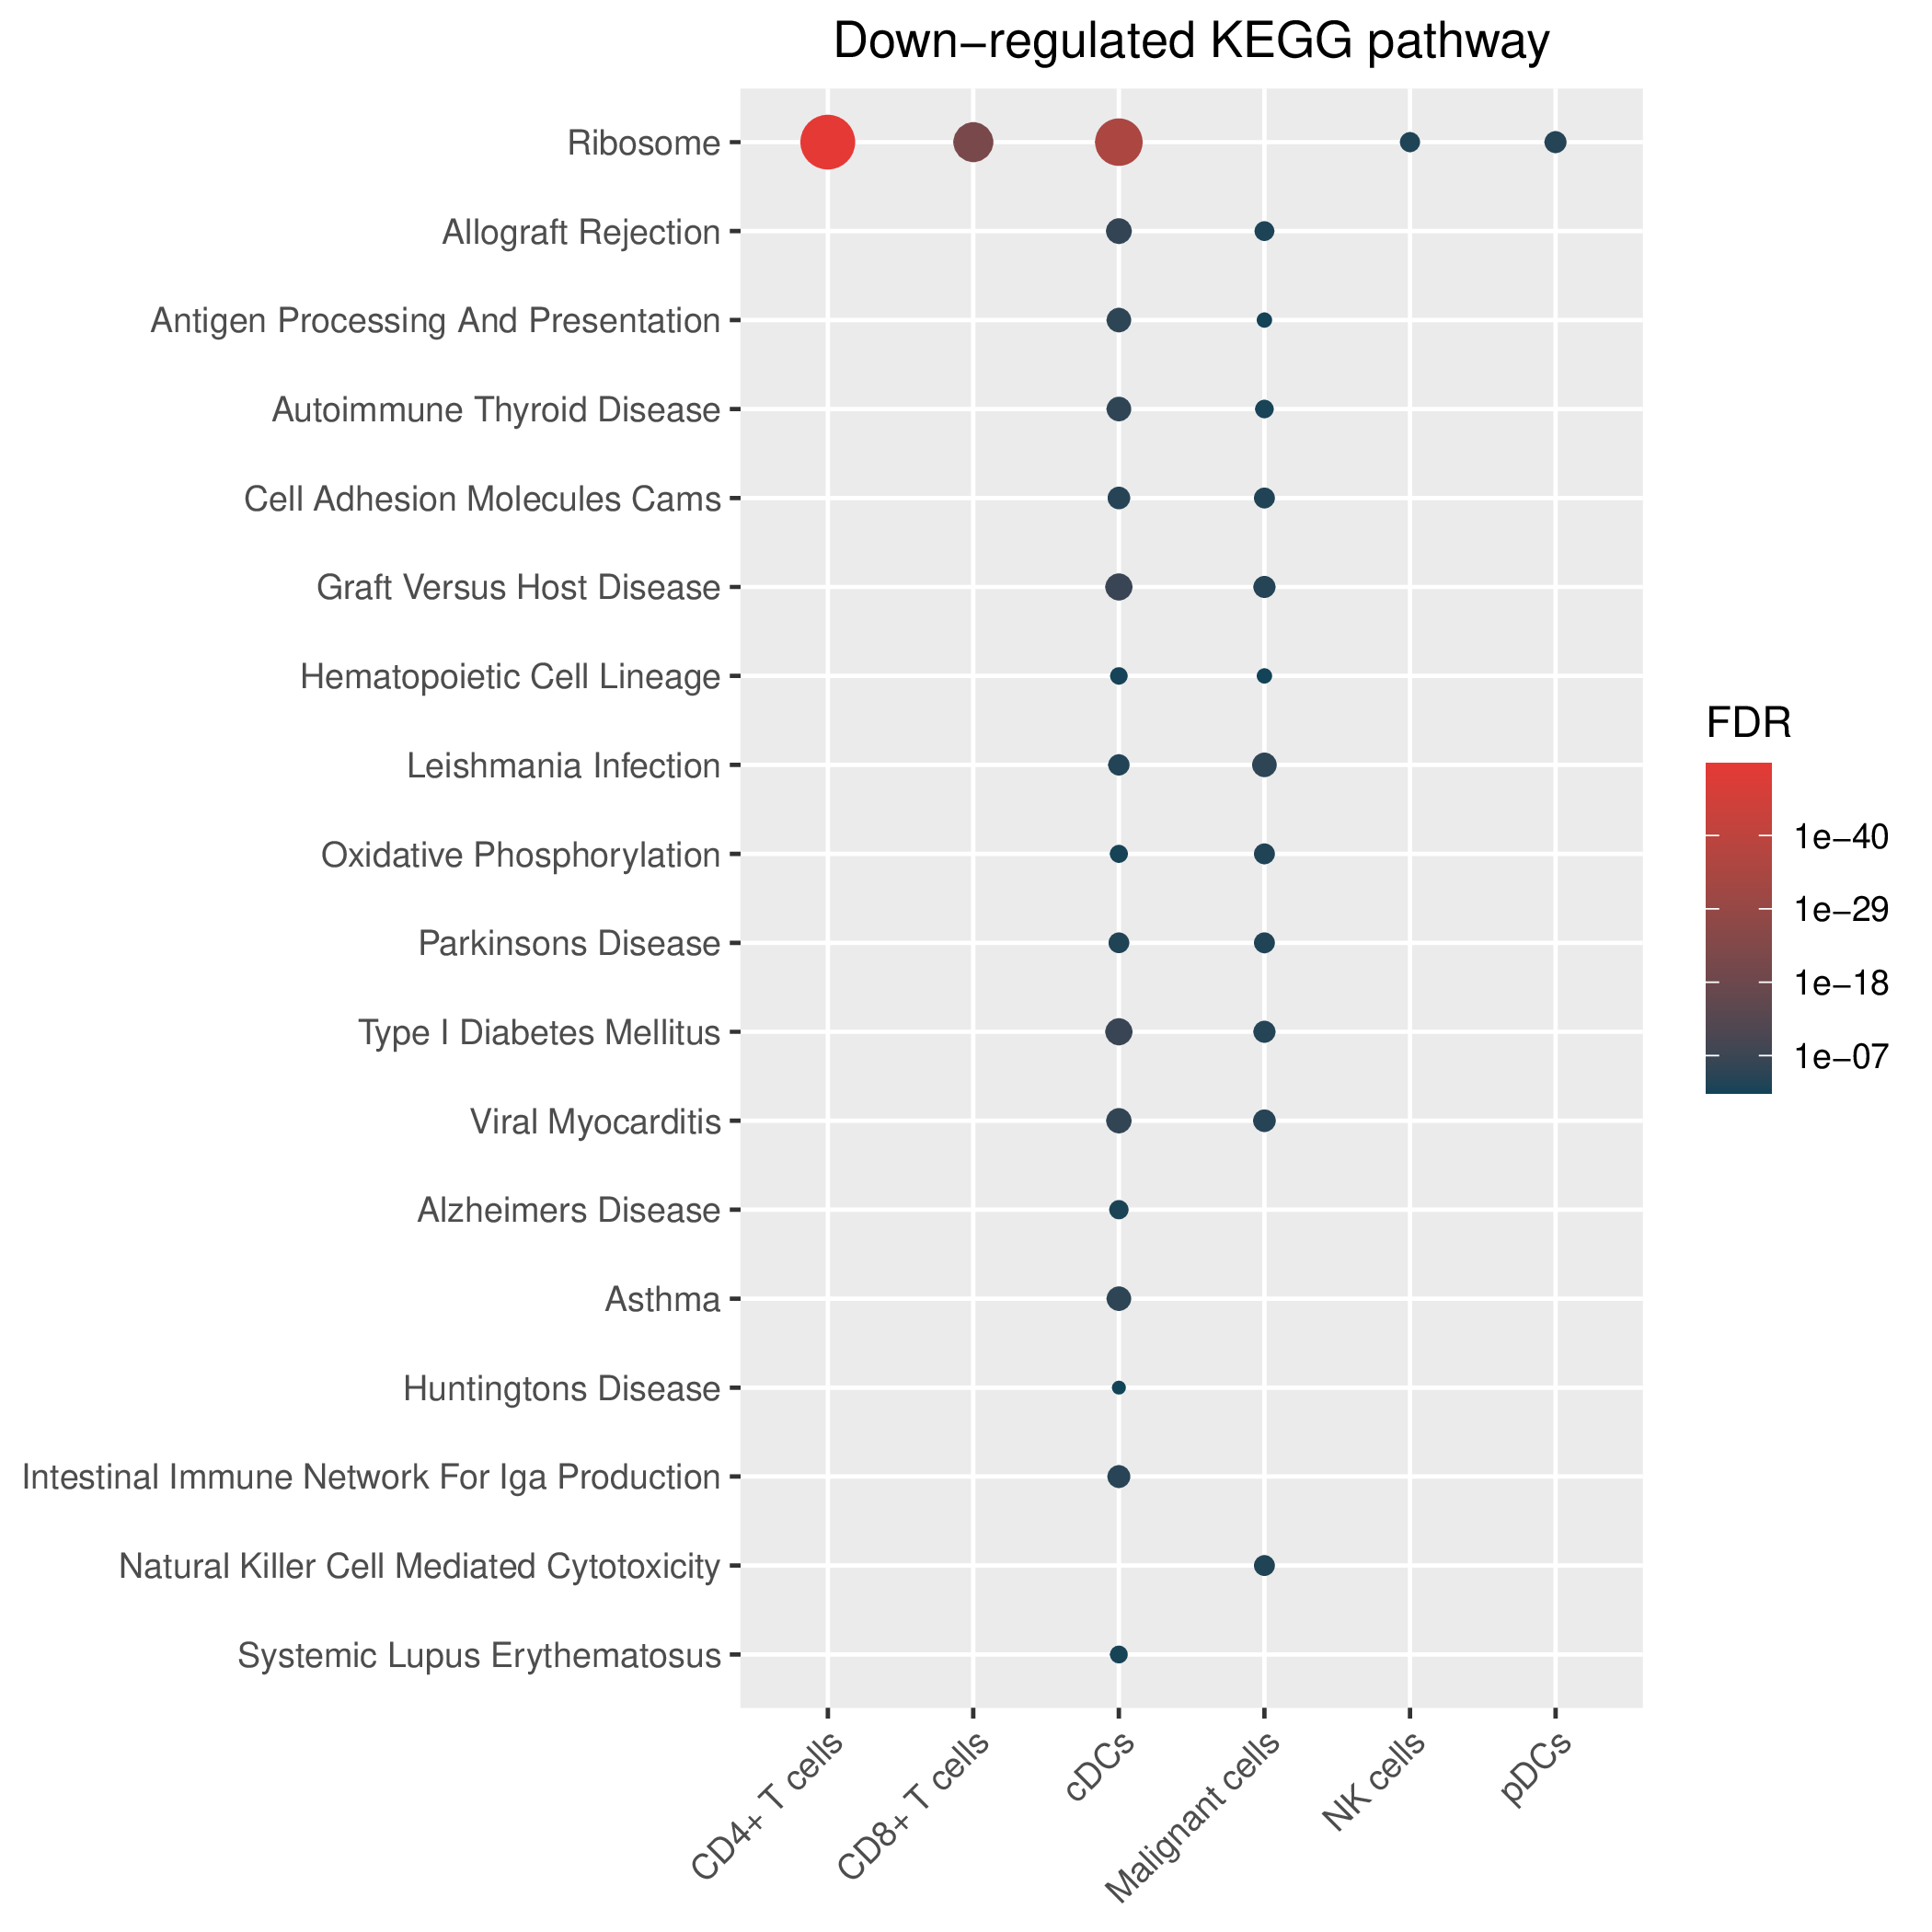
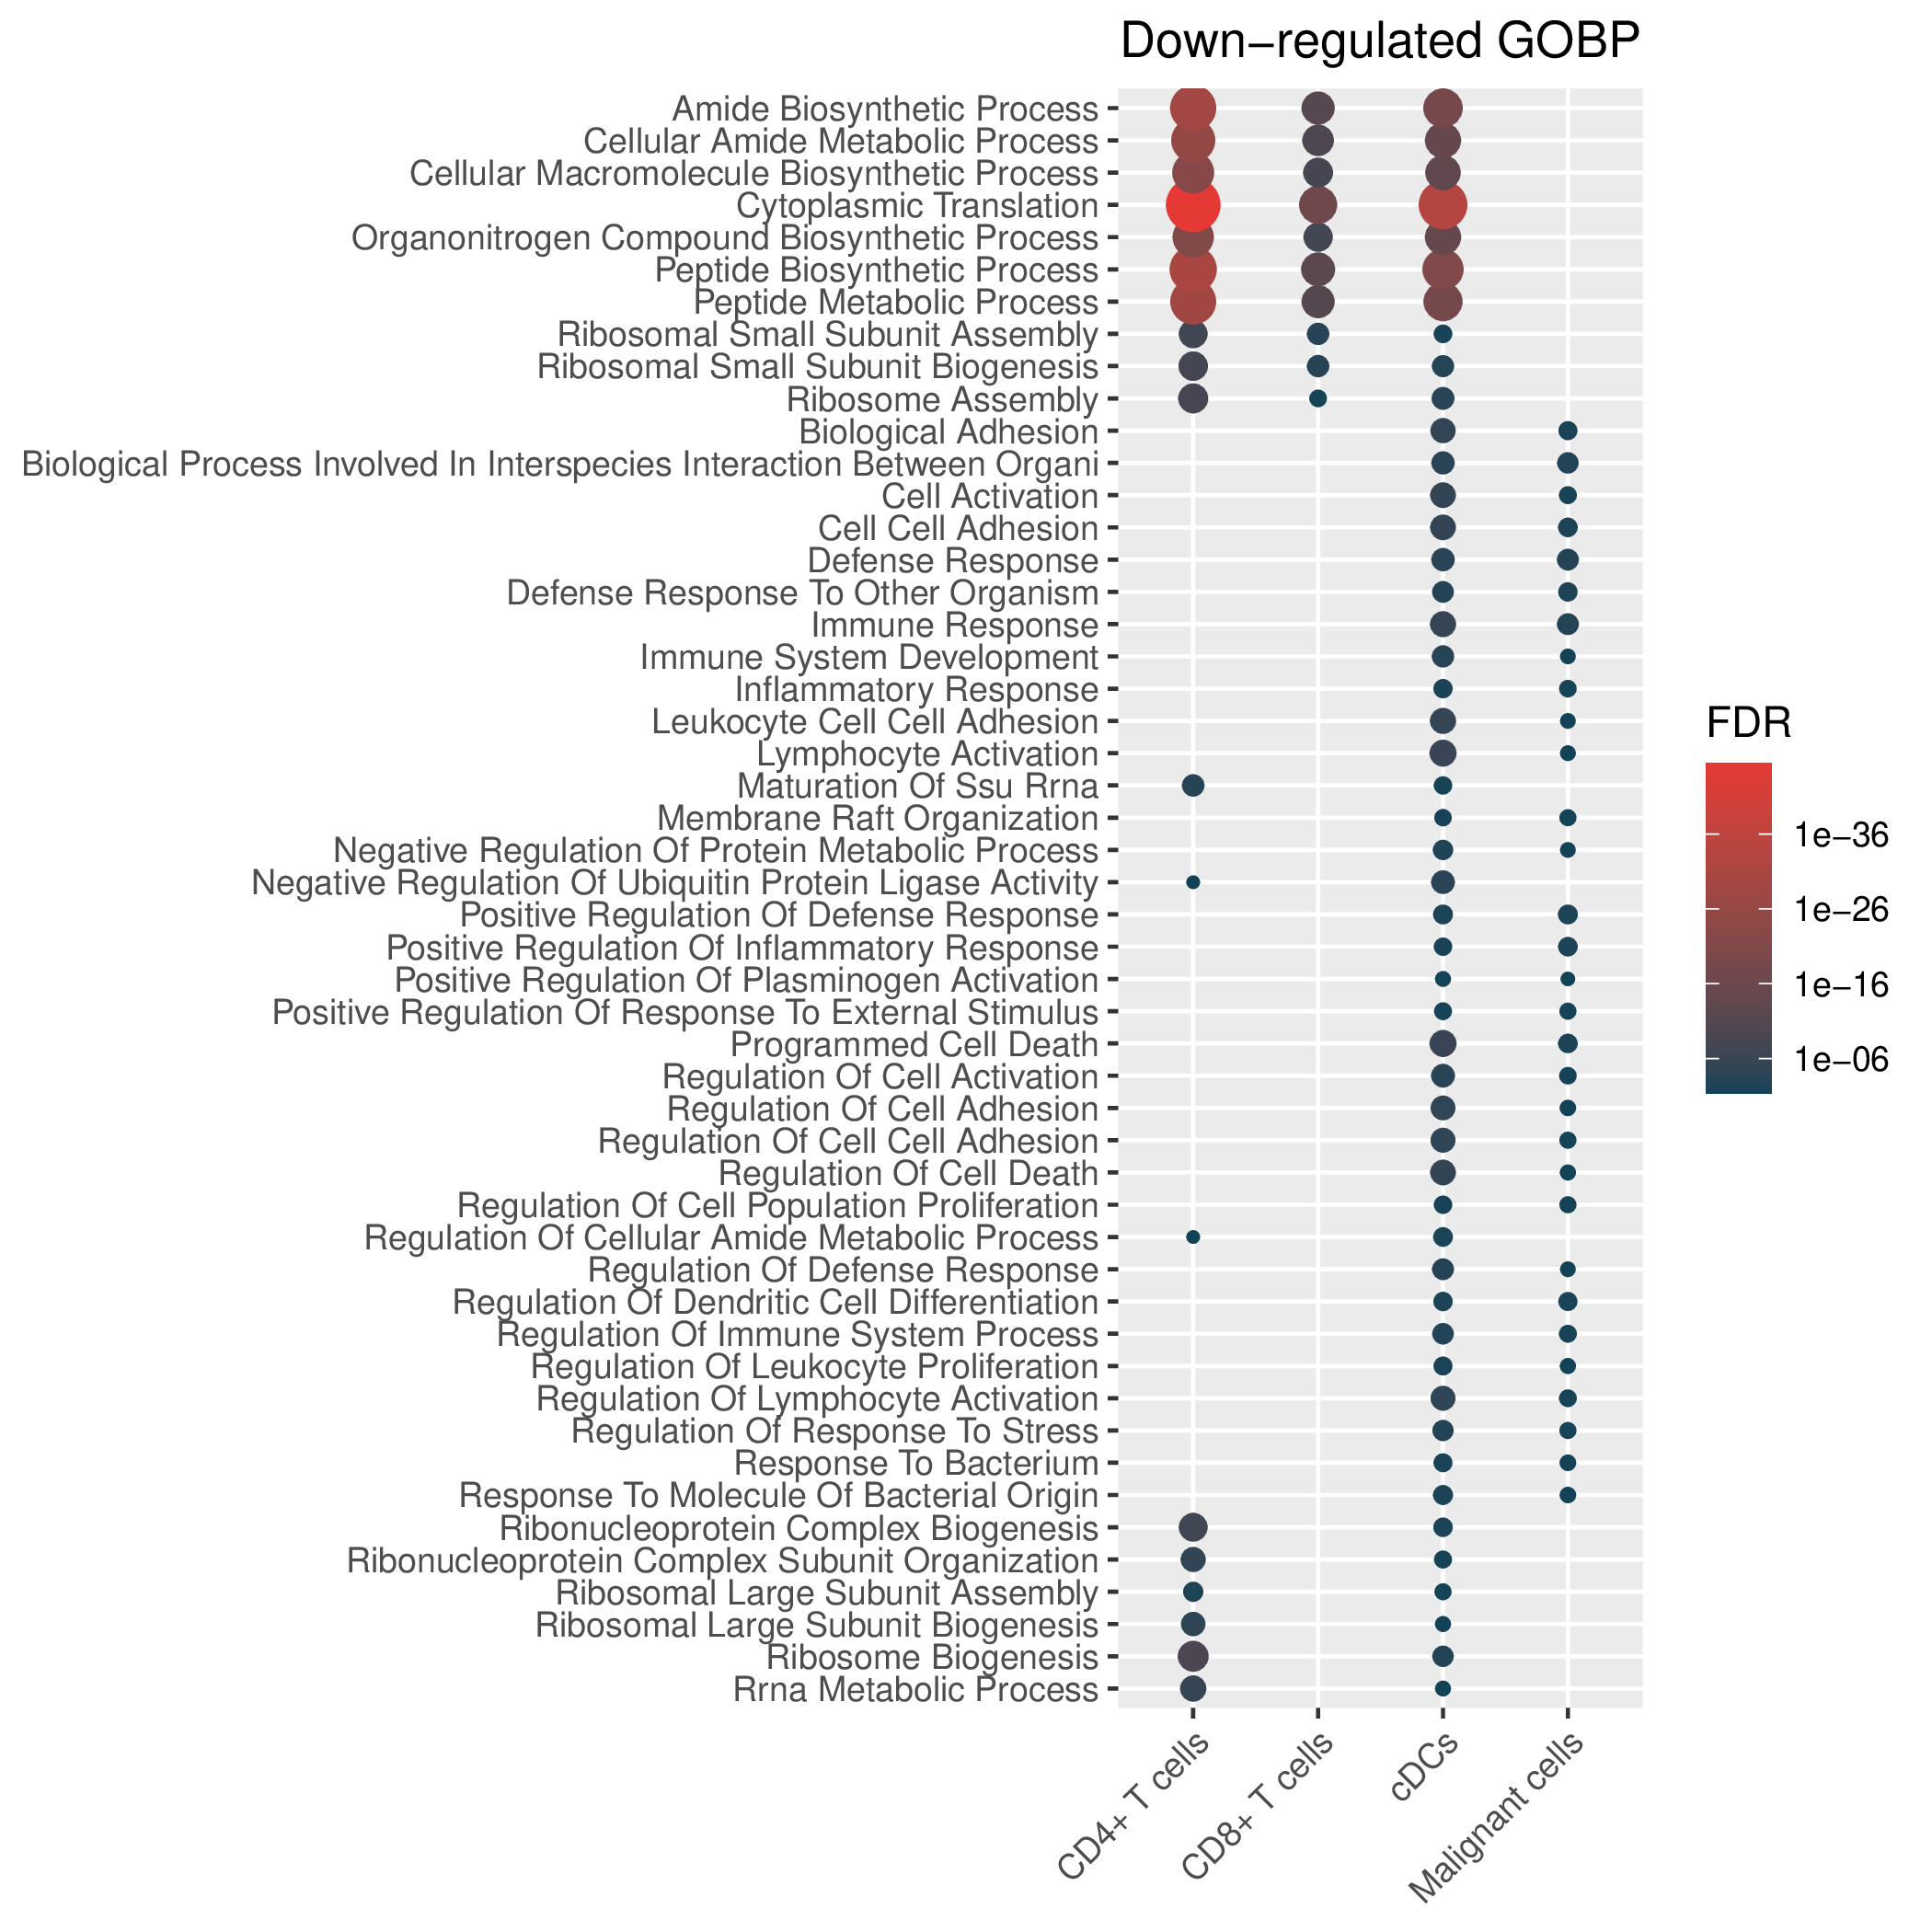
| Hallmark, KEGG and GOBP enrichment results for down-regulated genes in resistant group of pre-treatment samples. Only show the top 50 pathways with fdr<0.05. If certain cell types are not displayed, it means that there are no significant pathways based on DEGs in those cell types. (If the image exists, the user can click on it to enlarge it in a new window.Complete files can be downloaded from the download section.) |
| Down-regulated Hallmark | Down-regulated KEGG | Down-regulated GO BP |
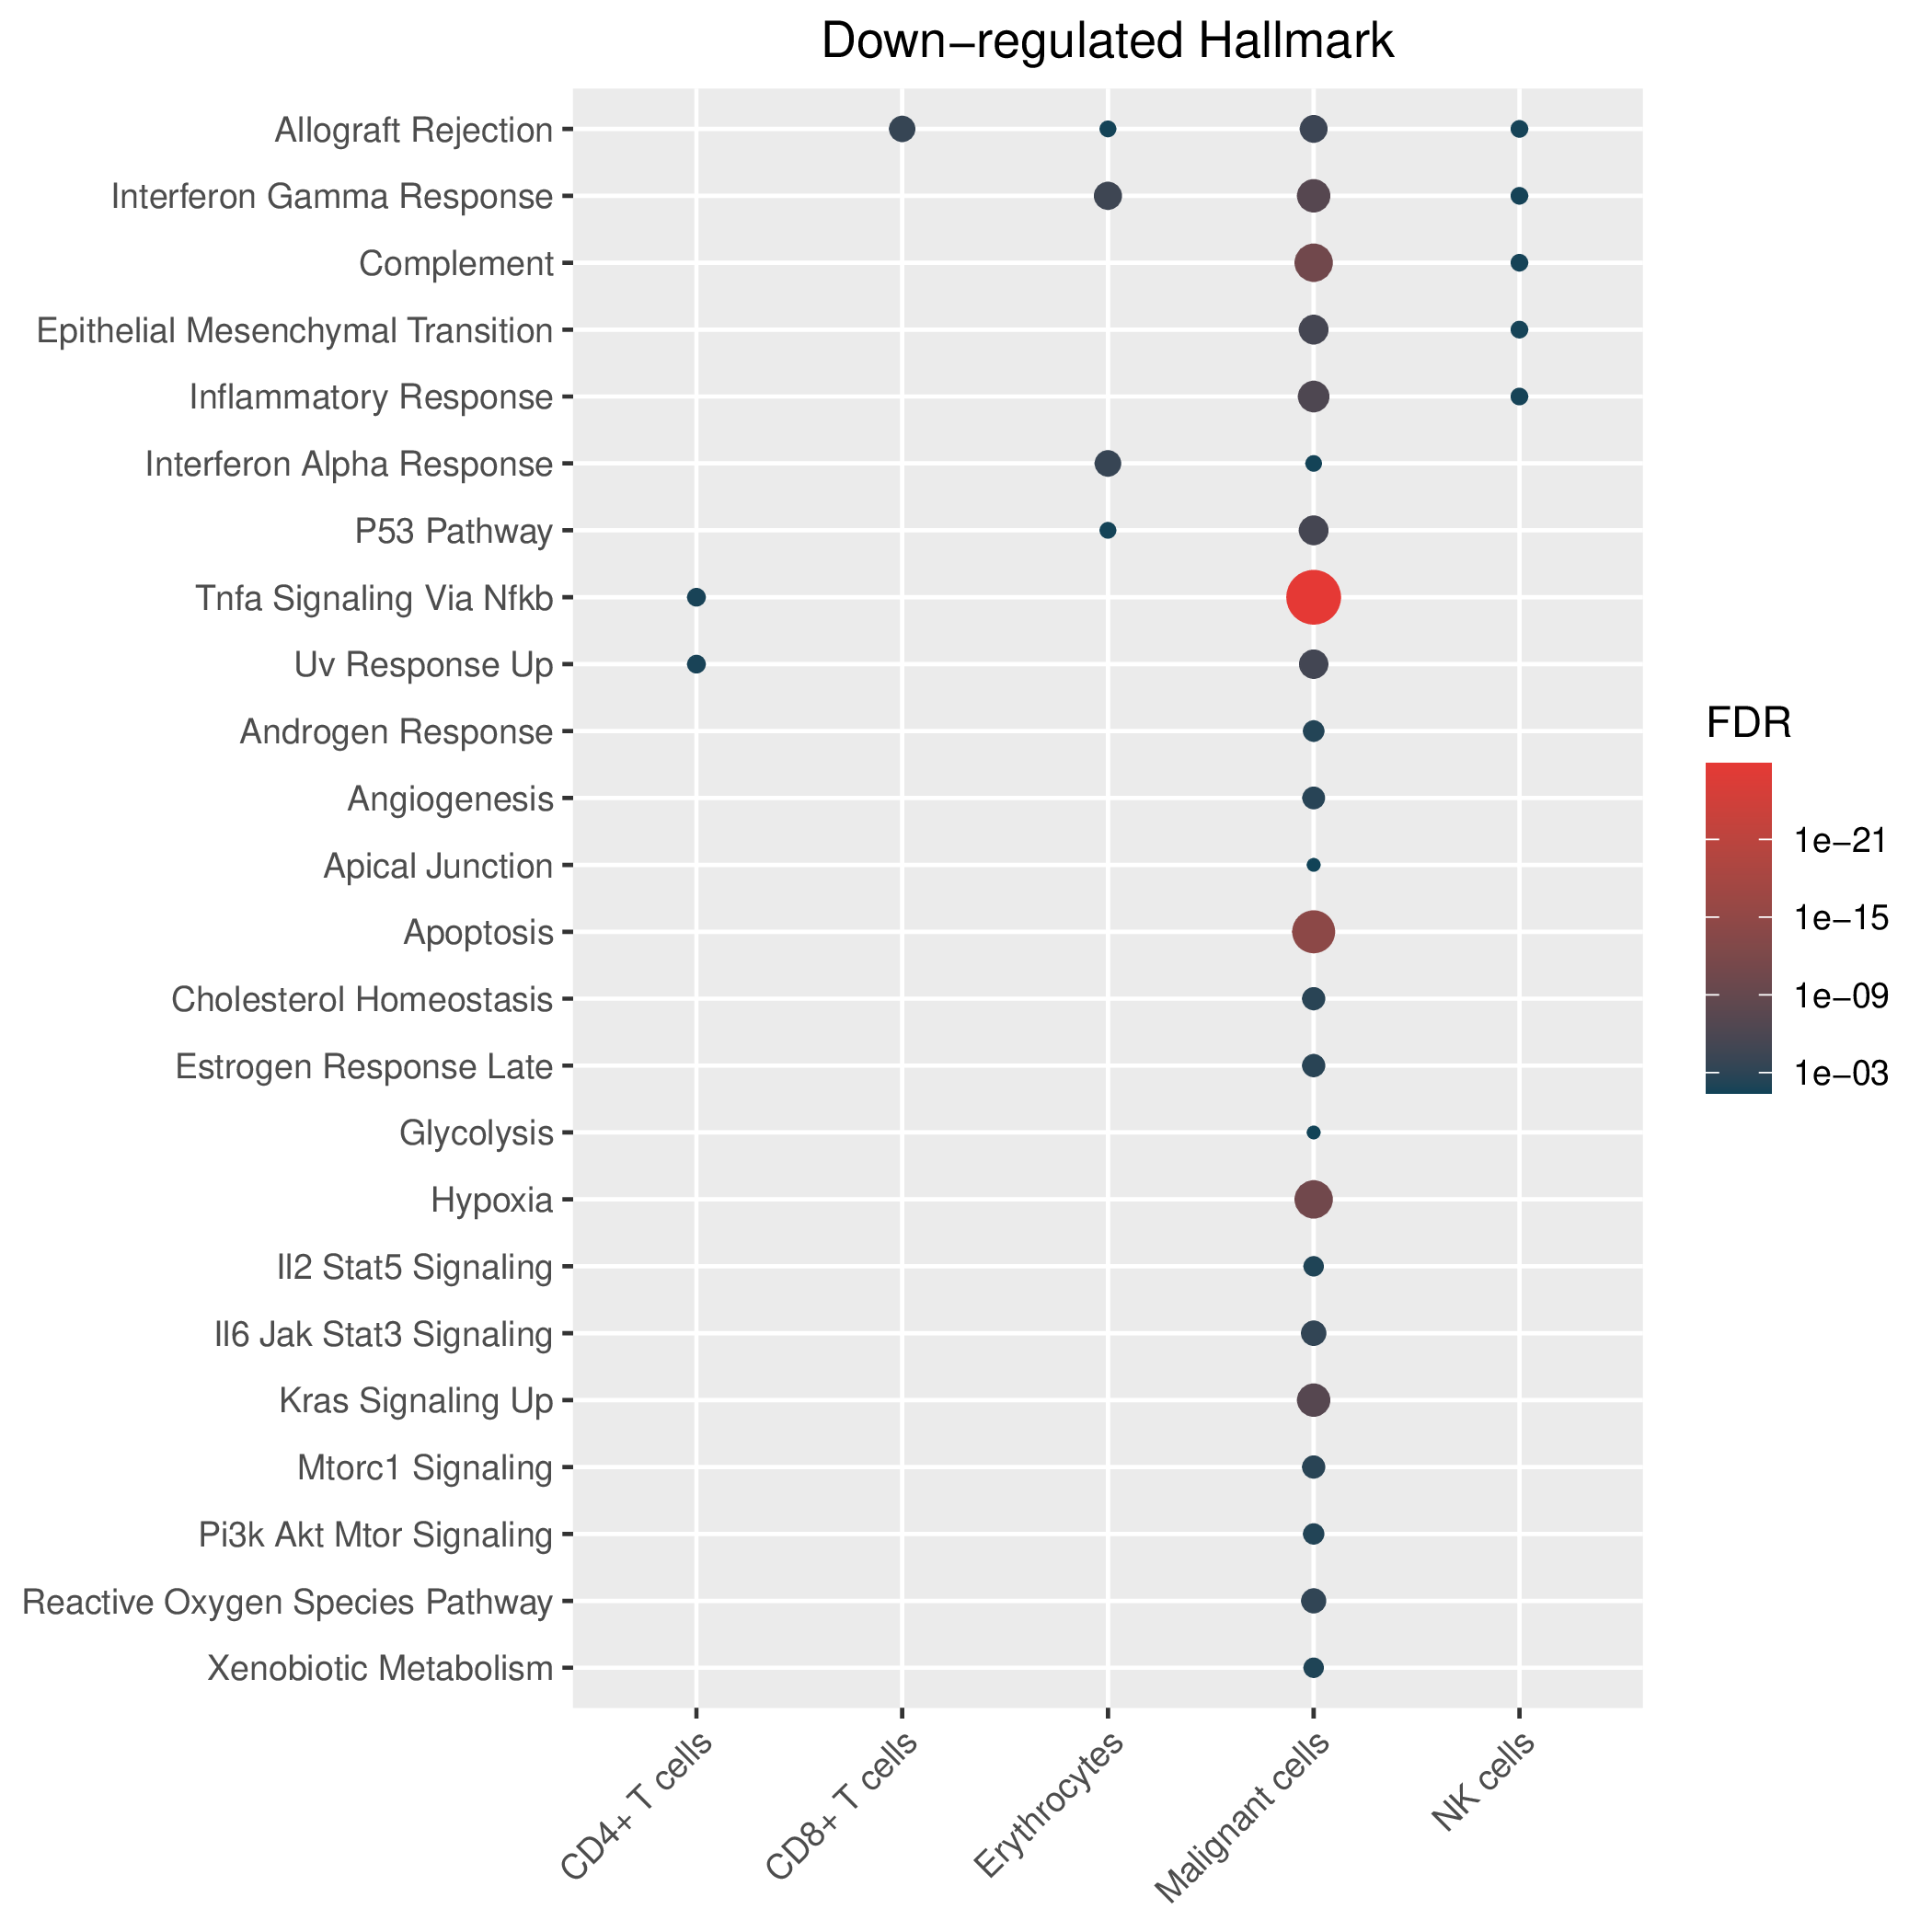 | 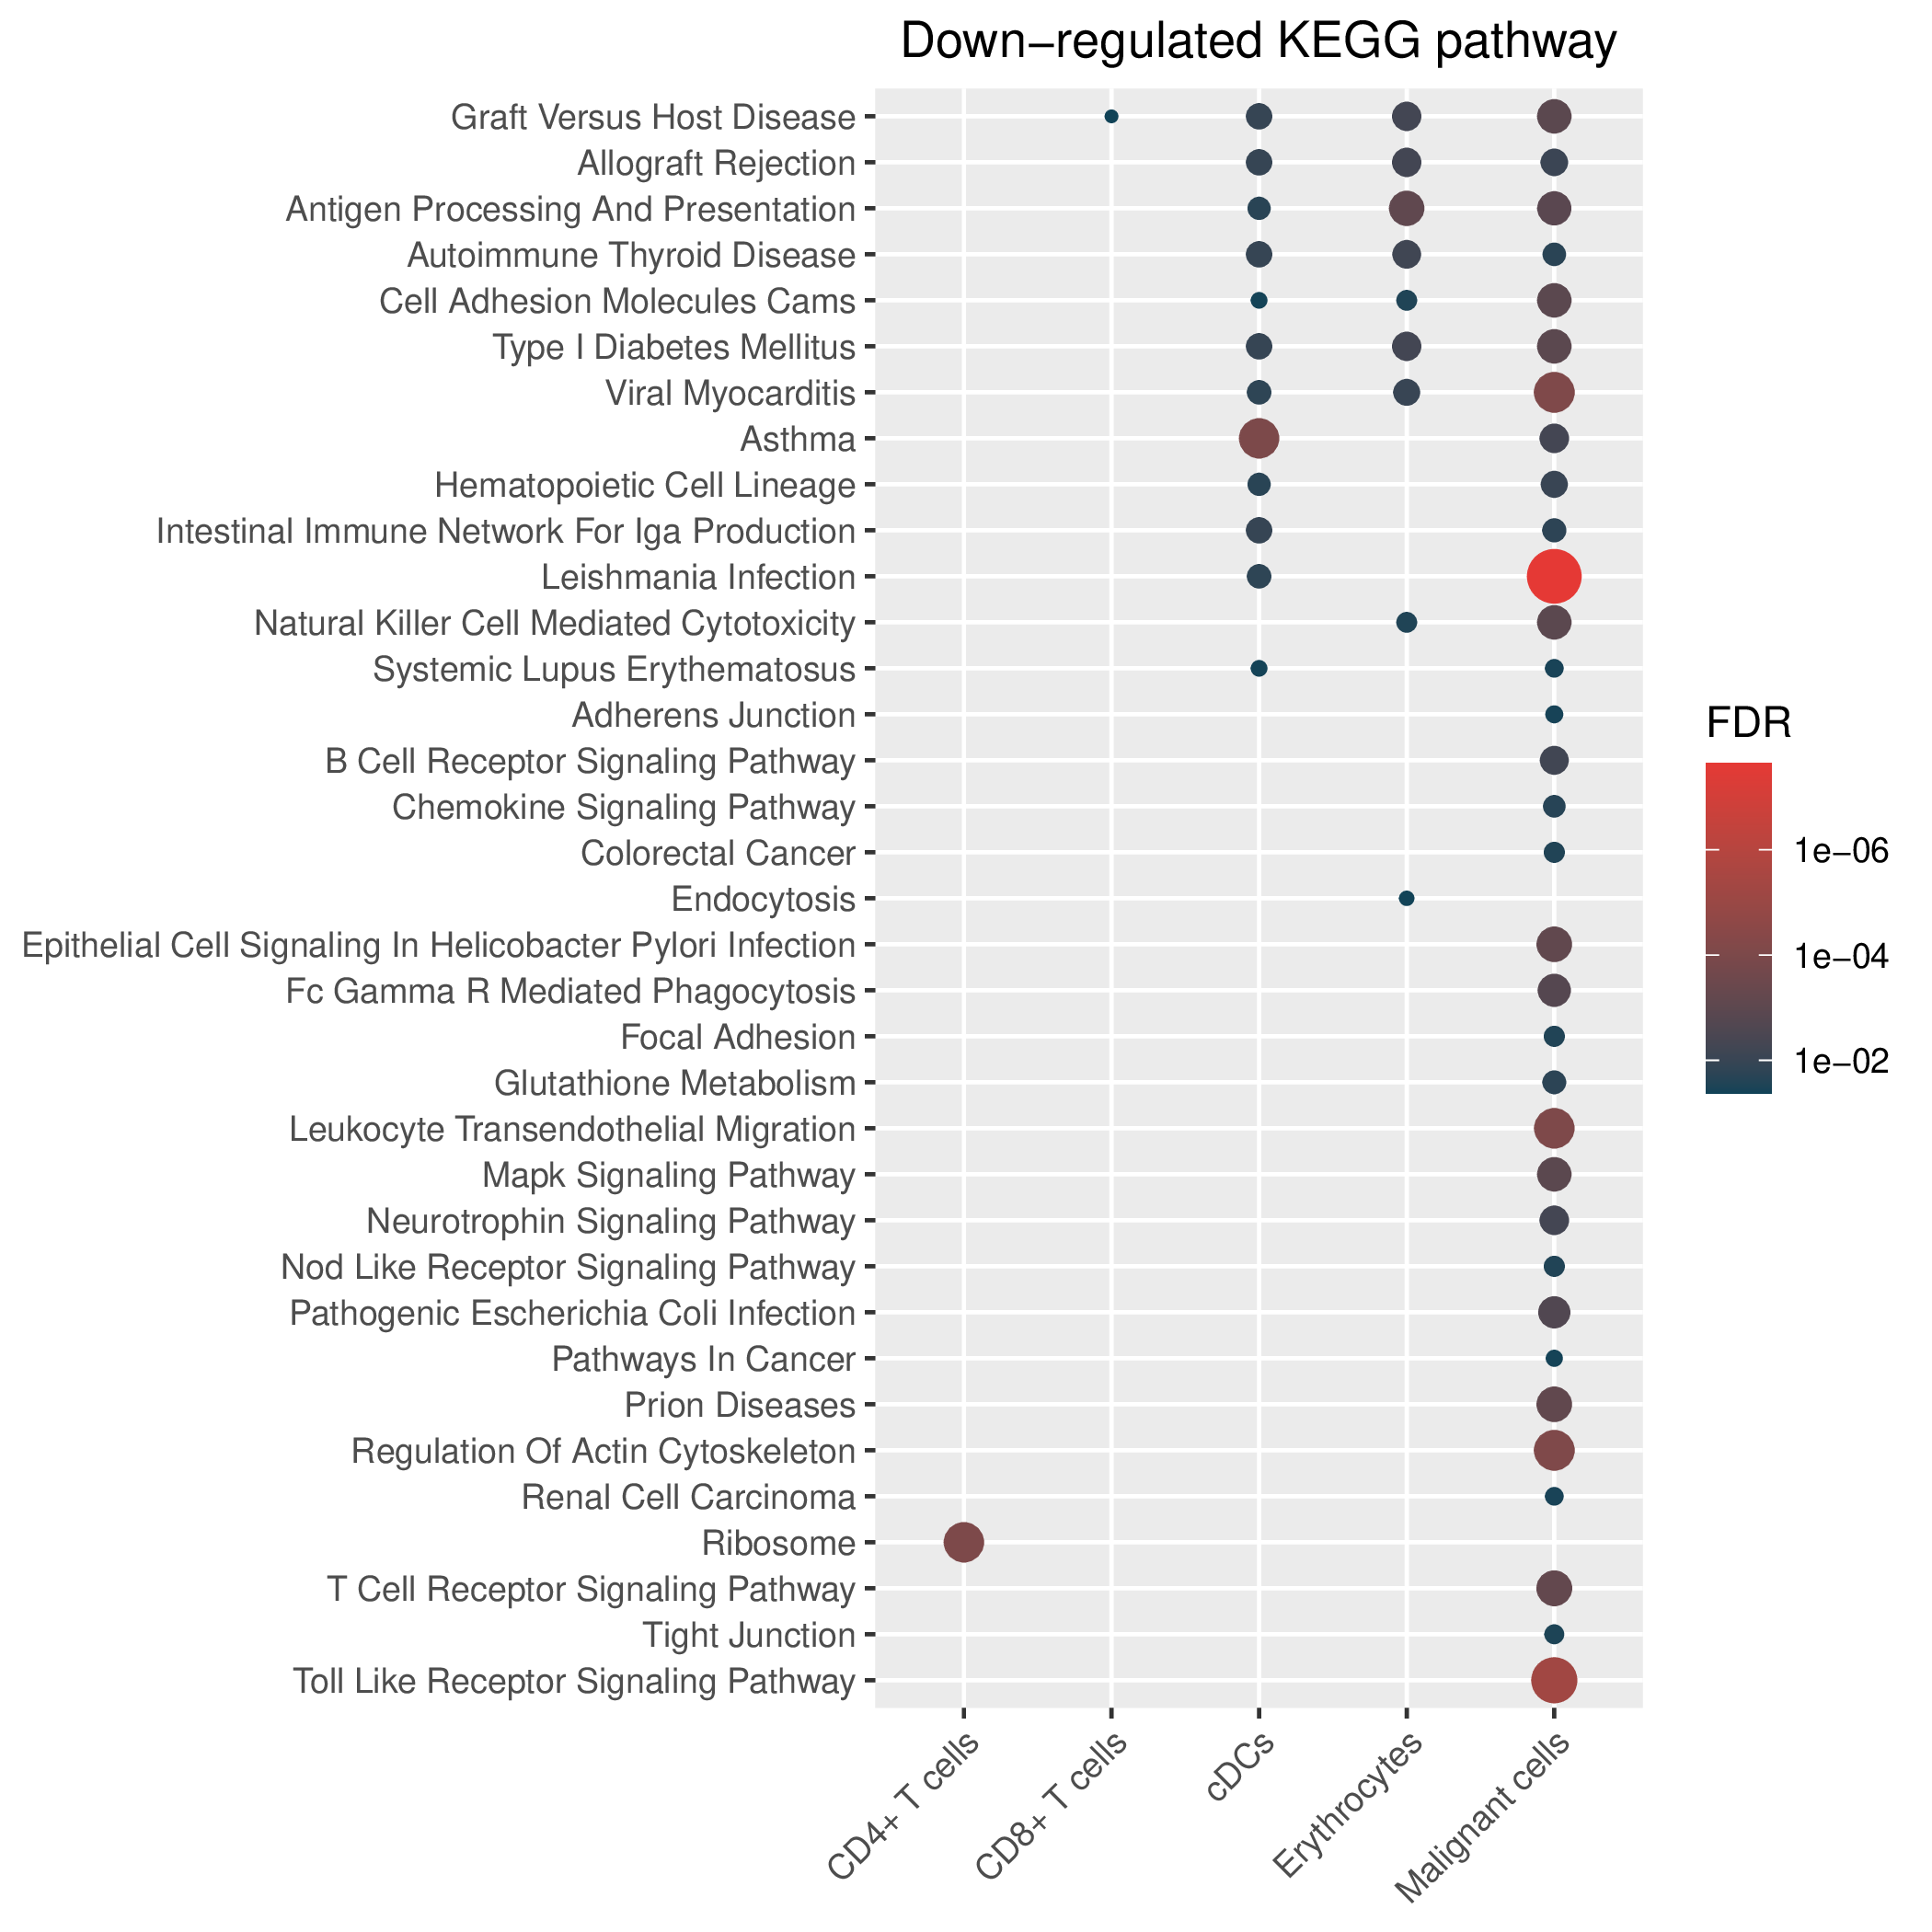 | 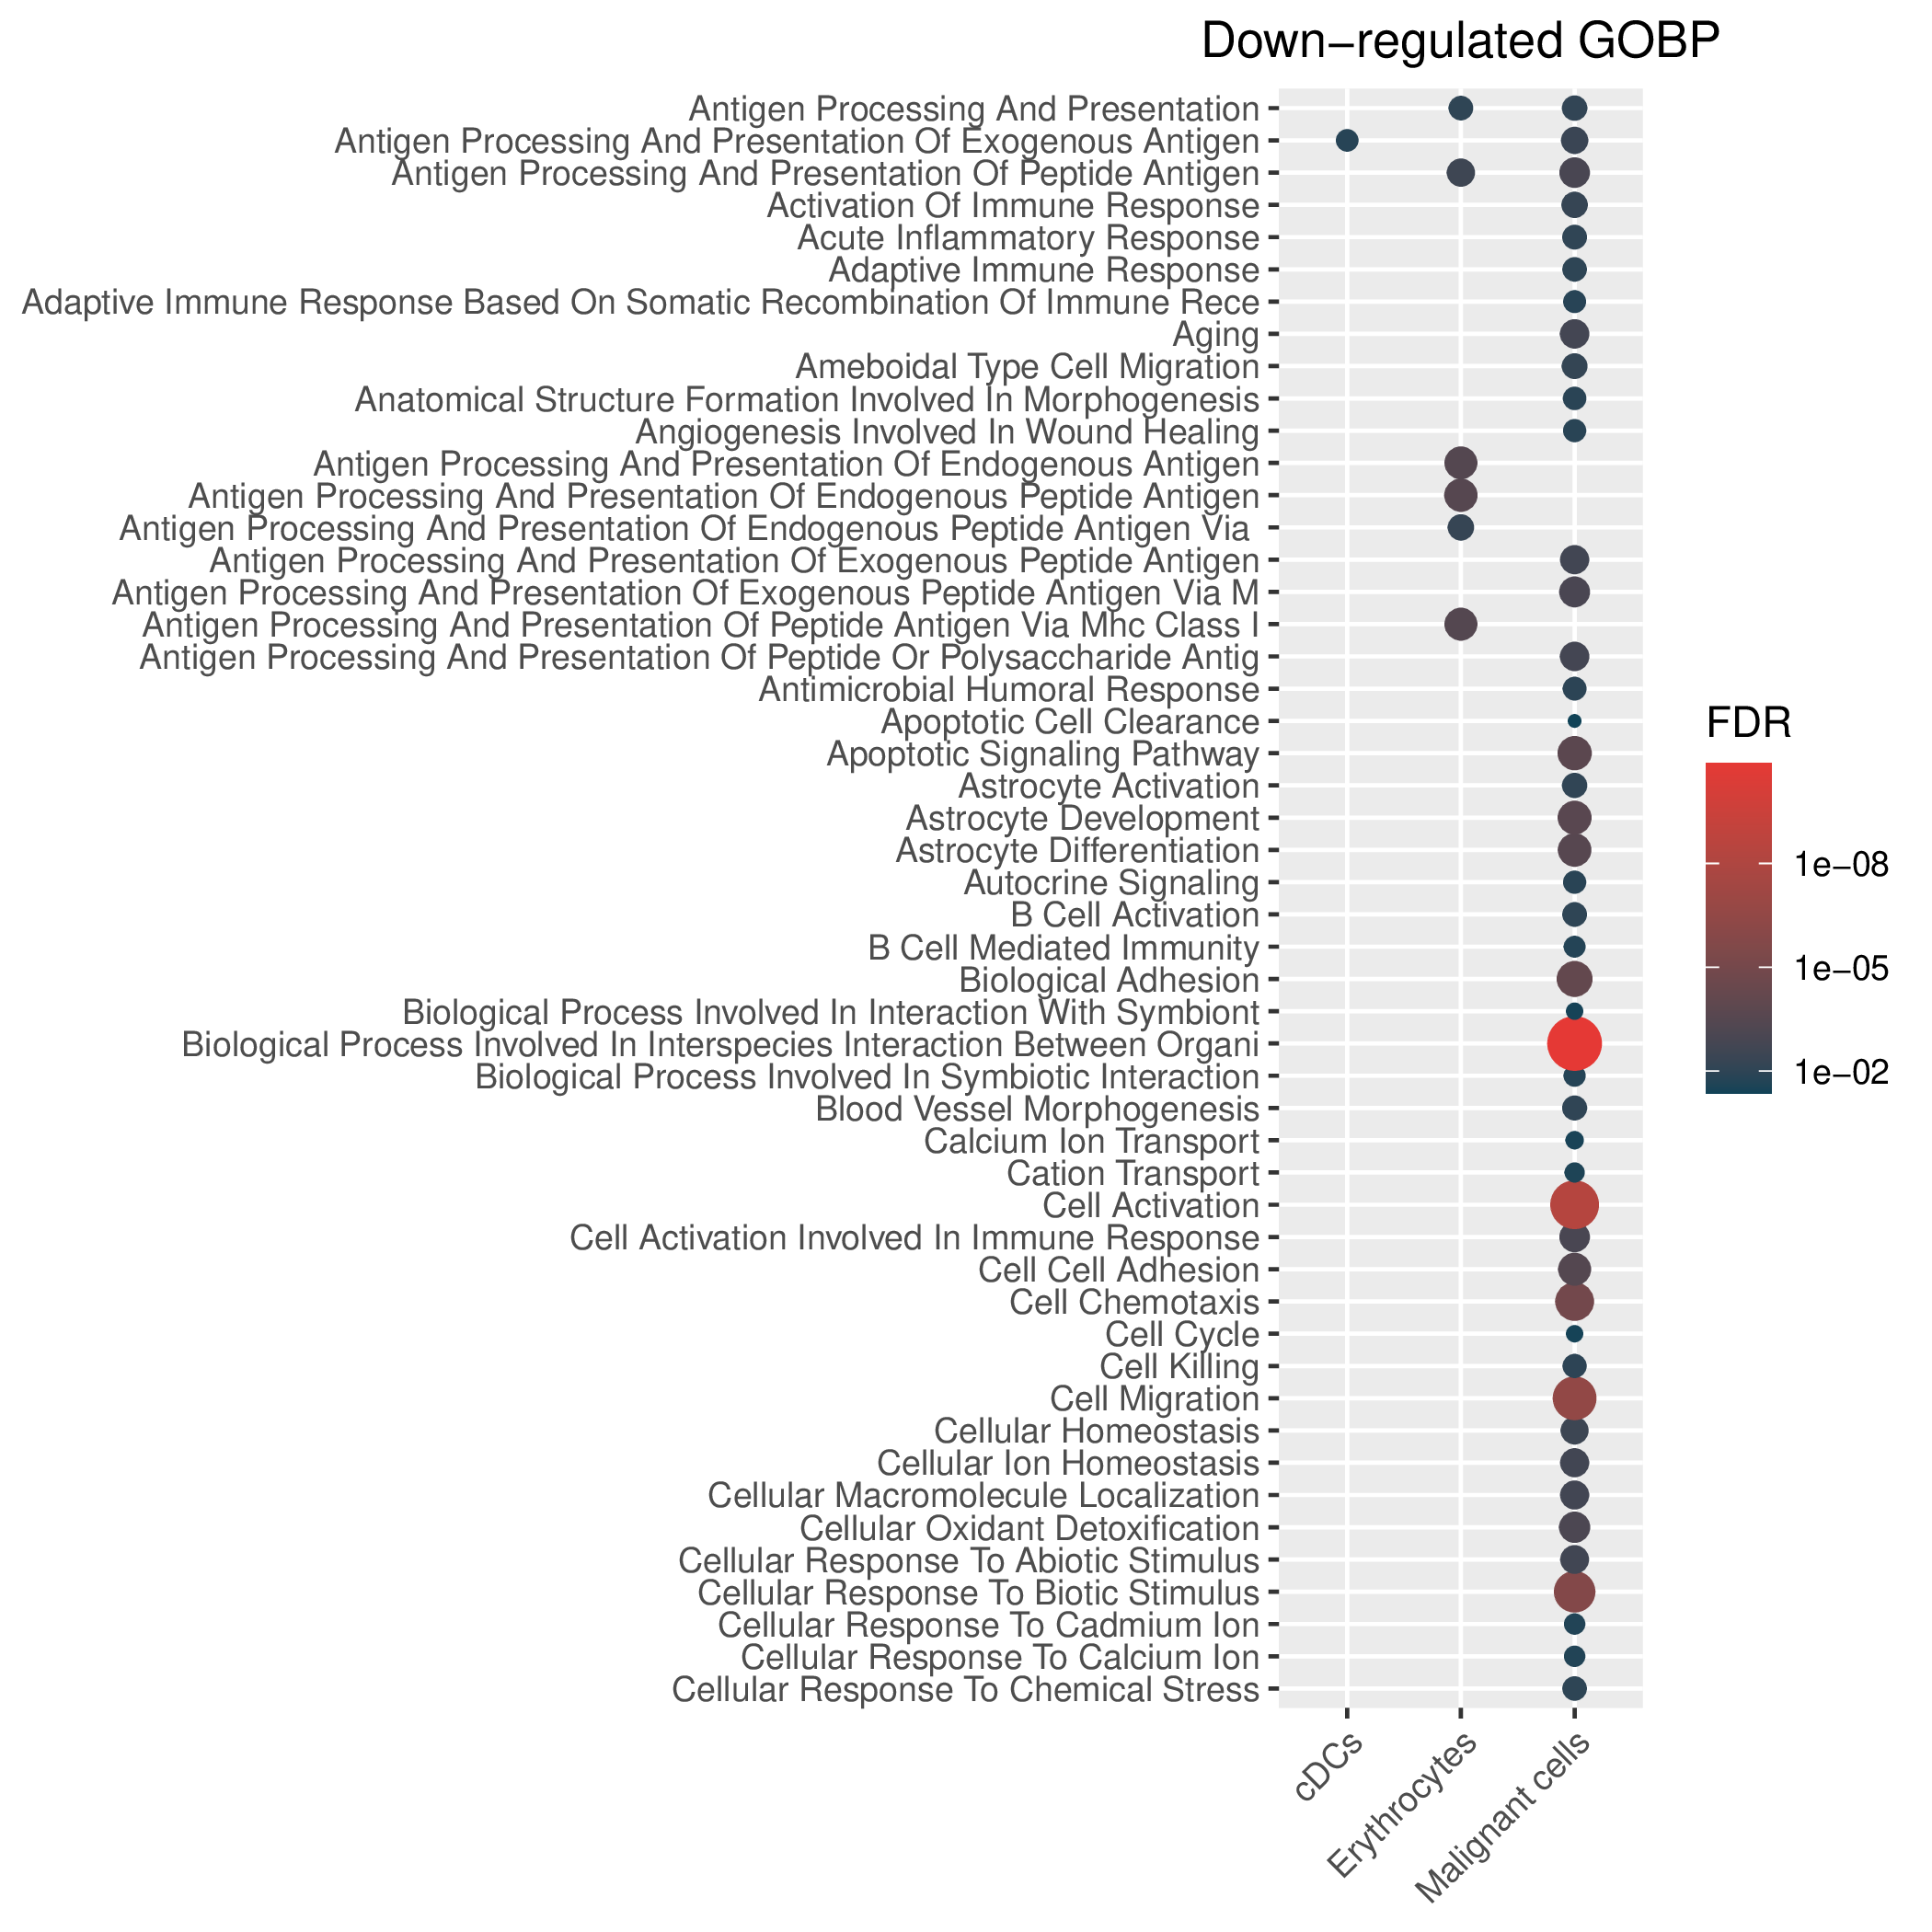 |
Top |
Mechanism analysis of drug resistance-related DEGs for each cell type in the post-treatment samples |
| Enrichment results for 5 known drug resistance mechanisms in malignant cells and 1 known mechanism in TME cells.The "Signature" column represents the differentially expressed genes (DEGs) used for enrichment. The "Geneset" column represents the genes included in this mechanism. The "Overlap" column represents the number of genes in the "Geneset" that are enriched in the "Signature". The "Enriched Genes" column represents the genes in the "Geneset" that are enriched in the "Signature". (If the image exists, the user can click on it to enlarge it in a new window.) |
| Enrichment results for 5 known drug resistance mechanisms in malignant cells |
 |
| Mechnism | Pval | FDR | Signature | Geneset | Overlap | Background | Cell type | Enriched Genes |
| Unusual Activation of Pro-survival Pathway | 1.10e-05 | 5.50e-05 | 120 | 781 | 15 | 23467 | Malignant cells | ANXA2,DUSP6,ISG15,JUN,MCL1,RPS6,S100A4,CLU,NFKBIA,IL1B,S100A11,SOD2,TPT1,NPM1,CEBPD |
| Aberration of the Drug's Therapeutic Target | 7.80e-02 | 1.90e-01 | 120 | 90 | 2 | 23467 | Malignant cells | IL1B,NPM1 |
| Drug Inactivation by Structure Modification | 1.30e-01 | 2.20e-01 | 120 | 27 | 1 | 23467 | Malignant cells | SOD2 |
| Epigenetic Alteration of DNA, RNA or Protein | 1.00e+00 | 1.00e+00 | 120 | 455 | 0 | 23467 | Malignant cells | |
| Irregularity in Drug Uptake and Drug Efflux | 1.00e+00 | 1.00e+00 | 120 | 37 | 0 | 23467 | Malignant cells |
| Enrichment results for 1 known drug resistance mechanisms in TME cells |
 |
| Mechnism | Pval | FDR | Signature | Geneset | Overlap | Background | Cell type | Enriched Genes |
| Regulation by the Disease Microenvironment | 5.00e-01 | 5.00e-01 | 87 | 186 | 1 | 23467 | CD4+ T cells | CXCR4 |
| Regulation by the Disease Microenvironment | 2.60e-01 | 2.60e-01 | 38 | 186 | 1 | 23467 | CD8+ T cells | MALAT1 |
| Regulation by the Disease Microenvironment | 7.20e-02 | 7.20e-02 | 197 | 186 | 4 | 23467 | cDCs | CXCR4,IL1B,VIM,MALAT1 |
| Regulation by the Disease Microenvironment | 1.00e+00 | 1.00e+00 | 86 | 186 | 0 | 23467 | Erythrocytes | NA |
| Regulation by the Disease Microenvironment | 1.00e+00 | 1.00e+00 | 23 | 186 | 0 | 23467 | NK cells | NA |
| Regulation by the Disease Microenvironment | 1.00e+00 | 1.00e+00 | 10 | 186 | 0 | 23467 | pDCs | NA |
| Hallmark, KEGG and GOBP enrichment results for up-regulated genes in resistant group of post-treatment samples. Only show the top 50 pathways with fdr<0.05. If certain cell types are not displayed, it means that there are no significant pathways based on DEGs in those cell types. (If the image exists, the user can click on it to enlarge it in a new window. Complete files can be downloaded from the download section.) |
| Up-regulated Hallmark | Up-regulated KEGG | Up-regulated GO BP |
 |  |  |
| Hallmark, KEGG and GOBP enrichment results for down-regulated genes in resistant group of post-treatment samples. Only show the top 50 pathways with fdr<0.05. If certain cell types are not displayed, it means that there are no significant pathways based on DEGs in those cell types. (If the image exists, the user can click on it to enlarge it in a new window. Complete files can be downloaded from the download section.) |
| Down-regulated Hallmark | Down-regulated KEGG | Down-regulated GO BP |
 |  |  |
Top |
Mechanism analysis of drug resistance-related DEGs for each cell type in one patient or cell lines |
| This dataset only has one patient or is a cell line dataset, the resistant sample is the post-treatment sample and the sensitive sample is the pre-treatment sample. Enrichment results for 5 known drug resistance mechanisms in malignant cells and 1 known mechanism in TME cells are shown here.The "Signature" column represents the differentially expressed genes (DEGs) used for enrichment. The "Geneset" column represents the genes included in this mechanism. The "Overlap" column represents the number of genes in the "Geneset" that are enriched in the "Signature". The "Enriched Genes" column represents the genes in the "Geneset" that are enriched in the "Signature". (If the image exists, the user can click on it to enlarge it in a new window.) |
| Hallmark, KEGG and GOBP enrichment results for up-regulated genes in resistant group. Only show the top 50 pathways with fdr<0.05. If certain cell types are not displayed, it means that there are no significant pathways based on DEGs in those cell types. (If the image exists, the user can click on it to enlarge it in a new window. Complete files can be downloaded from the download section.) |
| Hallmark, KEGG and GOBP enrichment results for down-regulated genes in resistant group. Only show the top 50 pathways with fdr<0.05. If certain cell types are not displayed, it means that there are no significant pathways based on DEGs in those cell types. (If the image exists, the user can click on it to enlarge it in a new window. Complete files can be downloaded from the download section.) |
Top |
MicroRNAs (miRNAs) regulating drug resistance-related DEGs for malignant cells |
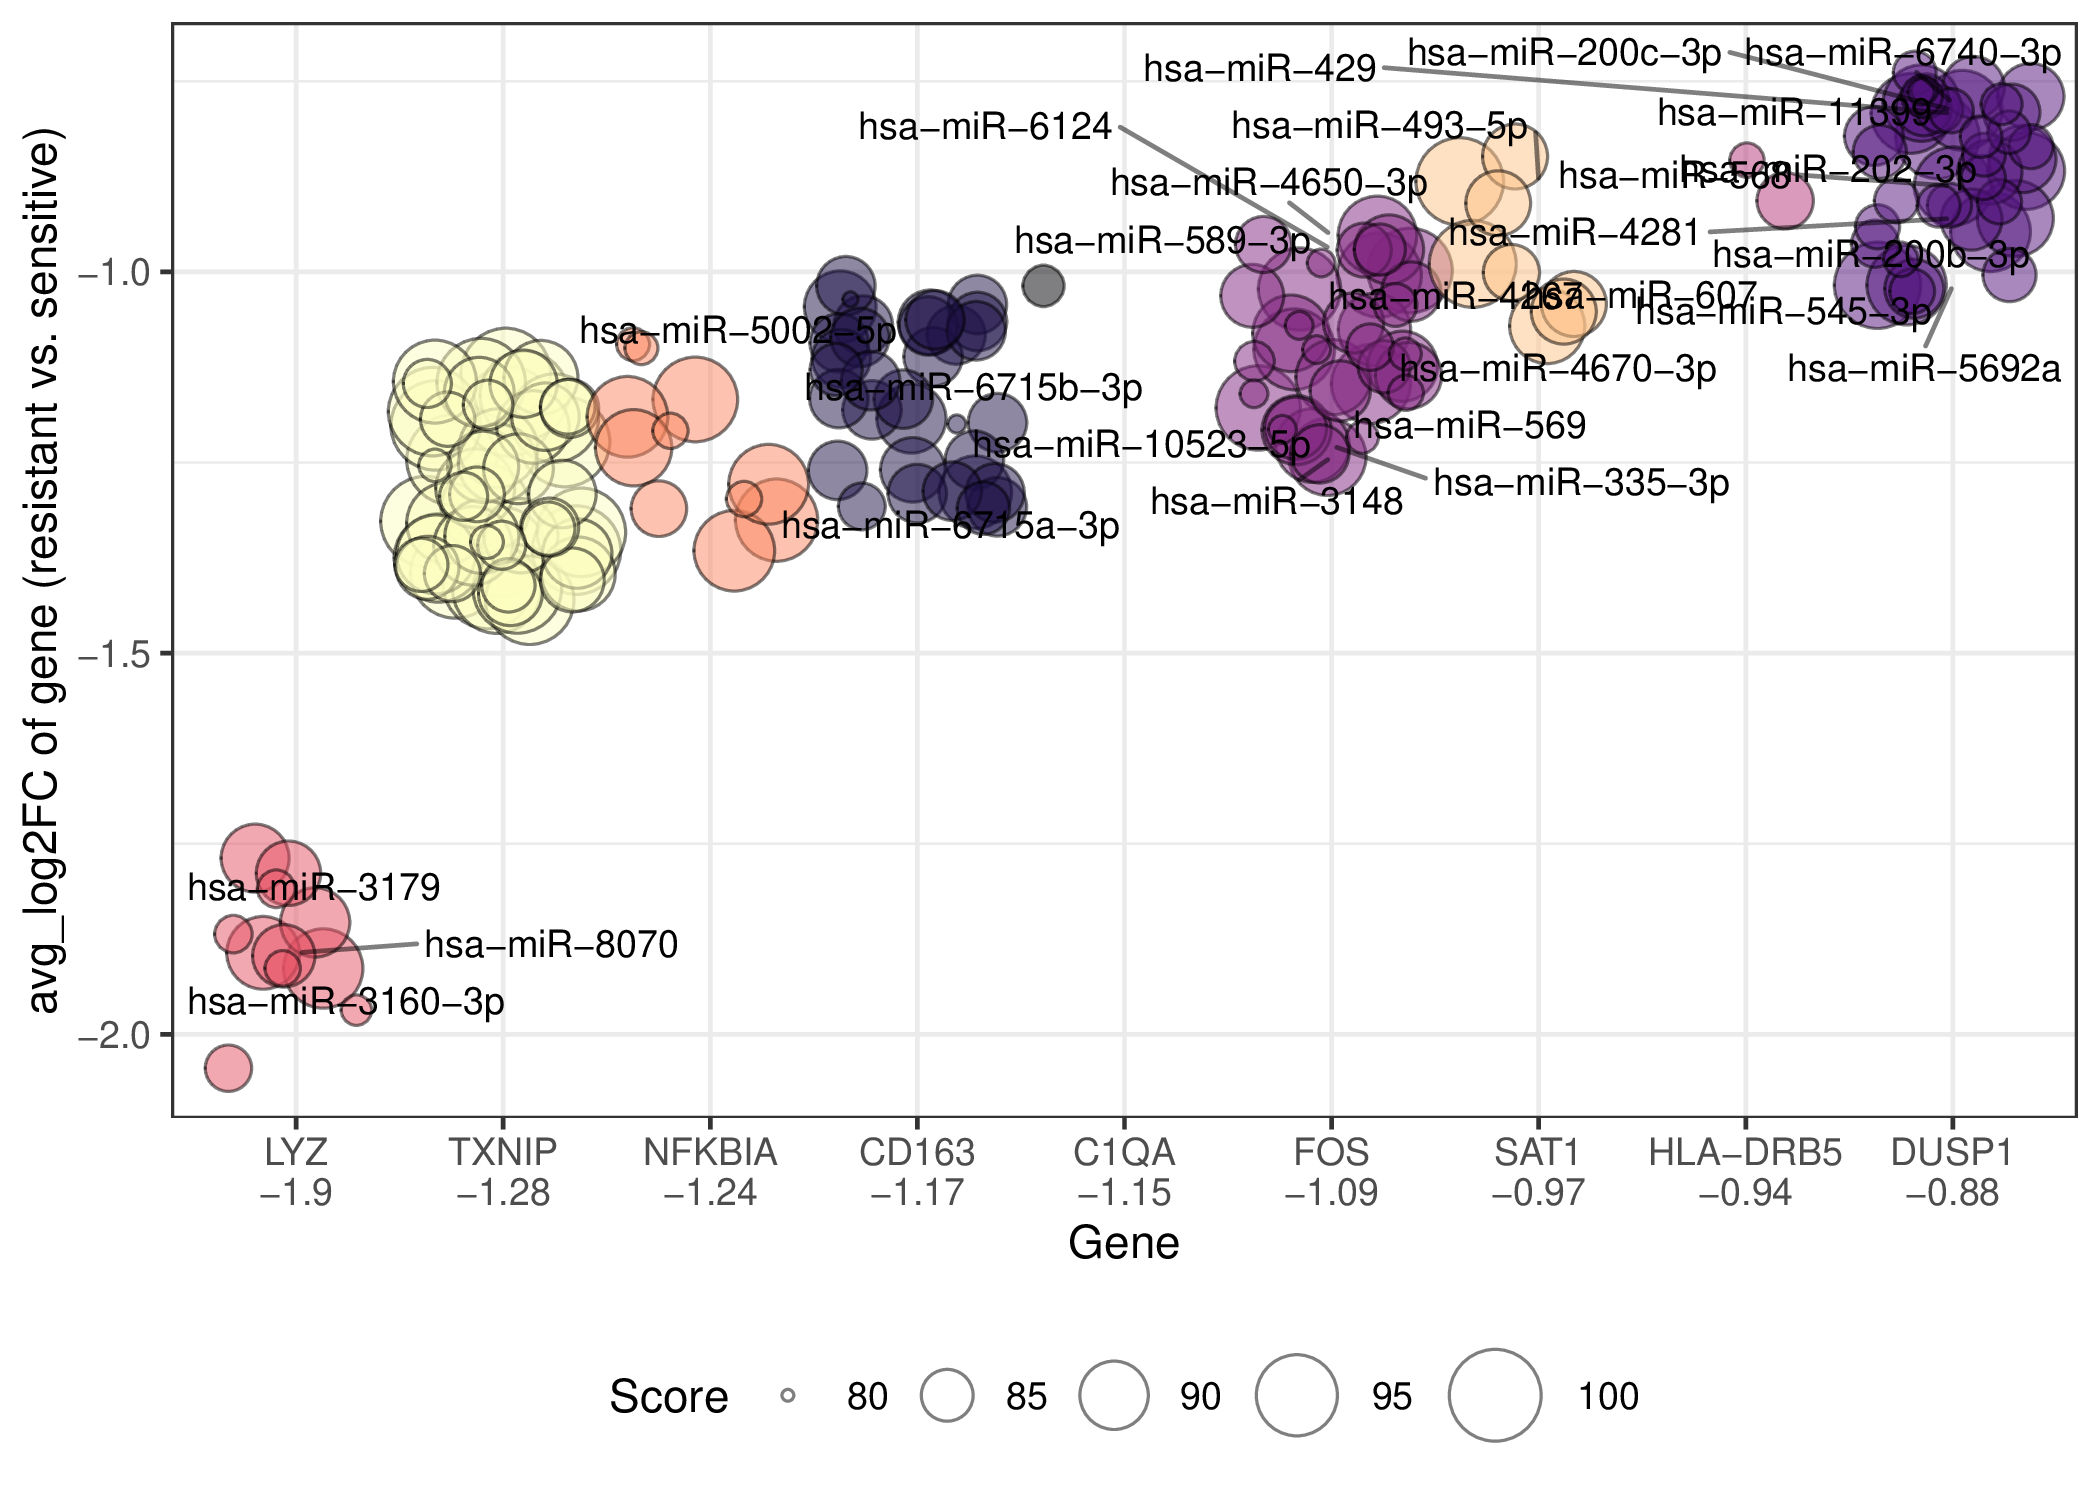
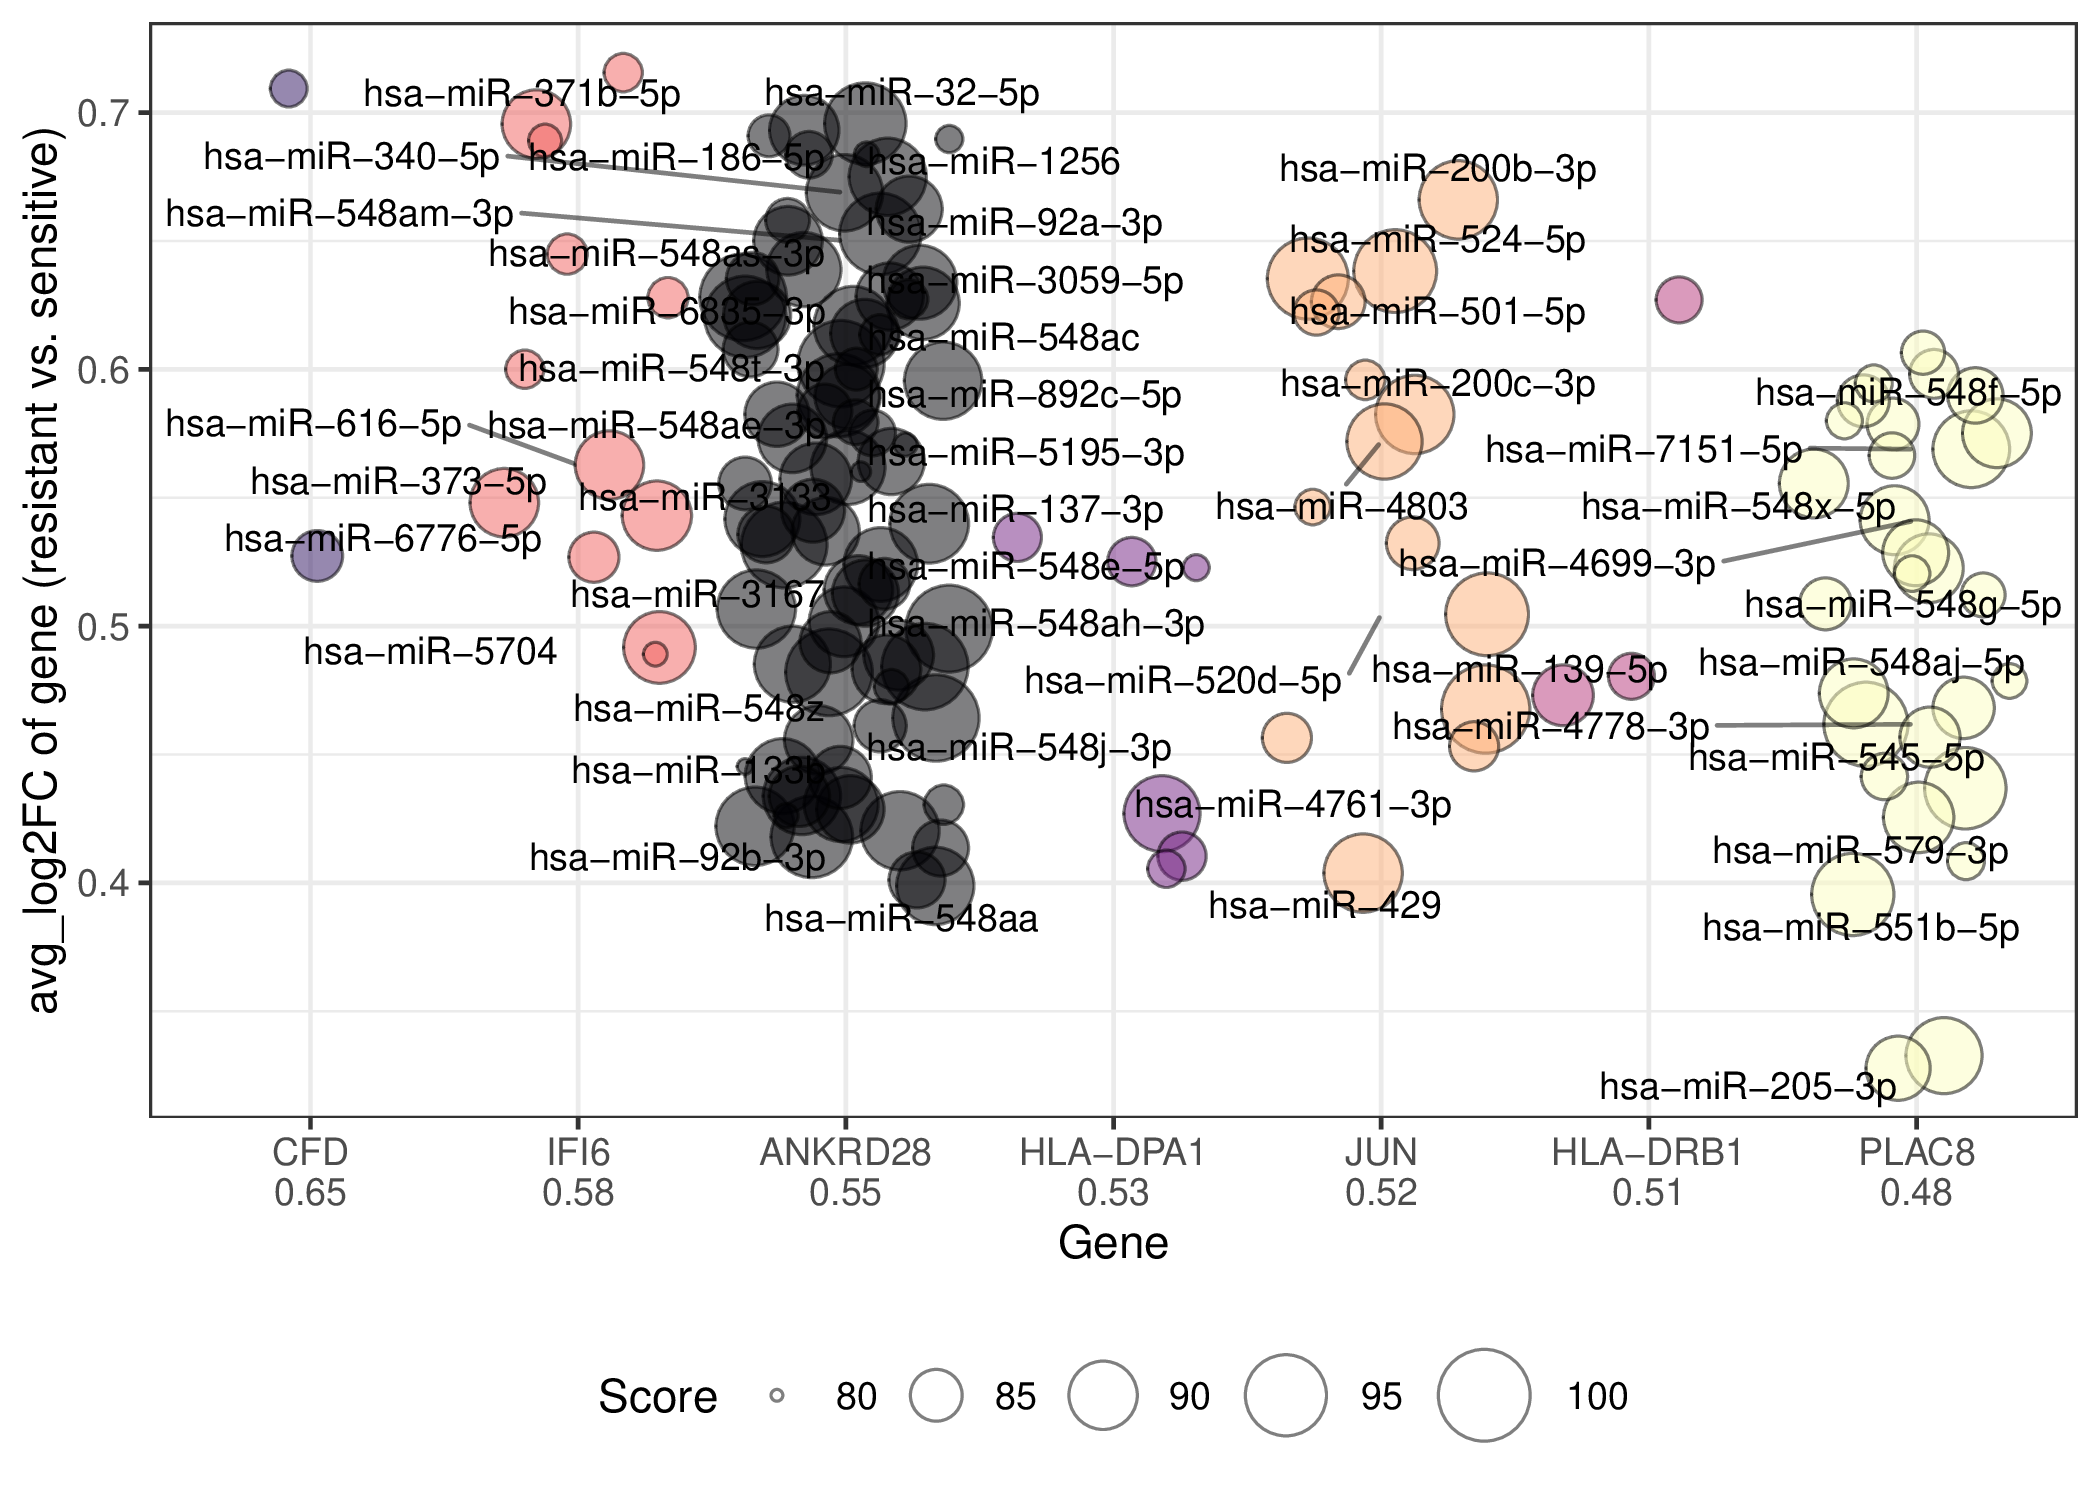
| In the pre-treatment samples, the miRNAs with a score greater than 80 that regulate the top10 abs(avg_log2FC) drug resistance-related DEGs for malignant cells are shown here. If the gene does not have any miRNAs with a score greater than 80, it will not be shown. Here only the names of miRNAs with a score greater than 90 are shown, but some names will not be shown because of too many overlaps. (Complete files containing all datasets and cell types can be downloaded from the download section.) |
| Regulating up-regulated DEGs in resistant group | Regulating down-regulated DEGs in resistant group |
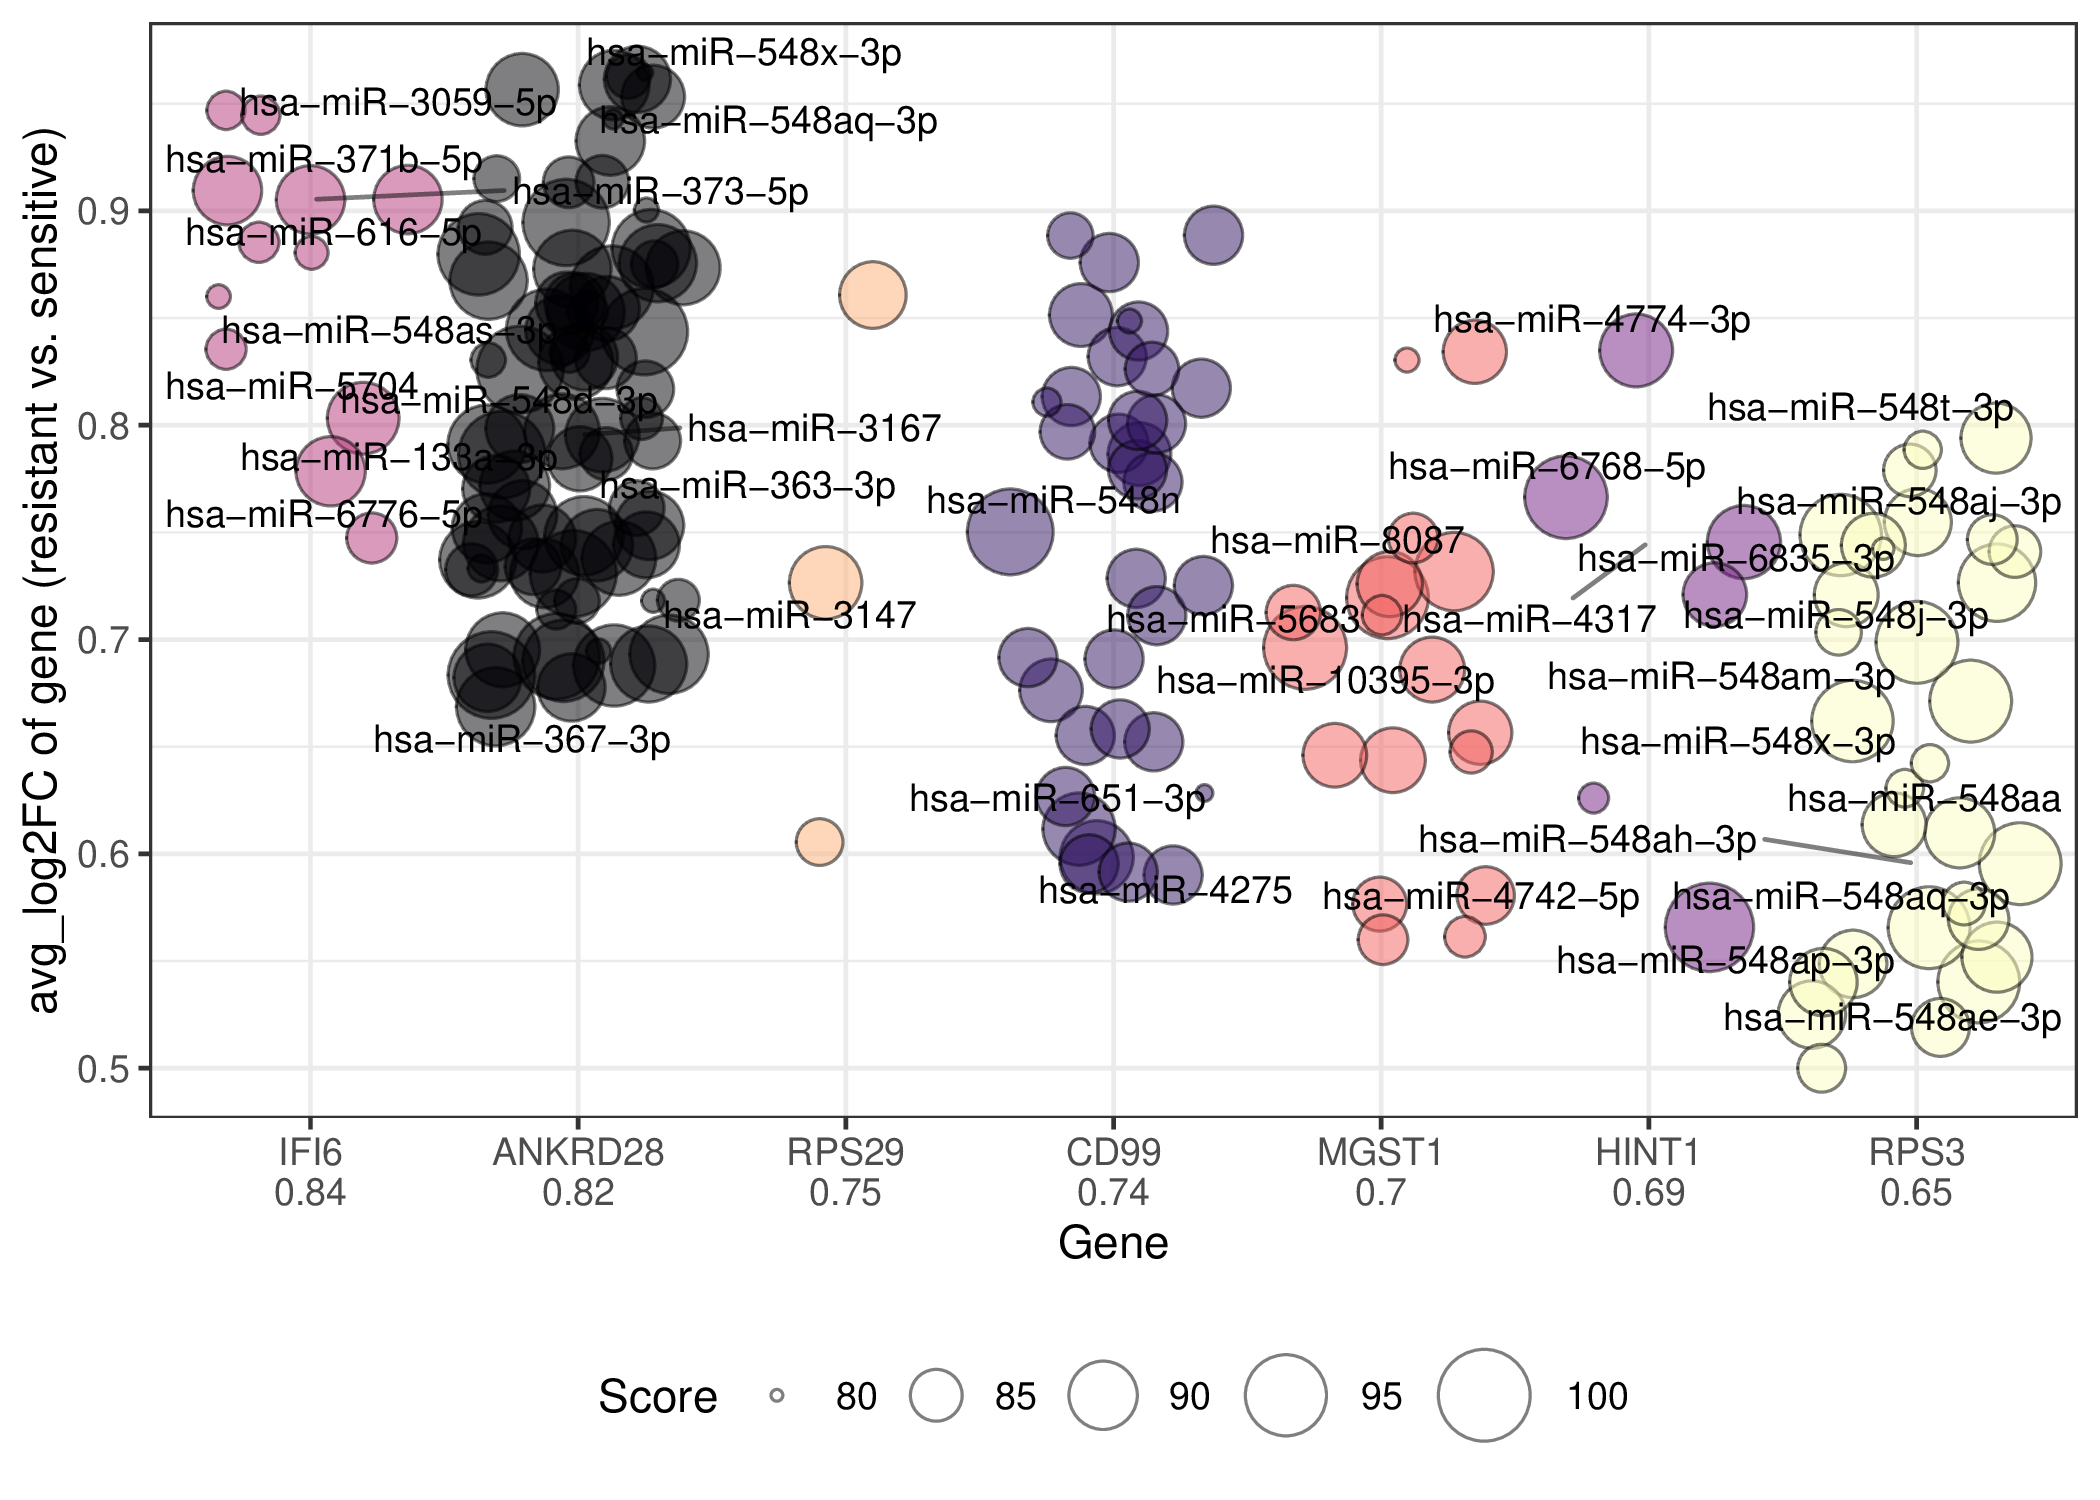 |  |
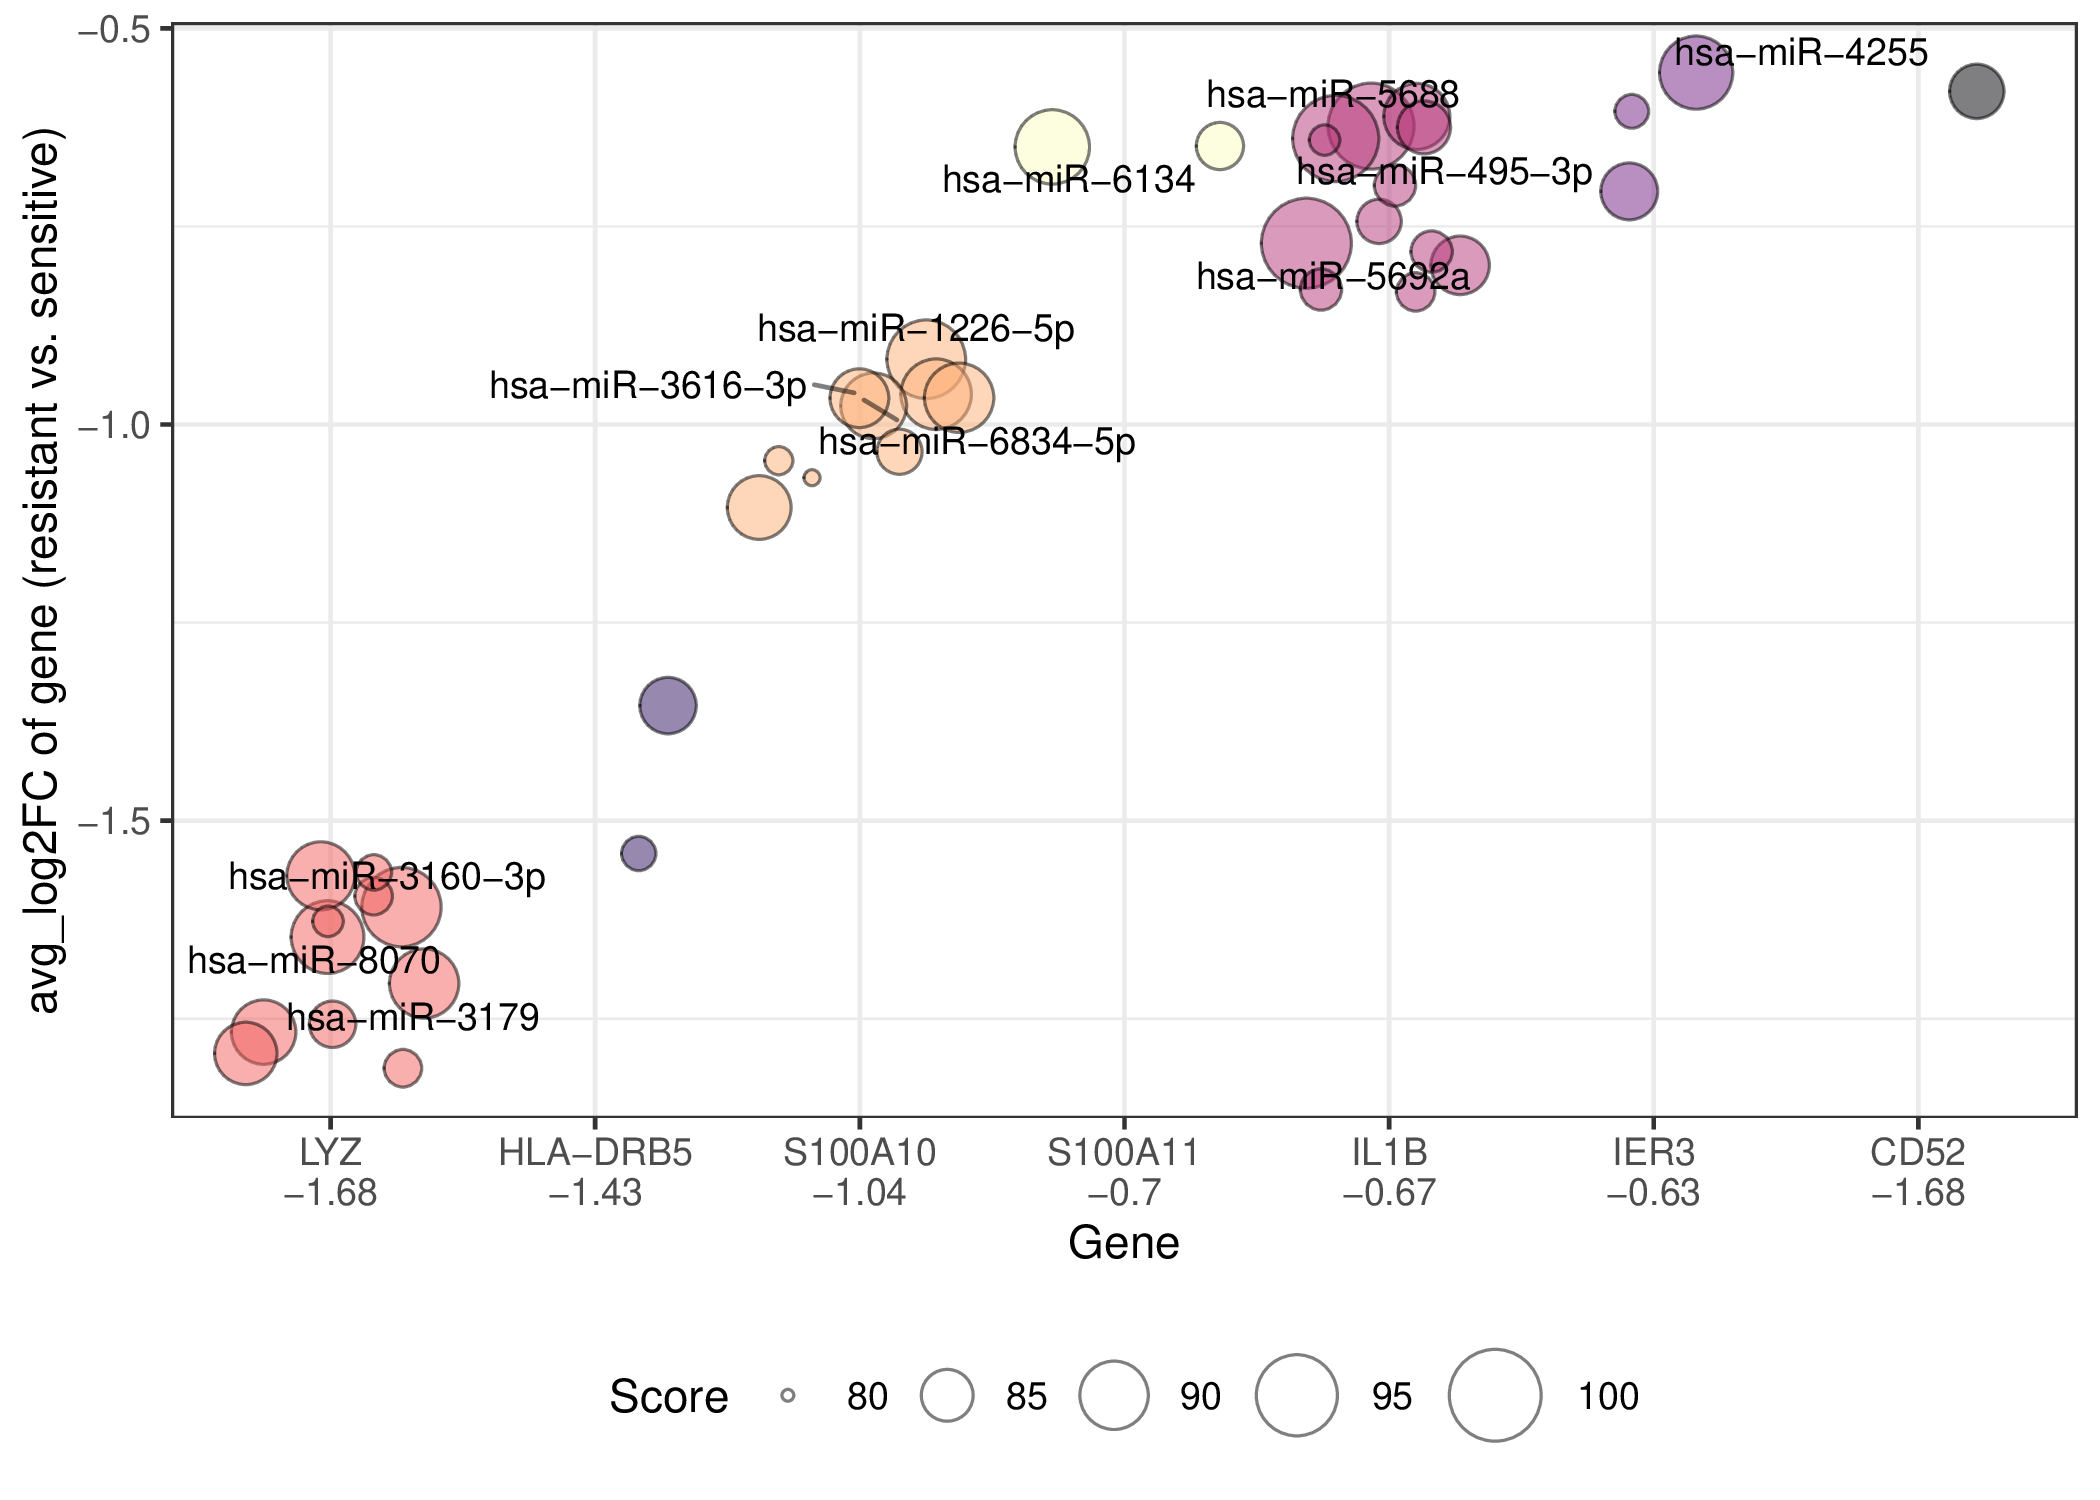
| In the post-treatment samples, the miRNAs with a score greater than 80 that regulate the top10 abs(avg_log2FC) drug resistance-related DEGs for Malignant cells are shown here. If the gene does not have any miRNAs with a score greater than 80, it will not be shown. Here only the names of miRNAs with a score greater than 90 are shown, but some names will not be shown because of too many overlaps. (Complete files containing all datasets and cell types can be downloaded from the download section.) |
| Regulating up-regulated DEGs in resistant group | Regulating down-regulated DEGs in resistant group |
 |  |
| This dataset only has one patient or is a cell line dataset, the resistant sample is the post-treatment sample and the sensitive sample is the pre-treatment sample. The miRNAs with a score greater than 80 that regulate the top10 abs(avg_log2FC) drug resistance-related DEGs for Malignant cells are shown here. Here only the names of miRNAs with a score greater than 80 are shown, but some names will not be shown because of too many overlaps. If the gene does not have any miRNAs with a score greater than 90, it will not be shown. (Complete files containing all datasets and cell types can be downloaded from the download section.) |
Top |
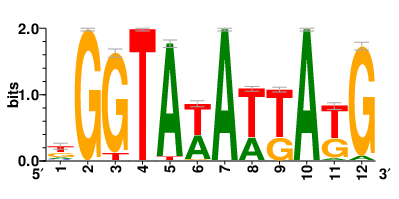
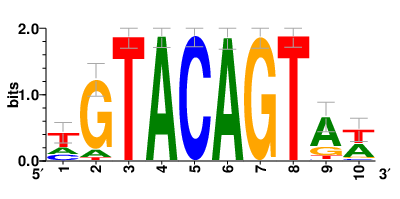
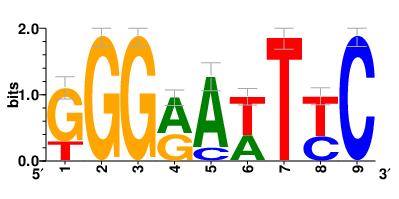
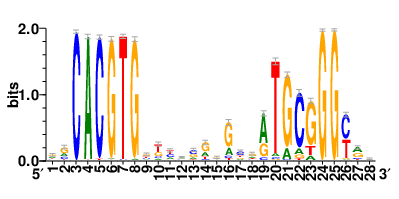
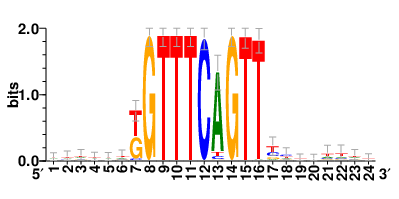
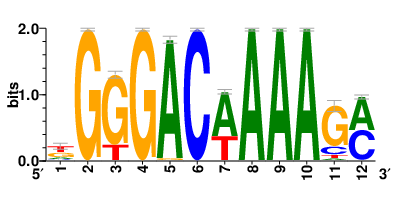
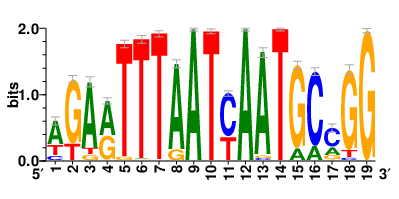
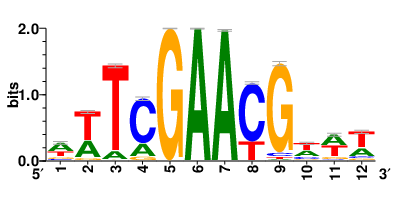
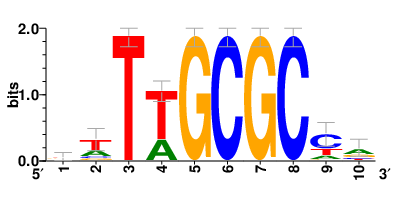
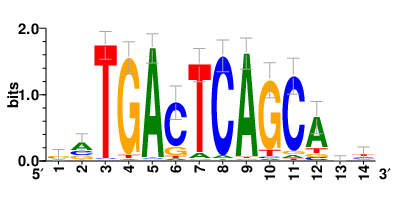
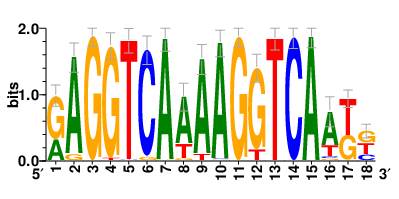
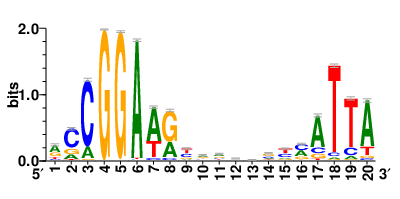
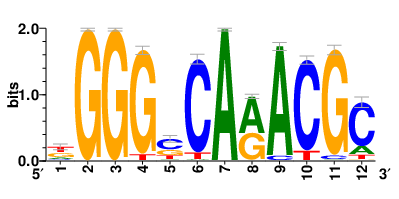
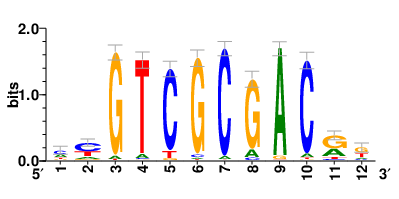
Motifs and transcription factors (TFs) regulating drug resistance-related DEGs for each cell type |
| In the pre-treatment samples, the motifs and TFs that regulate drug resistance-related DEGs for each cell type are shown here. (Complete files can be downloaded from the download section.) |
| Motifs and TFs regulating up-regulated DEGs in resistant group of the pre-treatment samples |
| motif | motif | NES | AUC | TF_highConf | Cell_type |
 | transfac_pro__M05939 | 7.63 | 0.238 | ZNF471 (directAnnotation). | B cells |
 | transfac_pro__M06665 | 6.65 | 0.209 | ZNF599 (directAnnotation). | B cells |
 | transfac_pro__M06192 | 6.16 | 0.195 | ZNF135 (directAnnotation). | B cells |
 | transfac_pro__M05907 | 5.53 | 0.177 | ZNF416 (directAnnotation). | B cells |
 | transfac_pro__M06969 | 5.45 | 0.175 | EBF4 (inferredBy_Orthology). | B cells |
 | metacluster_106.2 | 5.36 | 0.172 | ZBTB32 (directAnnotation). | B cells |
 | taipale_tf_pairs__HOXB2_ETV7_TAATKNNNNGNNNNNNCTTCCNN_CAP_repr | 5.33 | 0.171 | ETV7; HOXB2 (directAnnotation). | B cells |
 | transfac_pro__M05624 | 4.95 | 0.16 | ZSCAN9 (directAnnotation). | B cells |
 | transfac_pro__M04906 | 4.88 | 0.158 | SIN3A (directAnnotation). | B cells |
 | transfac_pro__M04706 | 4.84 | 0.157 | RELA (directAnnotation). | B cells |
| Page: 1 2 3 4 5 6 7 8 9 10 11 12 13 14 15 16 17 18 19 20 21 22 23 24 25 26 27 28 29 30 31 32 33 34 35 36 37 38 39 40 41 42 43 44 45 46 47 48 49 50 51 |
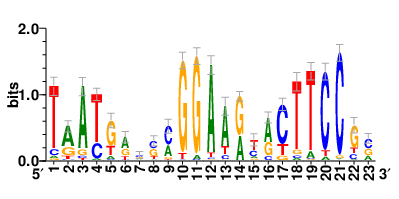
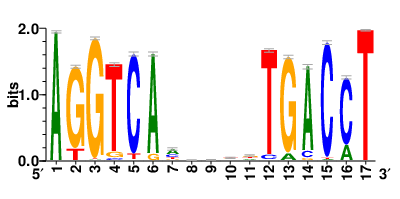
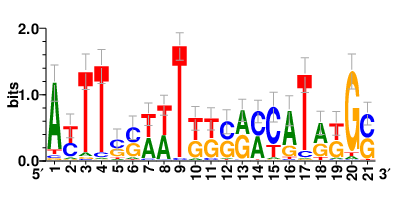
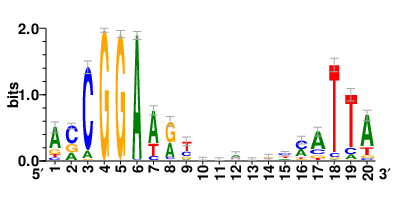
| Motifs and TFs regulating down-regulated DEGs in resistant group of the pre-treatment samples |
| motif | motif | NES | AUC | TF_highConf | Cell_type |
 | taipale_tf_pairs__GCM1_MAX_NNCACGTGNNNNNNNNNNRTGCGGGYRN_CAP_repr | 12.7 | 0.988 | GCM1; MAX (directAnnotation). | B cells |
 | tfdimers__MD00031 | 12.7 | 0.982 | MYB; ZEB1 (directAnnotation). | B cells |
 | transfac_pro__M06362 | 12.6 | 0.977 | ZNF730 (directAnnotation). | B cells |
 | transfac_pro__M06490 | 12.6 | 0.976 | ZNF664 (directAnnotation). | B cells |
 | taipale__NR4A2_full_AGGTCANNNNNTGACCT_repr | 12.5 | 0.969 | NR4A2 (directAnnotation). | B cells |
 | dbtfbs__CHAMP1_K562_ENCSR065XVO_merged_N1 | 12.4 | 0.964 | CHAMP1 (directAnnotation). | B cells |
 | taipale_tf_pairs__GCM1_MAX_NNCACGTGNNNNNNNNNNRTGCGGGYRN_CAP | 12.3 | 0.955 | GCM1; MAX (directAnnotation). | B cells |
 | hocomoco__HSFY1_HUMAN.H11MO.0.D | 12.1 | 0.938 | HSFY1; HSFY2 (directAnnotation). | B cells |
 | cisbp__M00808 | 12.1 | 0.937 | MYPOP (inferredBy_Orthology). | B cells |
 | tfdimers__MD00115 | 11.9 | 0.925 | E2F1; NR1I2; RXRA (directAnnotation). | B cells |
| Page: 1 2 3 4 5 6 7 8 9 10 11 12 13 14 15 16 17 18 19 20 21 22 23 24 25 26 27 28 29 30 31 32 33 34 35 36 37 38 39 40 41 42 43 44 45 46 47 48 49 50 51 52 53 54 55 56 57 58 59 60 61 62 63 64 65 66 67 68 69 70 71 72 73 74 75 76 77 78 |
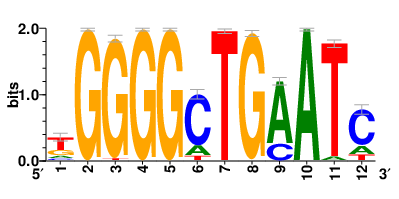
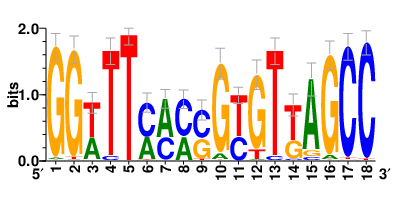
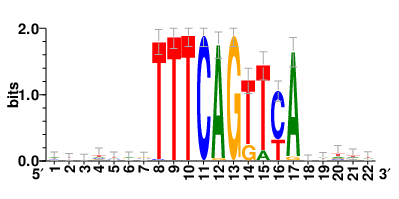
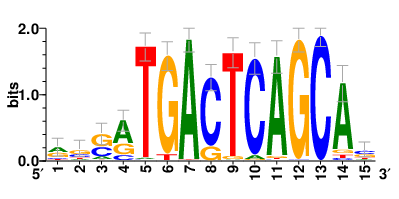
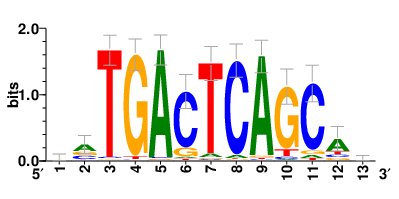
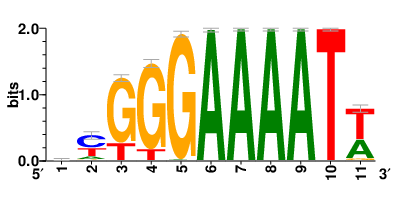
| In the post-treatment samples, the motifs and TFs that regulate drug resistance-related DEGs for each cell type are shown here. (Complete files can be downloaded from the download section.) |
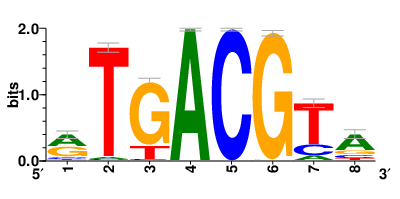
| Motifs and TFs regulating up-regulated DEGs in resistant group of the post-treatment samples |
| motif | motif | NES | AUC | TF_highConf | Cell_type |
 | metacluster_22.13 | 5.1 | 0.117 | MAFK (inferredBy_Orthology). | CD4+ T cells |
 | metacluster_22.36 | 4.98 | 0.115 | BACH2 (directAnnotation). | CD4+ T cells |
 | kznf__ZNF485_Imbeault2017_RP_RCADE | 4.93 | 0.114 | ZNF485 (directAnnotation). | CD4+ T cells |
 | metacluster_22.37 | 4.79 | 0.111 | BACH1 (directAnnotation). | CD4+ T cells |
 | transfac_pro__M06849 | 4.7 | 0.109 | ZNF528 (directAnnotation). | CD4+ T cells |
 | metacluster_22.19 | 4.66 | 0.109 | NFE2 (directAnnotation). | CD4+ T cells |
 | transfac_pro__M01229 | 4.56 | 0.107 | GTF2IRD1 (directAnnotation). | CD4+ T cells |
 | metacluster_22.34 | 4.54 | 0.106 | BACH2 (directAnnotation). | CD4+ T cells |
 | transfac_pro__M05636 | 4.54 | 0.106 | ZNF134; ZNF154; ZNF256; ZNF304; ZNF418; ZNF419; ZNF480; ZNF548; ZNF549; ZNF552; ZNF561; ZNF562; ZNF584; ZNF586; ZNF587B; ZNF610; ZNF772; ZNF773; ZNF792; ZNF793; ZNF837 (inferredBy_Orthology). | CD4+ T cells |
 | metacluster_84.7 | 4.53 | 0.106 | RARA (directAnnotation). | CD4+ T cells |
| Page: 1 2 3 4 5 6 7 8 9 10 11 12 13 14 15 16 17 18 19 20 21 22 23 24 25 26 27 28 29 30 31 32 33 34 35 36 37 38 39 40 41 42 43 44 45 46 47 48 49 50 51 52 53 54 55 56 57 58 59 60 61 62 63 64 65 66 67 68 69 70 71 72 73 74 75 76 77 78 79 |
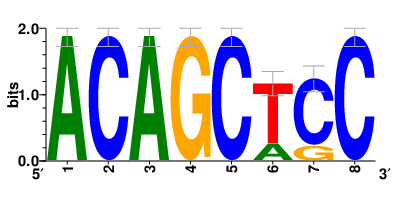
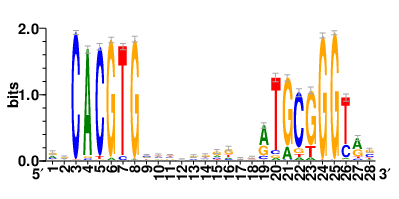
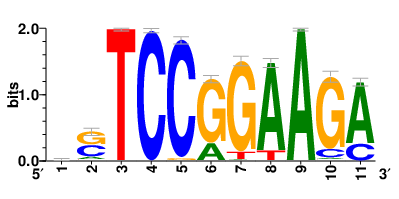
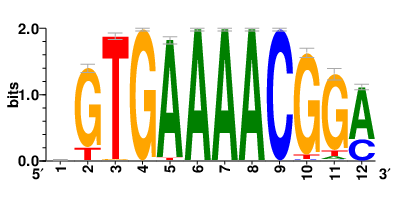
| Motifs and TFs regulating down-regulated DEGs in resistant group of the post-treatment samples |
| motif | motif | NES | AUC | TF_highConf | Cell_type |
 | taipale_tf_pairs__ERF_HOXA3_RSCGGAWNNNNNNNYMATTA_CAP_repr | 6.53 | 0.124 | ERF; HOXA3 (directAnnotation). | CD4+ T cells |
 | jaspar__MA0604.1 | 6.14 | 0.117 | ATF1 (inferredBy_Orthology). | CD4+ T cells |
 | transfac_pro__M05894 | 5.42 | 0.105 | ZNF565 (directAnnotation). | CD4+ T cells |
 | taipale_tf_pairs__ETV2_HOXA2_NCCGGAAGNNNNNNYMATTA_CAP | 5.31 | 0.103 | ETV2; HOXA2 (directAnnotation). | CD4+ T cells |
 | transfac_pro__M06317 | 5.31 | 0.103 | ZNF829 (directAnnotation). | CD4+ T cells |
 | taipale_cyt_meth__ZNF385D_NCGTCGCGACGN_eDBD_repr | 4.97 | 0.0976 | ZNF385D (directAnnotation). | CD4+ T cells |
 | transfac_pro__M06569 | 4.89 | 0.0961 | ZNF775 (directAnnotation). | CD4+ T cells |
 | taipale_tf_pairs__ELF2_NATGCGGAAGTR_HT | 4.79 | 0.0945 | ELF2 (directAnnotation). | CD4+ T cells |
 | cisbp__M01725 | 4.57 | 0.0908 | SREBF2 (inferredBy_Orthology). | CD4+ T cells |
 | jaspar__MA1509.1 | 4.28 | 0.086 | IRF6 (directAnnotation). | CD4+ T cells |
| Page: 1 2 3 4 5 6 7 8 9 10 11 12 13 14 15 16 17 18 19 20 21 22 23 24 25 26 27 28 29 30 31 32 33 34 35 36 37 38 39 40 41 42 43 44 45 46 47 48 49 50 51 52 53 54 55 56 57 58 59 60 61 62 63 64 65 66 67 68 |
| This dataset only has one patient or is a cell line dataset, the resistant sample is the post-treatment sample and the sensitive sample is the pre-treatment sample. Motifs and TFs that regulate drug resistance-related DEGs for each cell type are shown here. (Complete files can be downloaded from the download section.) |
Top |
Differentially expressed genes act as transcription factors |
| This table shows the differentially expressed genes that act as transcription factors. (Complete files can be downloaded from the download section.) |
| TF | motif | Expression | Cell type | Timepoint |
FOS | tfdimers__MD00090 | up | CD4+ T cells | post |
FOS | metacluster_50.1 | up | CD4+ T cells | post |
FOS | metacluster_137.2 | up | CD4+ T cells | post |
FOS | metacluster_157.2 | up | cDCs | post |
JUN | metacluster_157.2 | up | cDCs | post |
JUNB | metacluster_157.2 | down | cDCs | post |
CEBPD | taipale_tf_pairs__FLI1_CEBPD_RNCGGANNTTGCGCAAN_CAP | down | cDCs | post |
IRF1 | tfdimers__MD00527 | down | cDCs | post |
FOS | tfdimers__MD00475 | up | Erythrocytes | post |
FOS | tfdimers__MD00141 | up | Erythrocytes | post |
| Page: 1 |
| 1 | "Sun X, Zhang Y, Li H, Zhou Y, Shi S, Chen Z, He X, Zhang H, Li F, Yin J, Mou M, Wang Y, Qiu Y, Zhu F. DRESIS: the first comprehensive landscape of drug resistance information. Nucleic Acids Res. 2023 Jan 6;51(D1):D1263-D1275. doi: 10.1093/nar/gkac812. PMID: 36243960; PMCID: PMC9825618." |
| 2 | "Wishart DS, Feunang YD, Guo AC, Lo EJ, Marcu A, Grant JR, Sajed T, Johnson D, Li C, Sayeeda Z, Assempour N, Iynkkaran I, Liu Y, Maciejewski A, Gale N, Wilson A, Chin L, Cummings R, Le D, Pon A, Knox C, Wilson M. DrugBank 5.0: a major update to the DrugBank database for 2018. Nucleic Acids Res. 2018 Jan 4;46(D1):D1074-D1082. doi: 10.1093/nar/gkx1037. PMID: 29126136; PMCID: PMC5753335." |

Copyright 2022-Present -The University of Texas Health Science Center at Houston |