
|
Home |
Download & Upload |
Statistics |
Landscape |
Help |
Contact |
Navigation
1. Description of CRISPRoffT1.1 Data acquisition
1.2 Data processing
1.3 Delivery method
2. Understanding annotation of CRISPRoffT
2.1 Search by guide senquence
2.1.1 Description of the guide sequence
2.1.2 Potential off-target overlap and comparative analysis of this guide sequence
2.1.3 Summary table of potential off-target sites for this guide sequence
2.1.4 Comparative analysis of validated off-targets for this guide sequence
2.2 Search by gene name
2.2.1 Different sites targeting this gene
2.2.2 The on-target site status of this gene
2.2.3 Summary table of this gene as an on-target and potential off-target
2.3 Search by target sequence
2.3.1 Description of this sequence
2.3.2 Summary table of this sequence as an on-target
2.3.3 Summary table of this sequence as an on-target and potential off-target
2.4 Search by target region
2.4.1 On-target sites within this chromosome region
2.4.2 Off-target sites within this chromosome region
2.4.3 Summary table of on-target and potential off-target sites within this region
2.5 Browse by source
2.5.1 Description of this source
2.5.2 Summary table of on-target sites experimented on this source
2.5.3 Comparative analysis of potential off-target number and validated off-target ratio for different on-target sites experimented on this source
2.5.4 Summary table of on-target and potential off-target sites experimented on this source
2.6 Browse by technology
2.6.1 Description of this technology
2.6.2 Summary table of on-target sites using this technology
2.6.3 Comparative analysis of potential off-target number and validated off-target ratio for different on-target sites using this technology
2.6.4 Summary table of on-target and potential off-target sites using this technology
2.7 Browse by Cas enzyme and guide RNA combination
2.7.1 Description of this Cas enzyme and guide RNA
2.7.2 Summary table of on-target sites using this Cas/gRNA combination
2.7.3 Comparative analysis of potential off-target number and validated off-target ratio for different on-target sites using this Cas/gRNA combination
2.7.4 Summary table of on-target and potential off-target sites using this Cas/gRNA combination
3. Download data and contact us
The current version of the CRISPRoffT database includes 226,298 potential off-targets for 371 guide-RNA sequences. These sequences have been predicted by 29 technologies and manually collected from 74 studies. Out of these, 8,940 predicted off-targets have undergone experimental validation. The database encompasses 85 different nuclease/gRNA combinations across 3 CRISPR systems and includes 35 different cell lines, cell types, or tissues from Homo sapiens and Mus musculus. All on- and off-targets are filled to complete sequences, including PAM sequences, and are annotated with genomic coordinates and gene names. Our database also conducts comparative analysis under different conditions for each guide sequence, gene, cell type, technology, and Cas/gRNA combination, respectively. These data will be helpful in building precise CRISPR off-target prediction models. CRISPRoffT will serve as an important resource for studying CRISPR/Cas off-targets, and can promote the application of CRISPR/Cas in drug development and clinical disease treatment.
We collected 29 off-targets of CRISPR/Cas prediction technologies, 371 guide sequences, 85 combinations of Cas enzymes and sgRNAs, and 35 cell lines, cell types or tissues from 74 studies. We first searched for studies on PMC using the keywords "CRIPSR AND off-target". This excludes pure on-target studies, pure gene knock-out screen studies and most studies done on whole gRNA libraries. If the original file is not provided in xlsx format, use the online PDF to csv conversion tool to convert it. The potential and validated off-targets data were manually curated. We manually extracted the cleavage frequencies and a series informations (including dilivery method, time, targeted deep sequence method, dilivery method and time.) from the references.
Missing genomic location information was filled in using the Bowtie tool. For sequences which do not include PAM sequence, first, obtain the genomic location of the sequence, then expand the genomic location according to the strand provided in the original studies, and then use bedtools to obtain the corresponding sequence. To annotate targets with the matching gene name, we retrieve the fa files for the respective genomes from the GENCODE and Enzembl database, extract the gene annotations and convert them to bed format. Then use bedtools to annotate gene symbol according to chromosome location.
In order to be able to scrutinise the effect of the delivery method of the CRISPR machinery into cells, the database contains a column characterising the mode of delivery (lipofection/electroporation/others).
The user can search for a guide sequence to obtain all the information involved in that guide sequence. The length of these sequences depends on the Cas enzyme and the sgRNA; for example, the guide sequence for wild-type Cas9 is 23 nucleotides long, while the guide sequence for wild-type Cpf1 (Cas12a) is 24 nucleotides long.

For example, search for GGAATCCCTTCTGCAGCACCTGG. The annotation page for this guide sequence will be displayed.

2.1.1 Description of the guide sequence
The on-target gene site, gene name, location and genome version for this guide sequence are provided here, because a gene may have multiple different on-target sites.

2.1.2 Potential off-target overlap and comparative analysis of this guide sequence
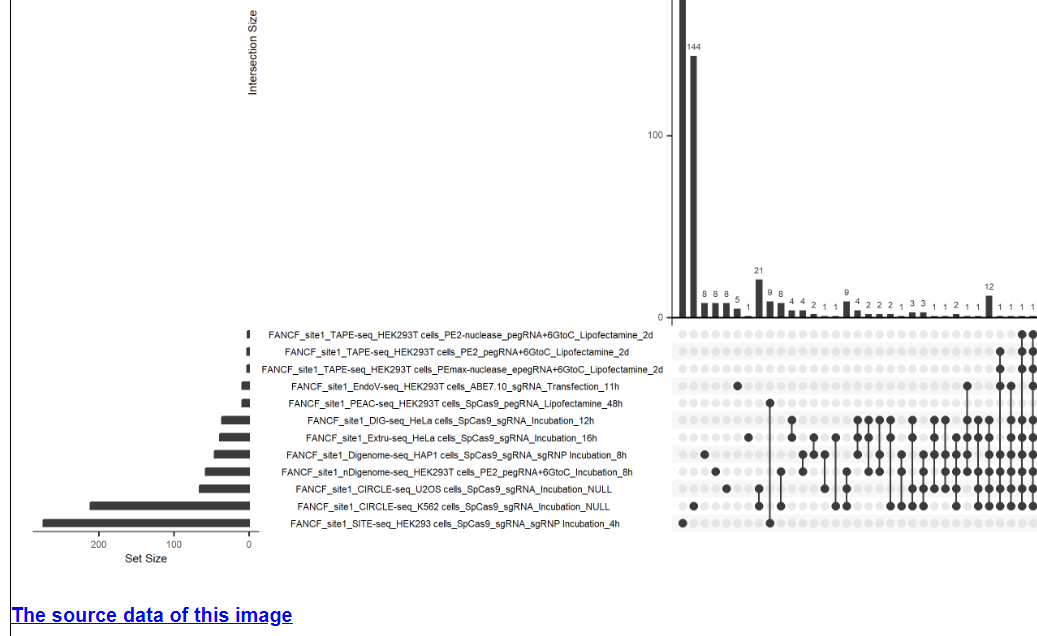
This module provides potential off-target overlap and comparative analysis of each guide sequence under different technologies and conditions. If this guide sequence was used in only one technology, a Venn diagram will be displayed below. If this guide sequence was used in more than one technology, an UpSet plot will be displayed below. The first figure shows the X-axis legend. If the number of Y-axis variables exceeds 10 or 20, it will be split into multiple images. For the UpSet plot, the left side of the lower half shows the number of potential off-targets sites for the guide sequence for different technologies and experimental conditions, and the right side of the upper and lower halves show the number of overlapping sites for different technologies and experimental conditions. In a Venn diagram, the number inside the circle is the number of potential off-target sites, and the technology and condition is annotated above the circle.

2.1.3 Summary table of potential off-target sites for this guide sequence
This table provides comprehensive information on all on-target sites and off-target sites of this guide sequence. If an off-target is validated by targeted deep sequencing as a true off-target, the Validation column will be annotated as TRUE. If an off-target is validated as a false off-target or PCR fails, the Validation column will be annotated as FALSE. If an off-target is not validated, the Validation column will be left blank. Only 20 rows of data are shown here. You can download the entire table using the link at the bottom of the table.
2.1.4 Comparative analysis of validated off-targets for this guide sequence
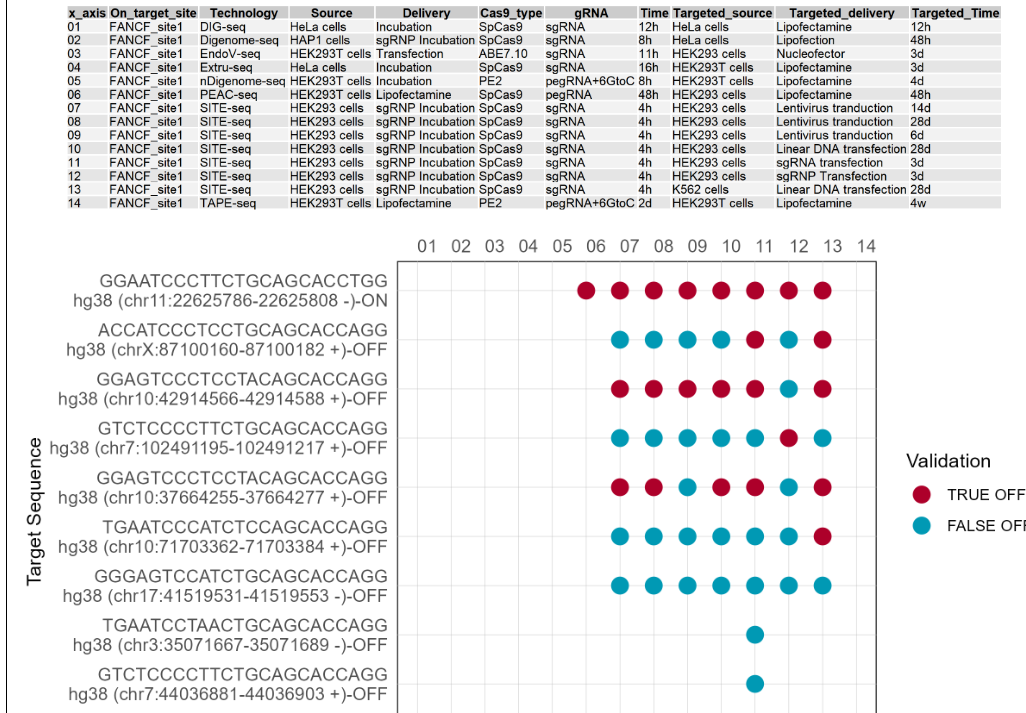
Comparative results of validated off-targets for one guide sequence under different technologies and conditions are provided. If there is no validated off-targets for this guide sequence, nothing will be showed. The first figure shows the X-axis legend. If the number of Y-axis variables exceeds 10, it will be split into multiple images. The Y-axis includes the different on-target and off-target sequences of this guide sequence, and the X-axis includes the different numbers starting from 01. Each number represents a technology and condition, and the annotations are on top of the dot plot. Red dots indicate that the target site has been validated as a true target site by targeted deep sequencing. Blue dots indicate that the target site was validated as a false target site by targeted deep sequencing.(If the image exists, the user can click on it to enlarge it in a new window, as well as click on the link below the image to download and view the source data for that image.)
Users can search for gene-related on-target and off-target information by gene symbol. If you want to search for a Homo sapiens gene, please first select 'Homo sapiens', and then use the correct gene symbol, such as 'FANCF'. The same applies to Mus musculus, for example, 'Pcsk9'.

For example, search for FANCF. The annotation page for this gene will be displayed.

2.2.1 Different sites targeting this gene
Different on-target sites, guide sequences, target region and genome version targeting this gene are provided here. because a gene may have multiple different on-target sites.

2.2.2 The on-target site status of this gene
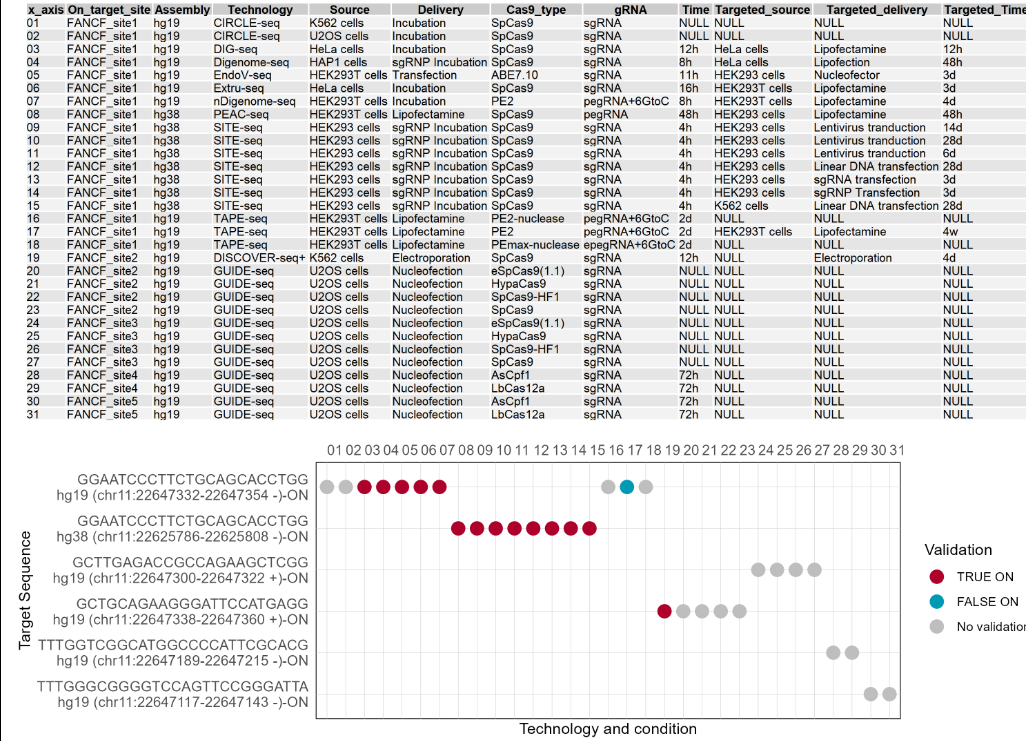
The dot plot shows the on-target site status of this gene under different technologies and conditions. The first figure shows the X-axis legend. If the number of Y-axis variables exceeds 10, it will be split into multiple images. The Y-axis includes the different on-target sequences (on-target sites) on the gene, and the X-axis includes the different numbers starting from 01. Each number represents a technology and condition, and and the annotations are on top of the dot plot. Red dots indicate that the target site has been validated as a true target site by targeted deep sequencing. Blue dots indicate that the target site was validated as a false target site by targeted deep sequencing. Gray dots indicate that the target site has not been validated by targeted deep sequencing.
2.2.3 Summary table of this gene as an on-target and potential off-target
This table provides comprehensive information on all on-target sites and off-target sites of this gene. If an off-target is validated by targeted deep sequencing as a true off-target, the Validation column will be annotated as TRUE. If an off-target is validated as a false off-target or PCR fails, the Validation column will be annotated as FALSE. If an off-target is not validated, the Validation column will be left blank. Only 20 rows of data are shown here. You can download the entire table using the link at the bottom of the table.
Users can search for an on-target sequence or an off-target sequence. The length of these sequences depends on the Cas enzyme and sgRNA. For example, the guide sequence for the wild type Cas9 is 23 nucleotides long, while the wild type Cpf1 (Cas12a) has a guide sequence of 24 nucleotides.

For example, search for GGAGTCCCTCCTGCAGCACCTGA. The annotation page for this sequence will be displayed.

2.3.1 Description of this sequence
The chromosome location, assembly and gene to which this sequence belongs are provided.

2.3.2 Summary table of this sequence as an on-target
If this sequence is on-target, the table will show the chromosome location, on-target sites, assembly and gene.

2.3.3 Summary table of this sequence as an on-target and potential off-target
This table provides comprehensive information on this sequence as an on-target site and potential off-target site under differnt technologies and conditions. If an off-target is validated by targeted deep sequencing as a true off-target, the Validation column will be annotated as TRUE. If an off-target is validated as a false off-target or PCR fails, the Validation column will be annotated as FALSE. If an off-target is not validated, the Validation column will be left blank.
Users can search for a chromosome location range for certain species by using the standard format. They can then retrieve on-targets and off-targets located within this specified region. If you want to search for chr11:22625786-22625808 in hg38, please first select 'hg38', and then use the standard format, such as 'chr11:22625000-22625808'.

For example, search for chr11:22625000-22625808 for hg38. The annotation page for this sequence will be displayed.

2.4.1 On-target sites within this chromosome region
If there is a on-target site located within this range of the location, the sequence, chromosomal location, assembly, and gene of the on-target sites are shown here.

2.4.2 Off-target sites within this chromosome region
Different sites and guide sequences targeting this gene are provided here because a gene may have multiple different targeting sites.

2.4.3 Summary table of on-target and potential off-target sites within this region
This table provides comprehensive information on all on-target sites and off-target sites of this gene. If an off-target is validated by targeted deep sequencing as a true off-target, the Validation column will be annotated as TRUE. If an off-target is validated as a false off-target or PCR fails, the Validation column will be annotated as FALSE. If an off-target is not validated, the Validation column will be left blank.
Users can browse by different cell lines, cell types and tissues from Homo sepiens and Mus musclulus. Each entry shows comprehensive information about the technologies, on-targets, and off-targets for which the experiment was performed in this cell type or tissue.

For example, click on 293T cells. The annotation page for this cell line will be displayed.

2.5.1 Description of this source
The name and species of this source are provided.

2.5.2 Summary table of on-target sites experimented on this source
The sequence, chromosomal region, assembly and gene name of on-target sites for experiments in this cell type are provided here.

2.5.3 Comparative analysis of potential off-target number and validated off-target ratio for different on-target sites experimented on this source
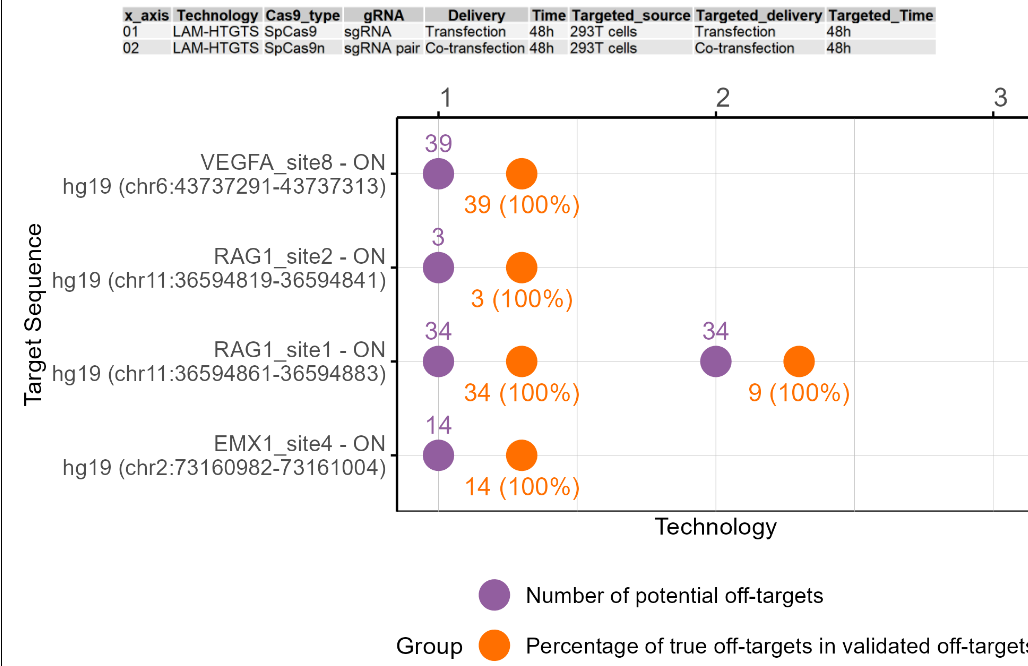
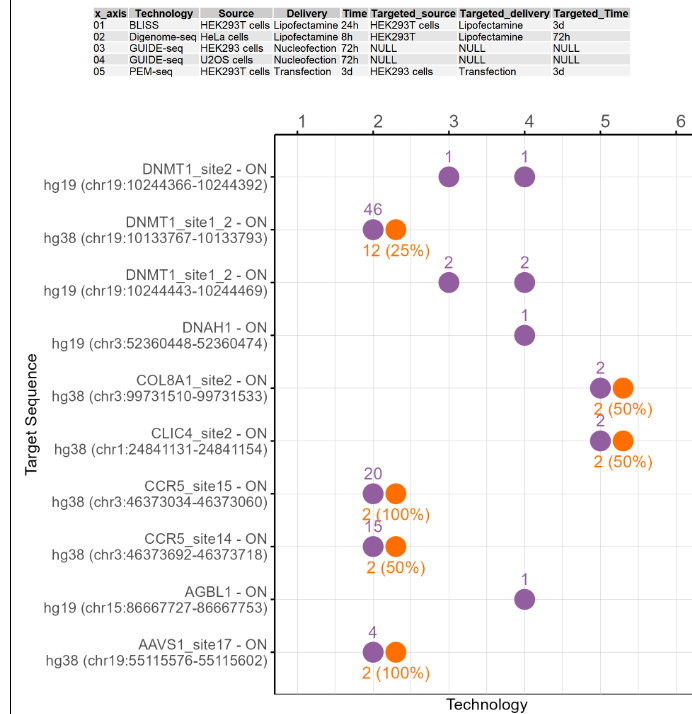
The dot plot shows the potential off-target number and validated off-target ratio for different on-target sites experimented on this cell line, cell type, or tissue under different technologies and conditions. The first figure shows the X-axis legend. If the number of Y-axis variables exceeds 10 or 20, it will be split into multiple images. The Y-axis includes the on-target sites for experimentation in this cell type or tissue, and the X-axis includes the different numbers starting from 1. Each number represents a technology and condition used in this cell type, and and the annotations are on top of the dot plot. includes the different technologies and conditions used in this cell type. The purple dots represent the potential off-target sites detected, and the orange dots represent the proportion of true off-target sites after validation. The number above the purple dot represents the number of potential off-target sites. The number below the orange dot represents the proportion of true off-target sites after validation. If there are only purple dots, it indicates that no targeted deep sequencing has been performed. If the image exists, the user can click on it to enlarge it in a new window, as well as click on the link below the image to download and view the source data for that image.
2.5.4 Summary table of on-target and potential off-target sites experimented on this source
This table provides comprehensive information on all on-target sites and off-target sites experimented in this cell type or tissue. If an off-target is validated by targeted deep sequencing as a true off-target, the Validation column will be annotated as TRUE. If an off-target is validated as a false off-target or PCR fails, the Validation column will be annotated as FALSE. If an off-target is not validated, the Validation column will be left blank. Only 20 rows of data are shown here. You can download the entire table using the link at the bottom of the table.
Users can browse by different experimental CRISPR/Cas off-target prediction technologies. Each entry shows comprehensive cell line, tissue, on-target and off-target information using this techonology.
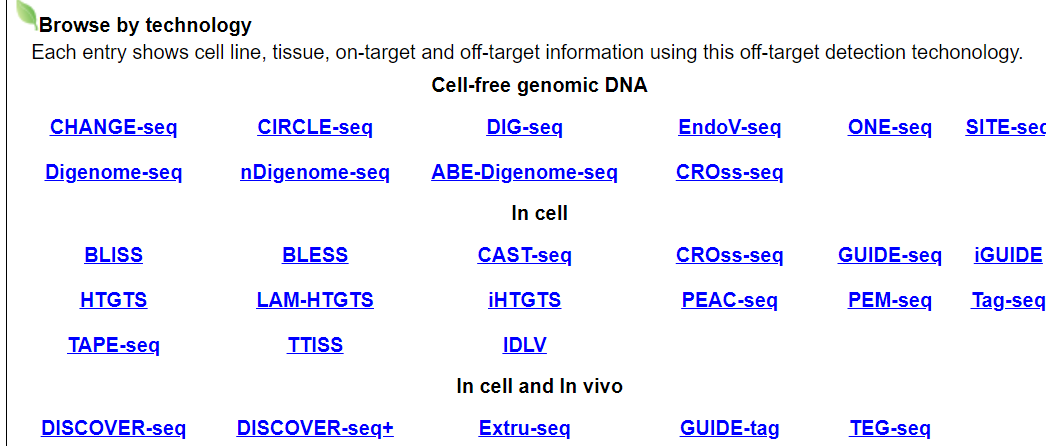
For example, click on CHANGE-seq. The annotation page for this technology will be displayed.

2.6.1 Description of this technology
The experimetal locaiton are provided, such as cell-free genomic DNA, within cells, or in vivo tissue.

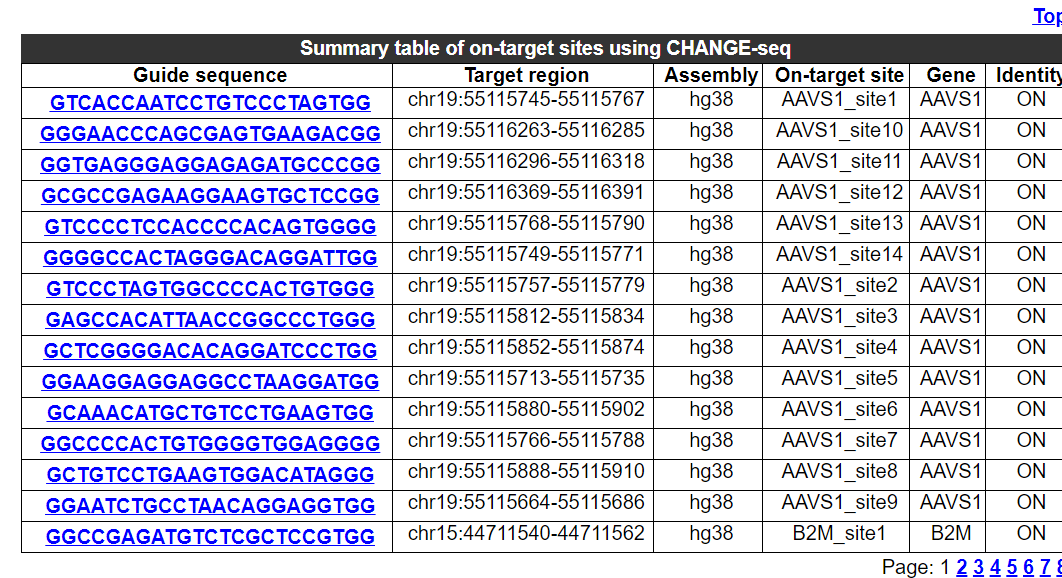
2.6.2 Summary table of on-target sites using this technology
The sequence, chromosome region, assembly and gene name of on-targe sites for experimentation in this technology are provided.
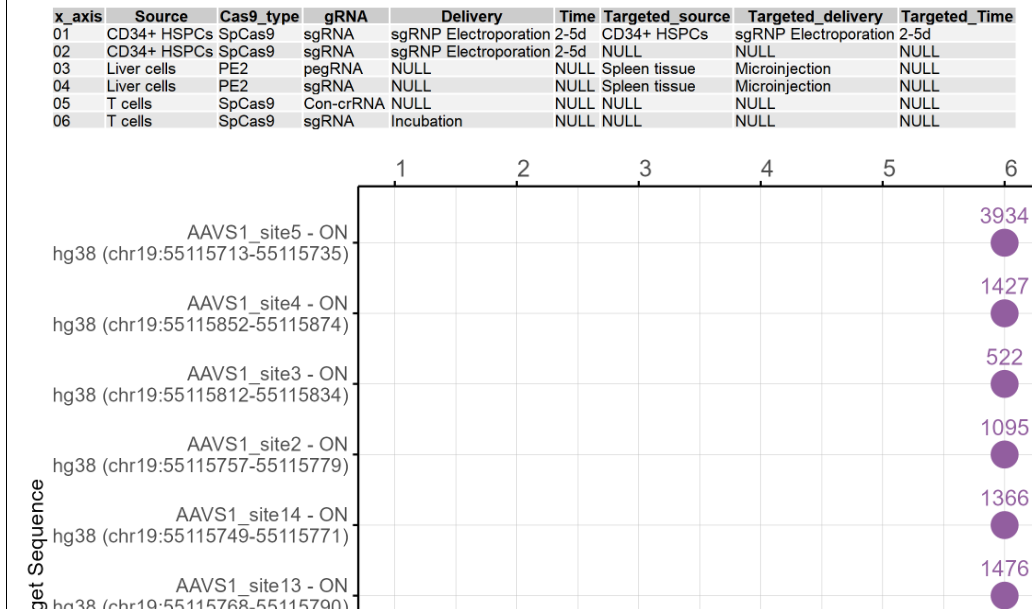
2.6.3 Comparative analysis of potential off-target number and validated off-target ratio for different on-target sites using this technology
The dot plots show the potential off-target number and the validated off-target rate for on-target sites using this techonology under different other conditions. The first figure shows the X-axis legend. If the number of Y-axis variables exceeds 10 or 20, it will be split into multiple images. The Y-axis includes the on-target sites for experimentation in this cell type or tissue, and the X-axis includes the different numbers starting from 1. Each number represents a technology and condition used in this cell type, and and the annotations are on top of the dot plot. includes the different technologies and conditions used in this cell type. The purple dots represent the potential off-target sites detected, and the orange dots represent the proportion of true off-target sites after validation. The number above the purple dot represents the number of potential off-target sites. The number below the orange dot represents the proportion of true off-target sites after validation. If there are only purple dots, it indicates that no targeted deep sequencing has been performed. If the image exists, the user can click on it to enlarge it in a new window, as well as click on the link below the image to download and view the source data for that image.
2.6.4 Summary table of on-target and potential off-target sites using this technology
This table provides comprehensive information on all on-target sites and off-target sites using this technology. If an off-target is validated by targeted deep sequencing as a true off-target, the Validation column will be annotated as TRUE. If an off-target is validated as a false off-target or PCR fails, the Validation column will be annotated as FALSE. If an off-target is not validated, the Validation column will be left blank. Only 20 rows of data are shown here. You can download the entire table using the link at the bottom of the table.
Users can browse by different Cas enzyme and guide RNA combinations. Each entry shows technology, cell line, tissue, on-target and off-target information for using this Cas enzyme and guide RNA combination.
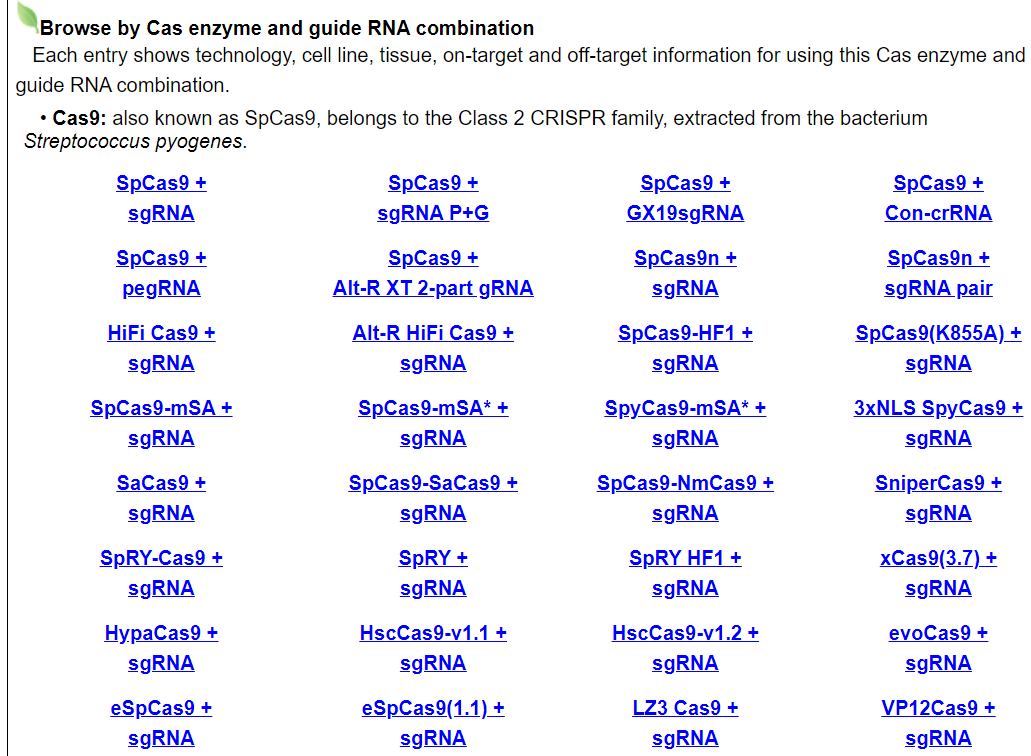
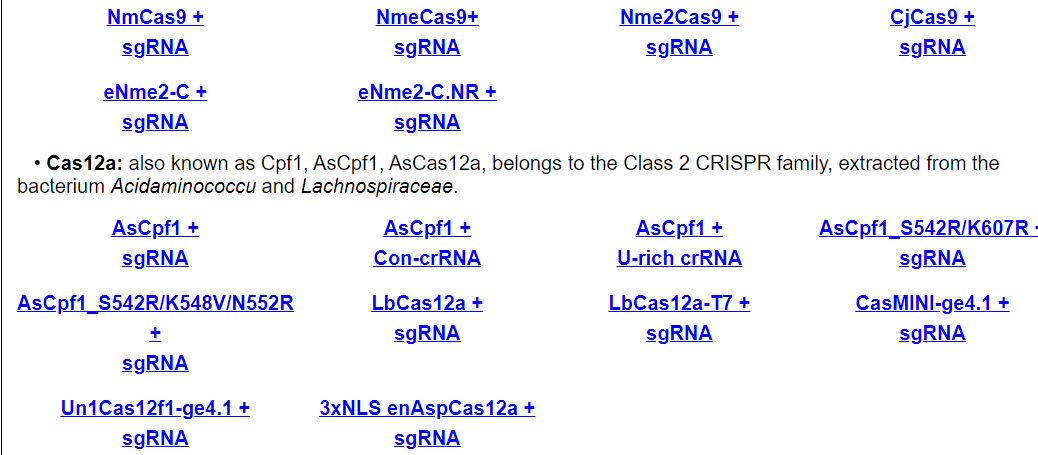
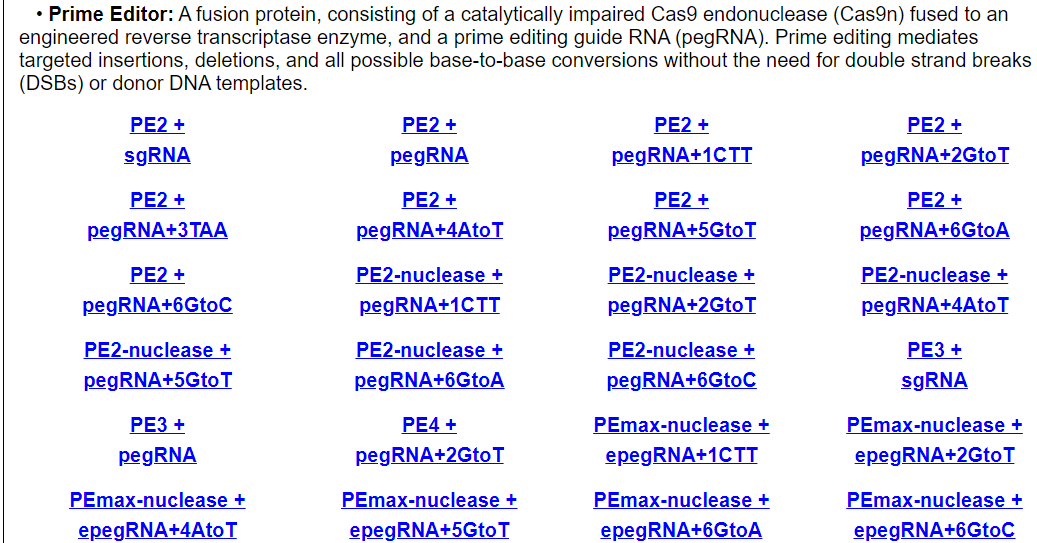
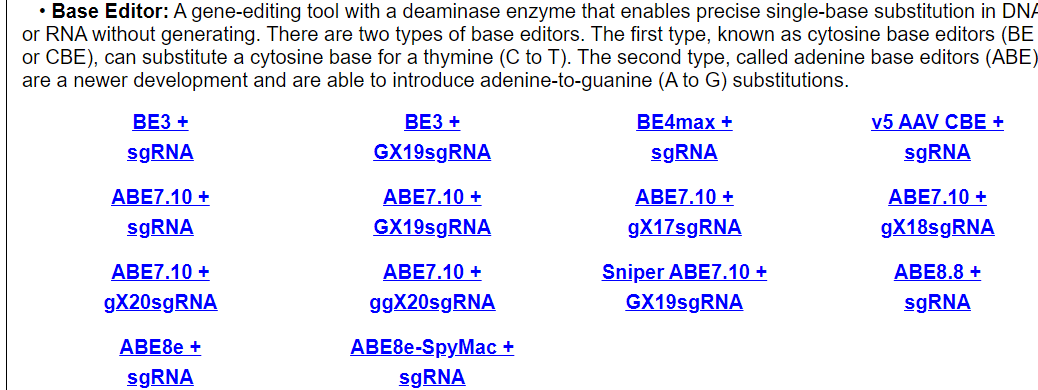
For example, click on AsCpf1 + sgRNA. The annotation page for tthis Cas/gRNA combination will be displayed.

2.7.1 Description of this Cas enzyme and guide RNA
The PAM pattern of this guide RNA are provided.

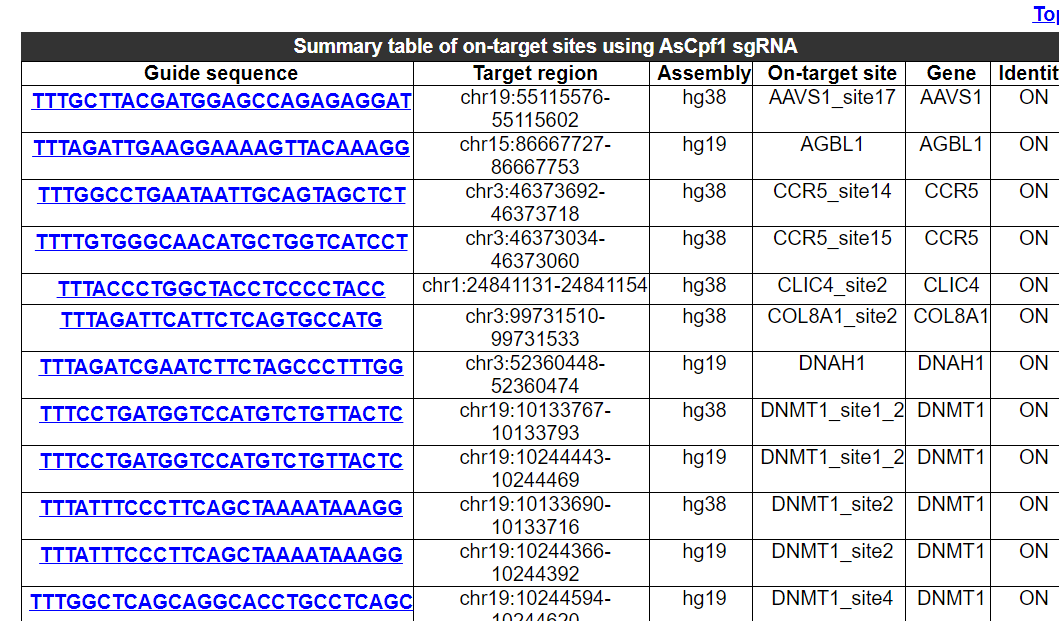
2.7.2 Summary table of on-target sites using this Cas/gRNA combination
The sequence, chromosome region, assembly and gene name of on-targe sites for experimentation in this Cas/gRNA combination are provided.
2.7.3 Comparative analysis of potential off-target number and validated off-target ratio for different on-target sites using this Cas/gRNA combination
The dot plots show the potential off-target number and the validated off-target rate for on-target sites using this Cas/gRNA combination under different technologies and conditions. The first figure shows the X-axis legend. If the number of Y-axis variables exceeds 10 or 20, it will be split into multiple images. The Y-axis includes the on-target sites for experimentation in this cell type or tissue, and the X-axis includes the different numbers starting from 1. Each number represents a technology and condition used in this cell type, and and the annotations are on top of the dot plot. includes the different technologies and conditions used in this cell type. The purple dots represent the potential off-target sites detected, and the orange dots represent the proportion of true off-target sites after validation. The number above the purple dot represents the number of potential off-target sites. The number below the orange dot represents the proportion of true off-target sites after validation. If there are only purple dots, it indicates that no targeted deep sequencing has been performed. If the image exists, the user can click on it to enlarge it in a new window, as well as click on the link below the image to download and view the source data for that image.
2.7.4 Summary table of on-target and potential off-target sites using this Cas/gRNA combination
This table provides comprehensive information on all on-target sites and off-target sites using this Cas/gRNA combination. If an off-target is validated by targeted deep sequencing as a true off-target, the Validation column will be annotated as TRUE. If an off-target is validated as a false off-target or PCR fails, the Validation column will be annotated as FALSE. If an off-target is not validated, the Validation column will be left blank. Only 20 rows of data are shown here. You can download the entire table using the link at the bottom of the table.
Please go to download page and contact page.
