
|
||||||
|
||||||
Statistics and landscape The Statistical results for RNA editing related cancer mechanisms The Statistical results for RNA editing related cancer mechanisms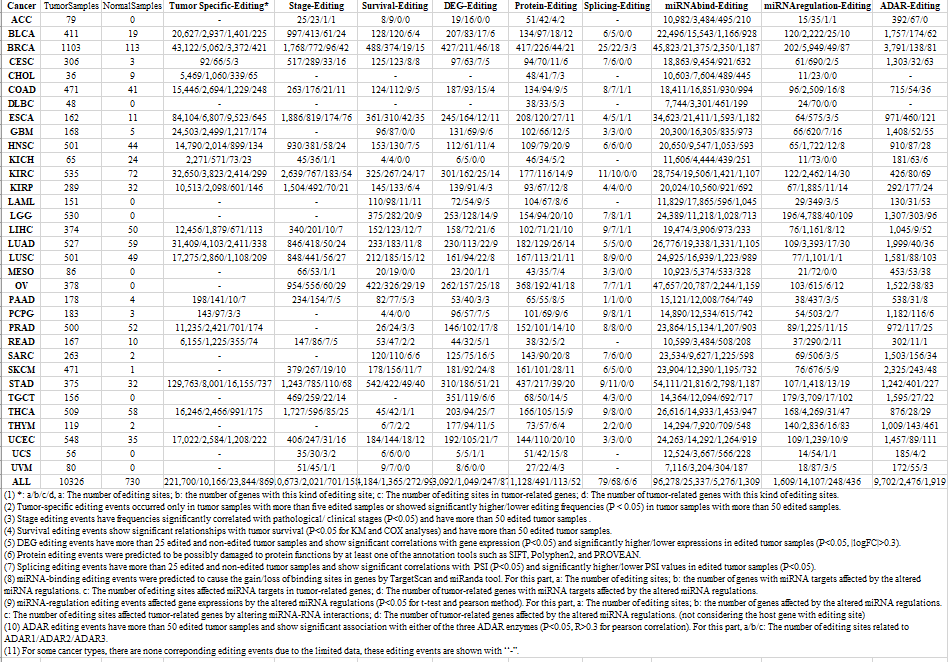 Specific RNA editing events shown in selected tumor samples and none in normal controls Specific RNA editing events shown in selected tumor samples and none in normal controls 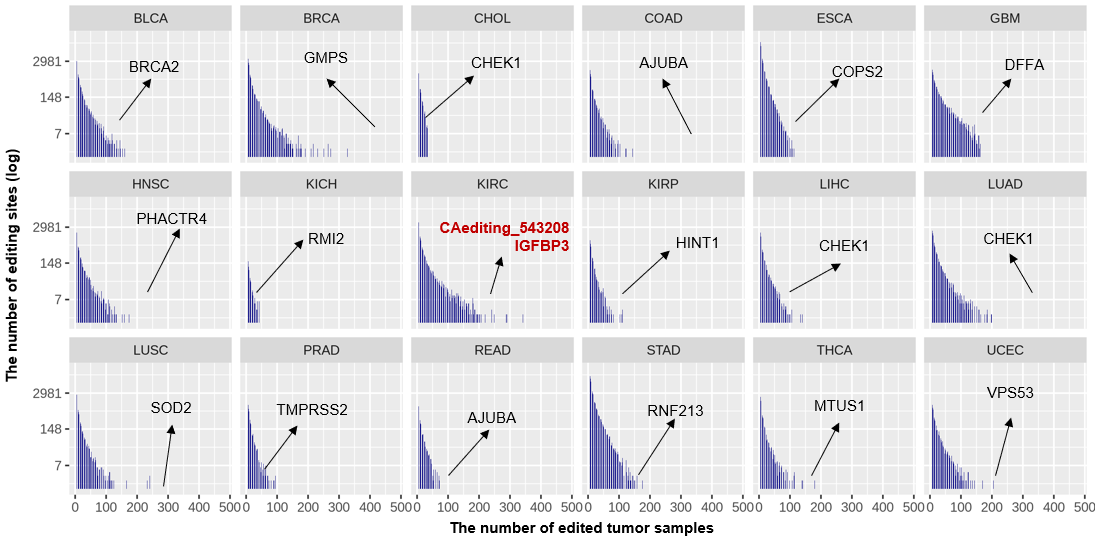 Bubble plot of top tumor specific RNA editing events in tumor-related genes Bubble plot of top tumor specific RNA editing events in tumor-related genes 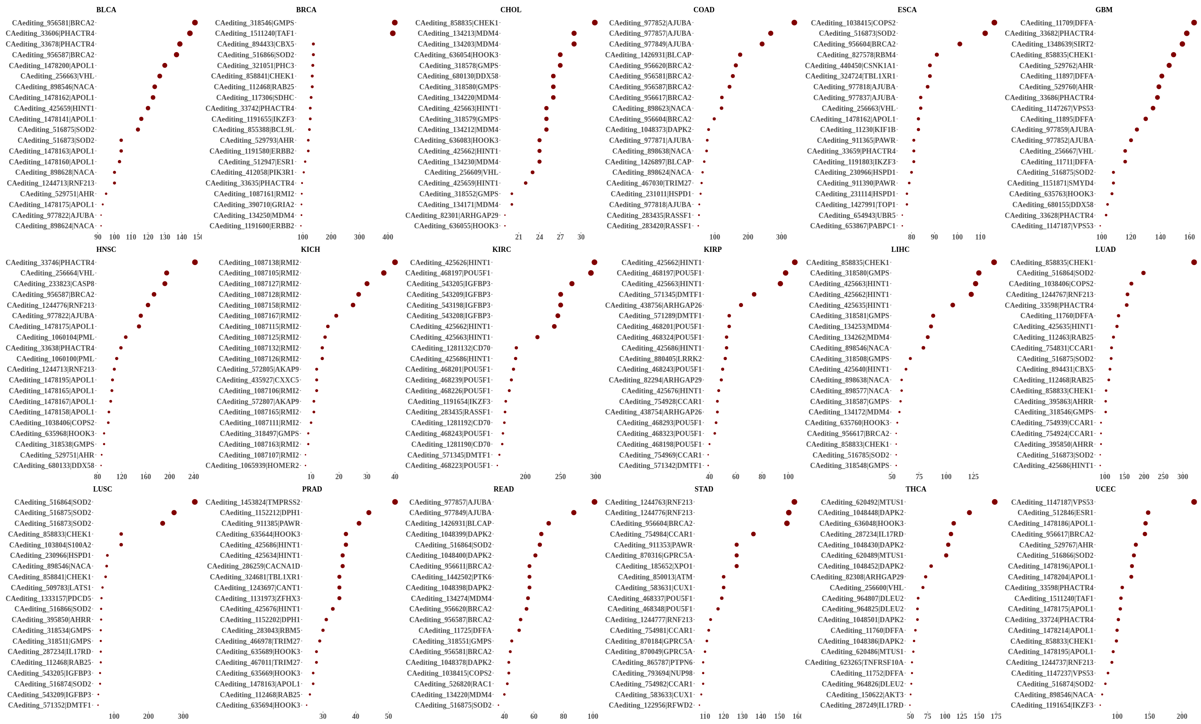 The x-axis shows the number of edited tumor samples, and the y-axis represents the editing events and their host tumor genes. Volcano plots for specific RNA editing events 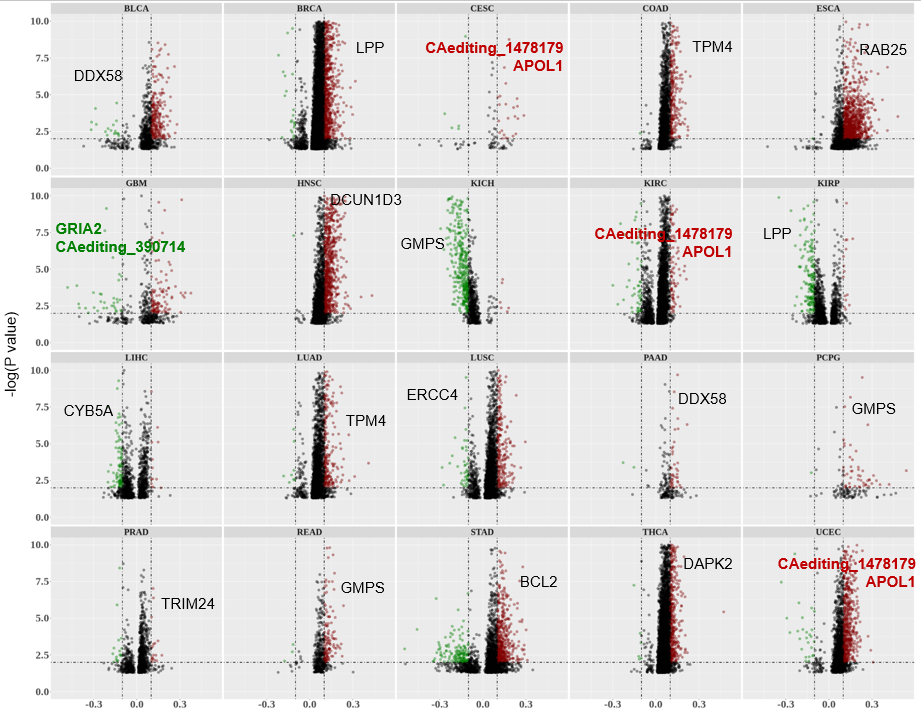 Bubble plot of top specific RNA editing events Bubble plot of top specific RNA editing events 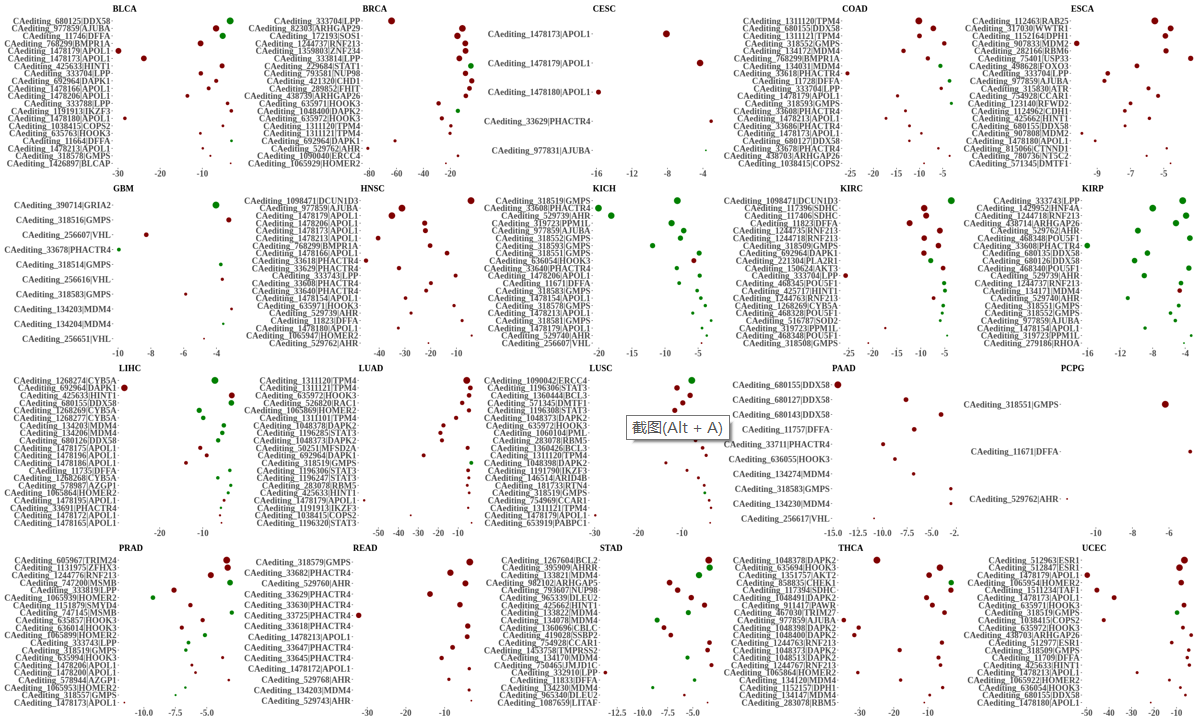 The x-axis shows the log(p) value, and the y-axis represents the editing events and their host tumor genes. The size of each dot denotes the differences of editing frequencies. The red and green dots represent tumor- or normal-specific RNA editing events. Volcano plots for stage-associated RNA editing events 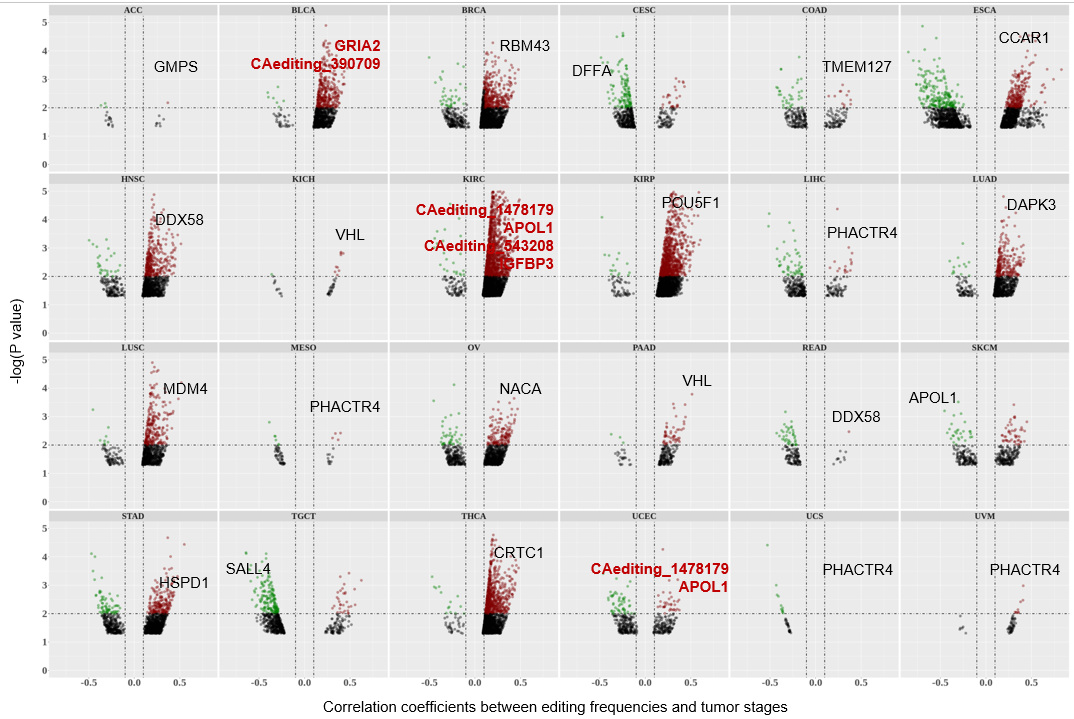 Bubble plot of top stage associated RNA editing events Bubble plot of top stage associated RNA editing events 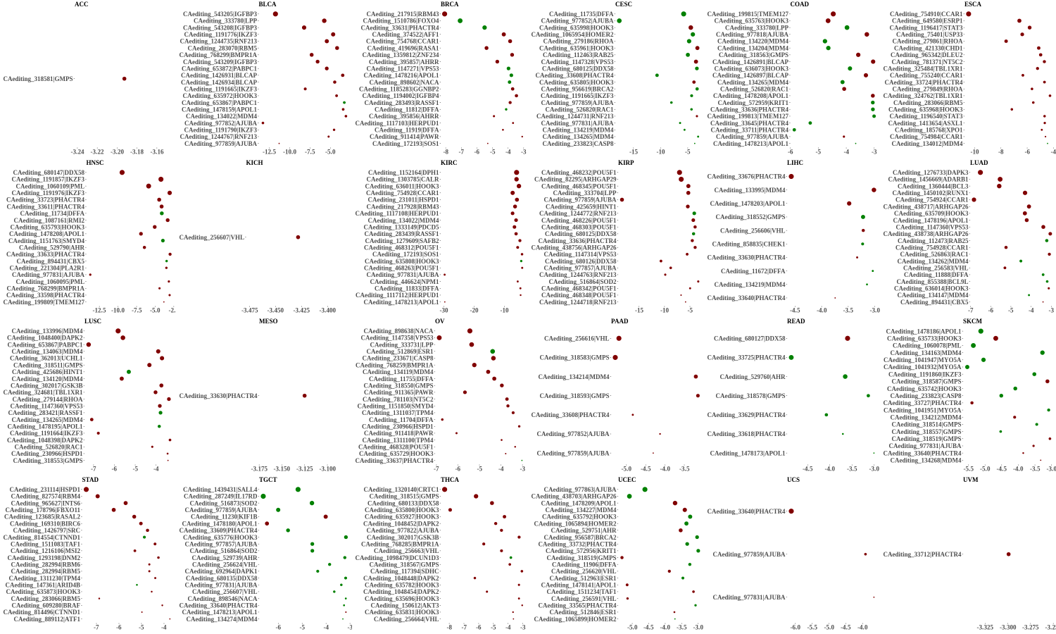 The x-axis shows the log(p) value, and the y-axis represents the editing events and their host tumor genes. The size of each dot denotes the correlation coefficients. The red and green dots represent positive or negative stage-associated RNA editing events. Volcano plots for survival-associated RNA editing events 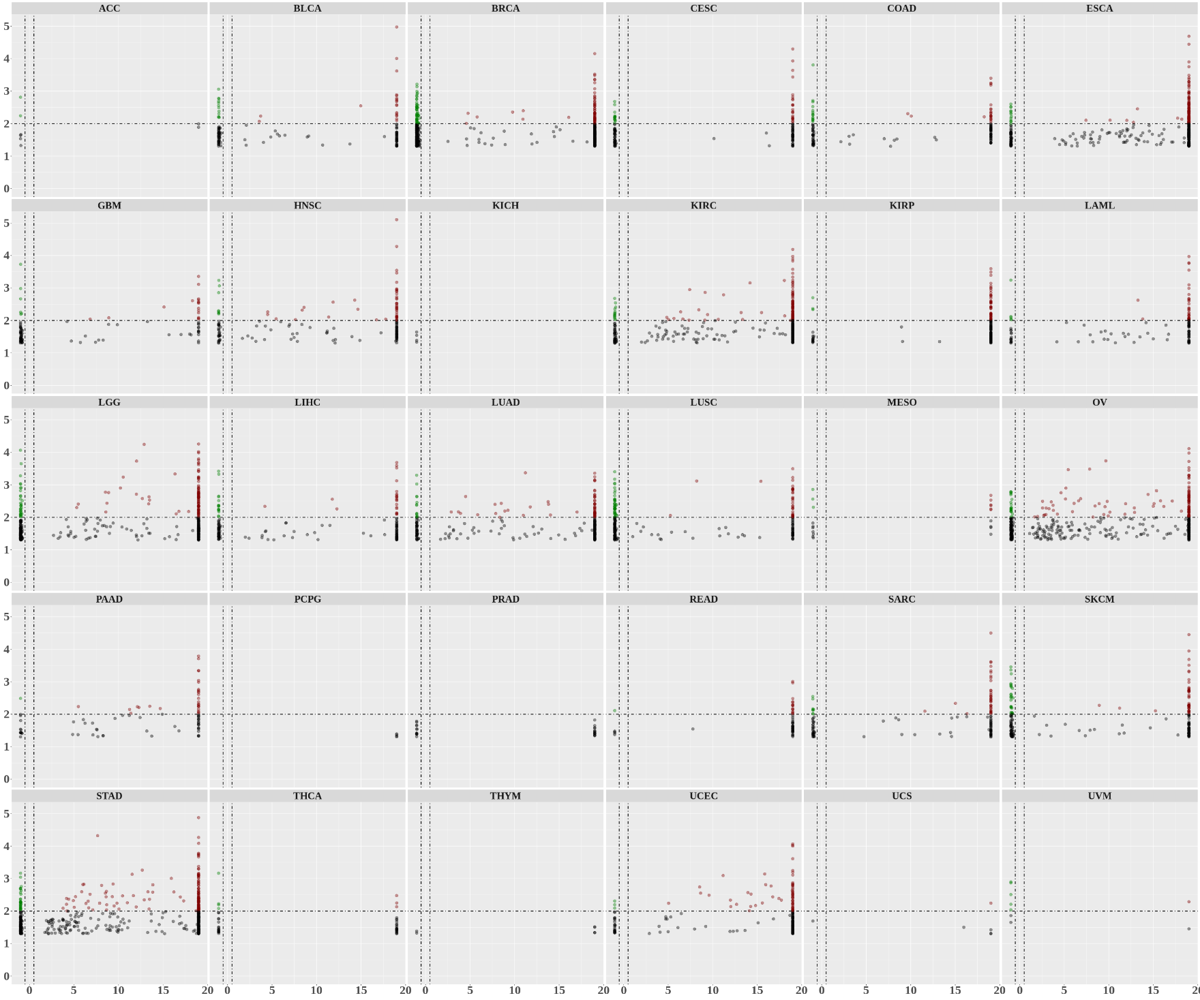 Bubble plot of top survival associated RNA editing events Bubble plot of top survival associated RNA editing events 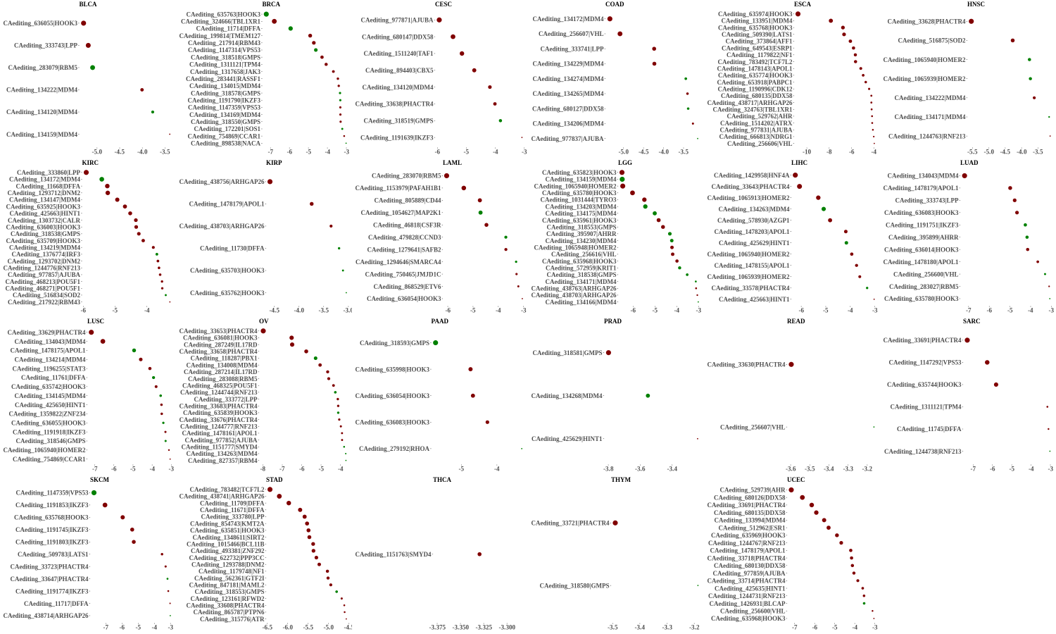 The x-axis shows the log(p) value, and the y-axis represents the editing events and their host tumor genes. The size of each dot denotes –log(p) value. The red and green dots represent high (HR>1) or low (HR<1) risk survival associated RNA editing events. Volcano plots for DEGs-associated RNA editing events 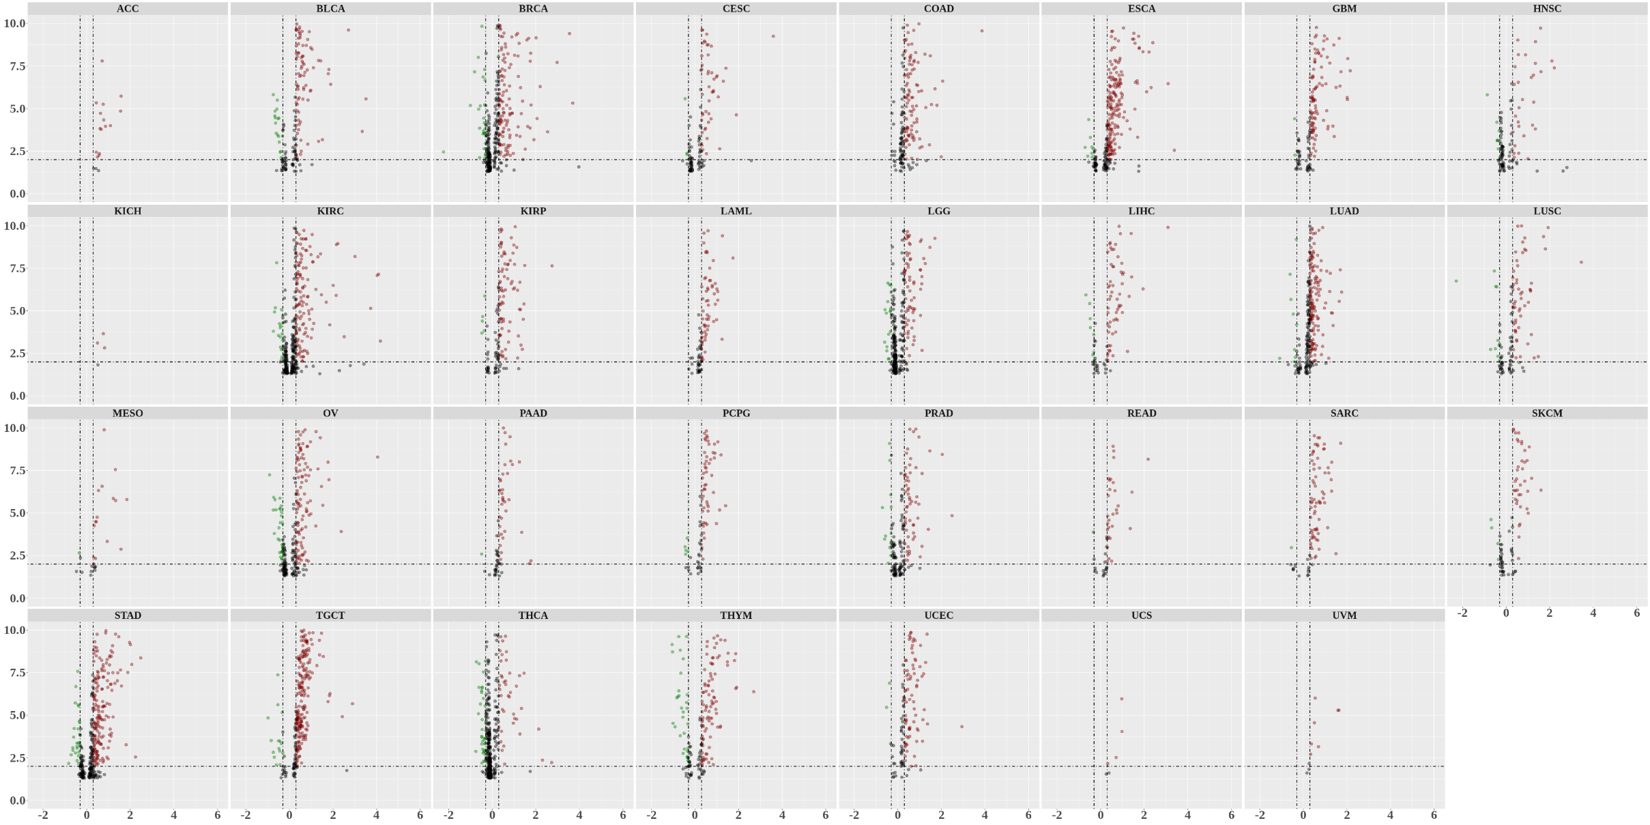 Bubble plot of top DEGs associated RNA editing events Bubble plot of top DEGs associated RNA editing events 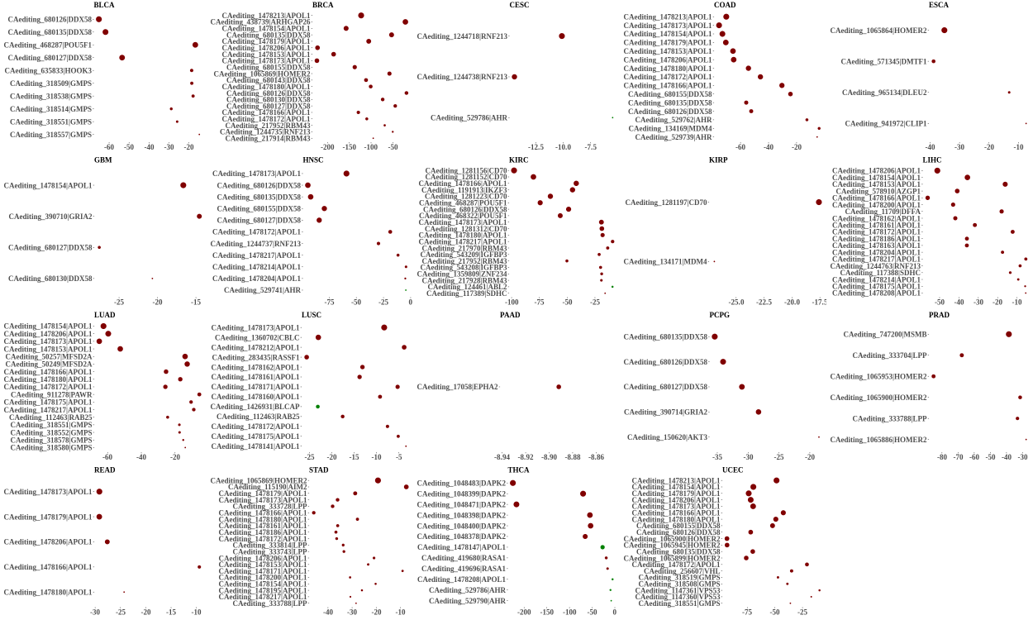 The x-axis shows the log(p) value, and the y-axis represents the editing events and their host tumor genes. The size of each dot denotes the logFC value. The red and green dots represent significantly high/low gene expressions due to RNA editing events. Influence of RNA editing on gene expression 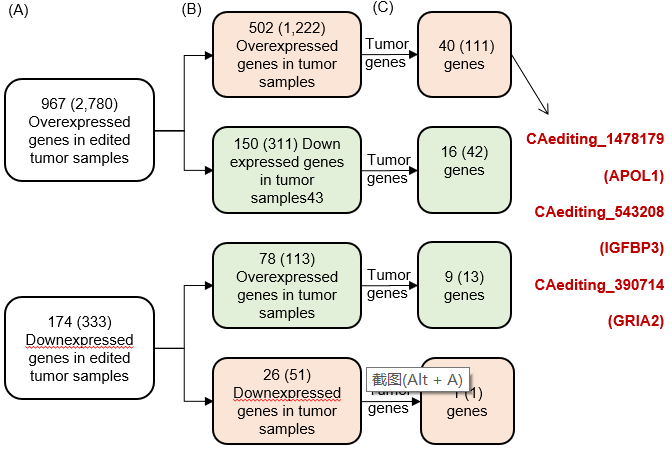 Enrichment KEGG results for the overlapped DEGs Enrichment KEGG results for the overlapped DEGs 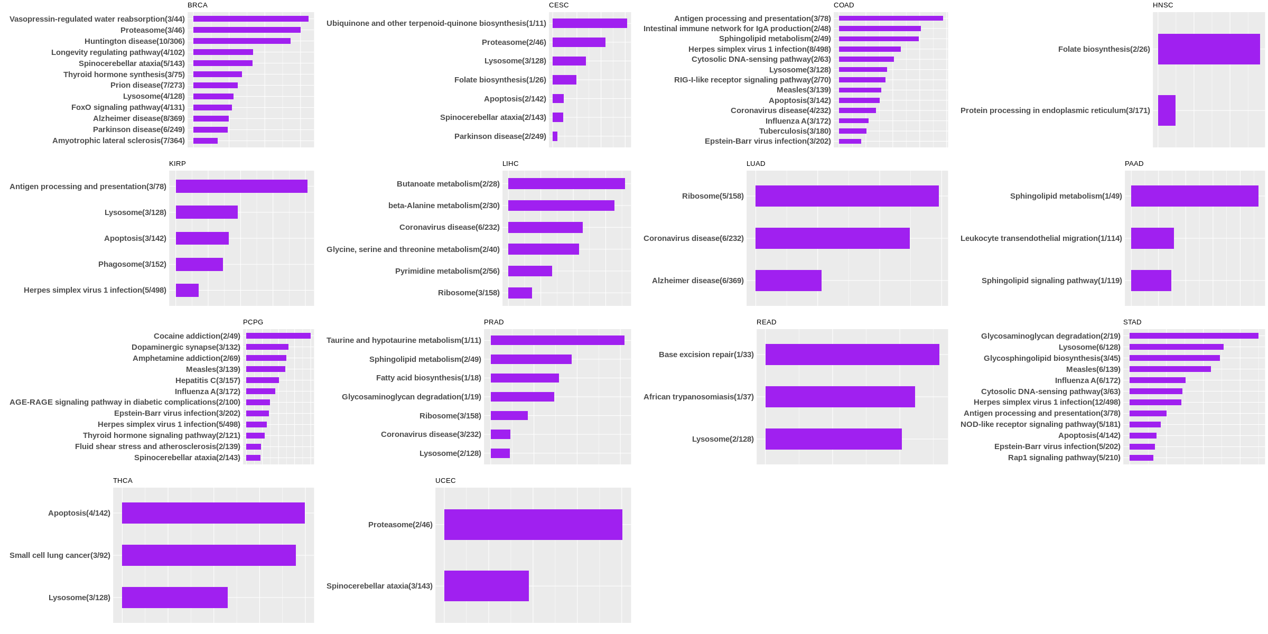 The enrichment KEGG results for the overlapped DEGs for each cancer type. The pathways colored with orange are tumor-related pathways shown in below table2. Tumor-related KEGG pathways 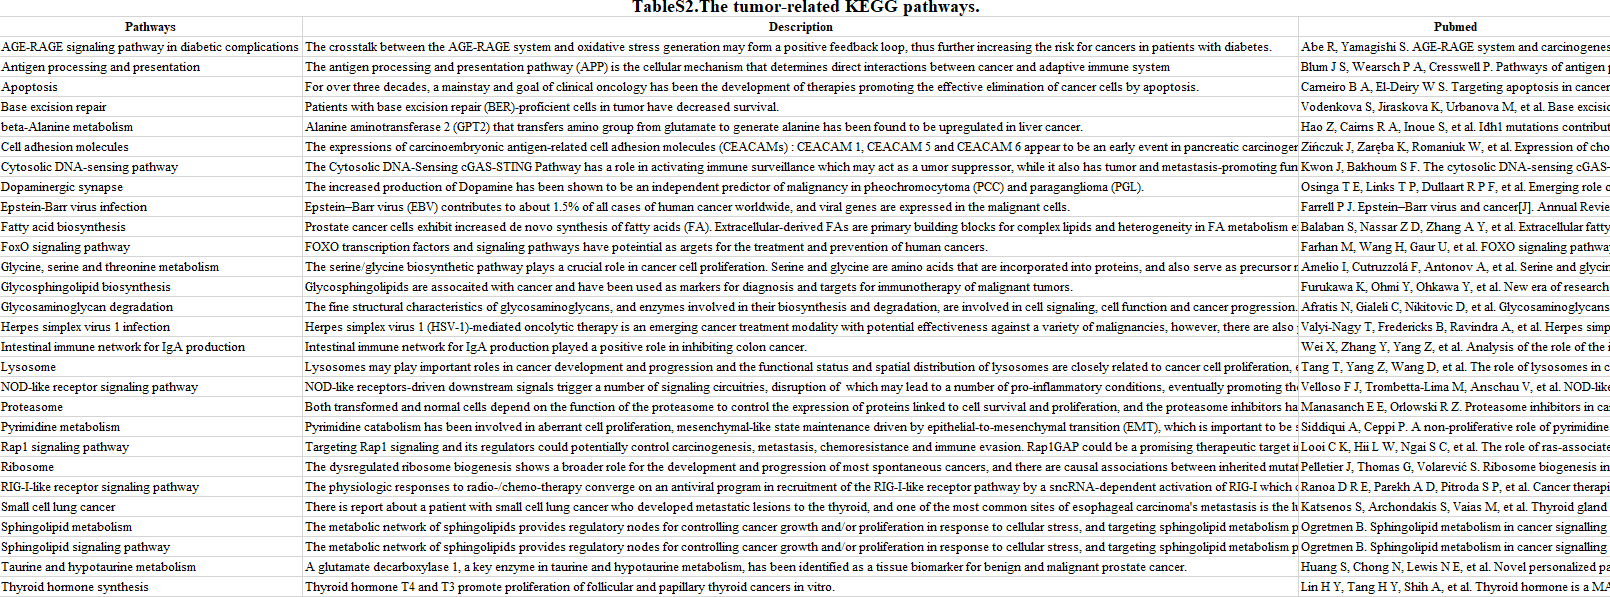 Influence of RNA editing on Protein Influence of RNA editing on Protein 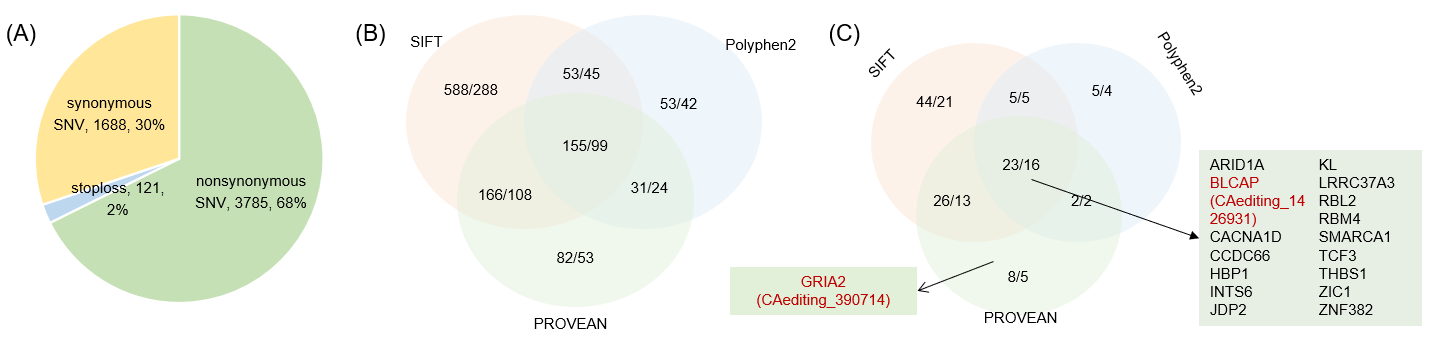 The influence of RNA editing on Protein. (a) RNA editing will lead to the changes of protein sequence. (b) RNA editing may affect protein functions. (c) RNA editing may affect protein function of tumor-related genes. Distribution of RNA editing events in different types of genes (a), regions (b) and repeats (c). 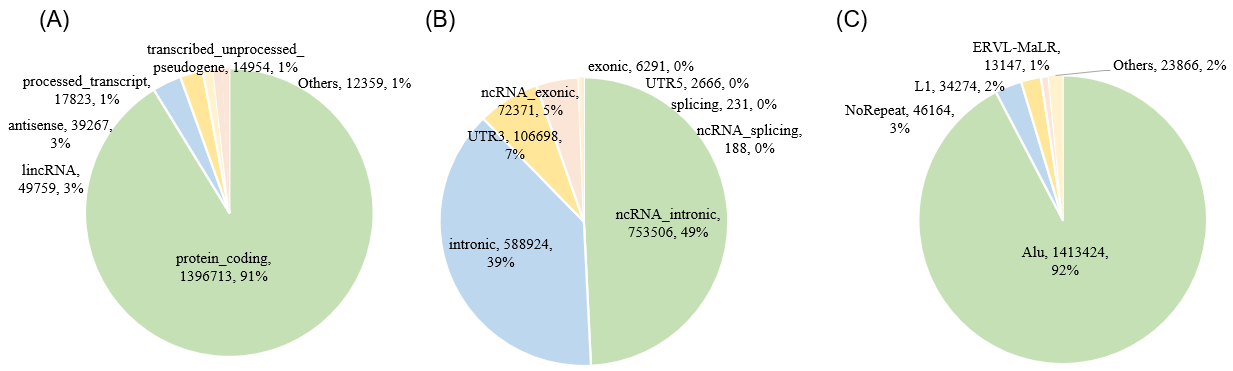 Influence of RNA editing on RNA structure Influence of RNA editing on RNA structure 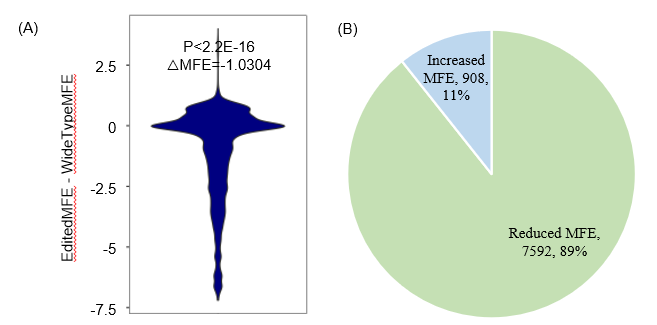 Correlation between ADAR expression and editing frequencies Correlation between ADAR expression and editing frequencies 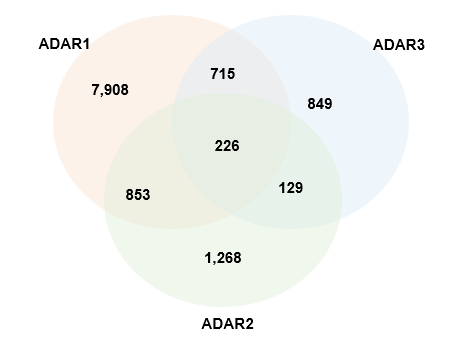 Influence of RNA editing on splicing strength Influence of RNA editing on splicing strength 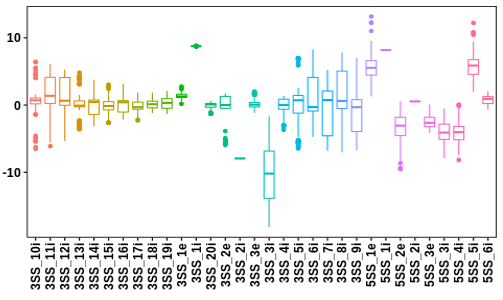 Influence of RNA editing on miRNA binding. Influence of RNA editing on miRNA binding. 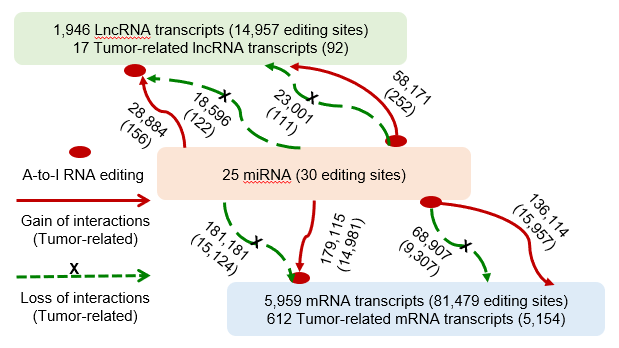 |
||||||