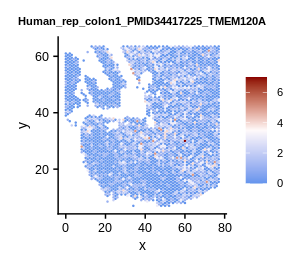
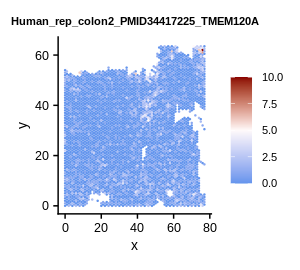
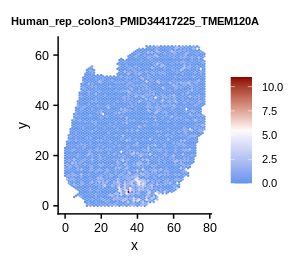
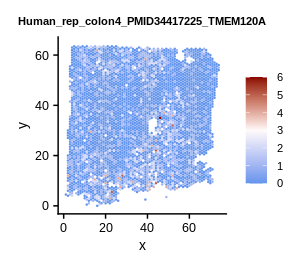
| Symbol | Pathway | Species | Tissue type | Replication | P-value |
| TMEM120A | GOBP_Transmembrane_Transport | Human | Brain | rep_1 | 2.8e-23 |
| TMEM120A | GOBP_Detection_Of_Mechanical_Stimulus_Involved_In_Sensory_Perception_Of_Pain | Human | Brain | st | 4.1e-13 |
| TMEM120A | GOBP_Detection_Of_Stimulus_Involved_In_Sensory_Perception_Of_Pain | Human | Brain | st | 8.6e-10 |
| TMEM120A | GOBP_Sensory_Perception_Of_Mechanical_Stimulus | Human | Bladder | rep_2 | 1.4e-23 |
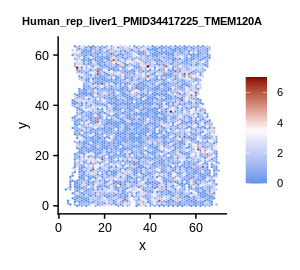
| TMEM120A | GOBP_Transmembrane_Transport | Human | Liver | rep_1 | 1.0e-70 |
| TMEM120A | GOBP_Nervous_System_Process | Human | Intestine | A3 | 9.7e-07 |
| TMEM120A | GOBP_Response_To_Abiotic_Stimulus | Human | Intestine | A3 | 5.3e-18 |
| TMEM120A | GOBP_Response_To_Mechanical_Stimulus | Human | Intestine | A3 | 6.3e-07 |
| TMEM120A | GOBP_Sensory_Perception_Of_Mechanical_Stimulus | Human | Intestine | A3 | 1.6e-07 |
| TMEM120A | GOBP_Transmembrane_Transport | Human | Intestine | A3 | 1.4e-10 |
| TMEM120A | GOBP_Detection_Of_Abiotic_Stimulus | Human | Intestine | A8 | 1.9e-14 |
| TMEM120A | GOBP_Detection_Of_Mechanical_Stimulus | Human | Intestine | A8 | 3.2e-07 |
| TMEM120A | GOBP_Detection_Of_Mechanical_Stimulus_Involved_In_Sensory_Perception | Human | Intestine | A8 | 3.4e-07 |
| TMEM120A | GOBP_Detection_Of_Stimulus | Human | Intestine | A8 | 2.4e-11 |
| TMEM120A | GOBP_Detection_Of_Stimulus_Involved_In_Sensory_Perception | Human | Intestine | A8 | 1.2e-14 |
| TMEM120A | GOBP_Fat_Cell_Differentiation | Human | Intestine | A8 | 2.4e-24 |
| TMEM120A | GOBP_Protein_Heterooligomerization | Human | Intestine | A8 | 1.4e-09 |
| TMEM120A | GOBP_Sensory_Perception | Human | Intestine | A8 | 2.1e-09 |
| TMEM120A | GOBP_Protein_Complex_Oligomerization | Human | Pancreas | PDAC-B-st1 | 8.7e-05 |
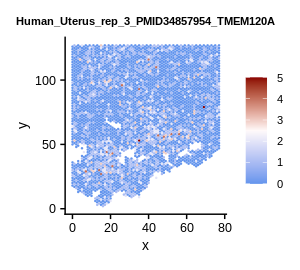
| TMEM120A | GOBP_Sensory_Perception_Of_Pain | Human | Uterus | rep_1 | 5.2e-06 |
| TMEM120A | GOBP_Detection_Of_Mechanical_Stimulus_Involved_In_Sensory_Perception | Human | Uterus | rep_25 | 4.4e-06 |
| TMEM120A | GOBP_Fat_Cell_Differentiation | Human | Uterus | rep_26 | 3.8e-14 |
| TMEM120A | GOBP_Nervous_System_Process | Human | Uterus | rep_26 | 2.3e-07 |
| TMEM120A | GOBP_Sensory_Perception_Of_Mechanical_Stimulus | Human | Uterus | rep_26 | 1.1e-09 |
| TMEM120A | GOBP_Detection_Of_Stimulus_Involved_In_Sensory_Perception_Of_Pain | Human | Uterus | rep_29 | 2.1e-06 |
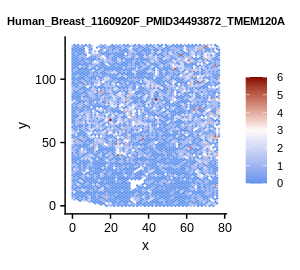
| TMEM120A | GOBP_Detection_Of_Stimulus | Human | Breast | rep_1 | 1.8e-04 |
| TMEM120A | GOBP_Fat_Cell_Differentiation | Human | Breast | rep_1 | 1.1e-26 |
| TMEM120A | GOBP_Nervous_System_Process | Human | Breast | rep_1 | 1.2e-04 |
| TMEM120A | GOBP_Protein_Complex_Oligomerization | Human | Breast | rep_1 | 1.7e-04 |
| TMEM120A | GOBP_Protein_Heterooligomerization | Human | Breast | rep_1 | 5.0e-27 |
| TMEM120A | GOBP_Response_To_Abiotic_Stimulus | Human | Breast | rep_1 | 2.6e-19 |
| TMEM120A | GOBP_Response_To_Mechanical_Stimulus | Human | Breast | rep_1 | 1.2e-38 |
| TMEM120A | GOBP_Transmembrane_Transport | Human | Breast | rep_1 | 3.2e-56 |
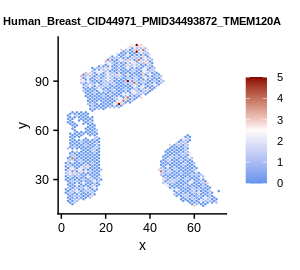
| TMEM120A | GOBP_Detection_Of_Mechanical_Stimulus_Involved_In_Sensory_Perception | Human | Breast | rep_4 | 1.6e-09 |
| TMEM120A | GOBP_Detection_Of_Abiotic_Stimulus | Human | Breast | rep_5 | 3.2e-04 |
| TMEM120A | GOBP_Detection_Of_Stimulus_Involved_In_Sensory_Perception_Of_Pain | Human | Breast | rep_5 | 2.0e-14 |
| TMEM120A | GOBP_Sensory_Perception_Of_Mechanical_Stimulus | Human | Breast | rep_5 | 1.4e-10 |
| TMEM120A | GOBP_Detection_Of_Stimulus_Involved_In_Sensory_Perception | Human | Breast | rep_6 | 3.6e-05 |
| TMEM120A | GOBP_Sensory_Perception_Of_Pain | Human | Breast | rep_6 | 1.3e-07 |
| TMEM120A | GOBP_Sensory_Perception_Of_Pain | Human | Skin | P2_rep3 | 1.7e-08 |
| TMEM120A | GOBP_Protein_Homooligomerization | Human | Skin | P10_rep1 | 9.8e-09 |
| TMEM120A | GOBP_Detection_Of_Mechanical_Stimulus_Involved_In_Sensory_Perception_Of_Pain | Human | Skin | P10_rep2 | 9.0e-08 |
| TMEM120A | GOBP_Detection_Of_Stimulus_Involved_In_Sensory_Perception | Human | Lung | rep_1 | 6.6e-10 |


 Gene summary