| Symbol | Pathway | Species | Tissue type | Replication | P-value |
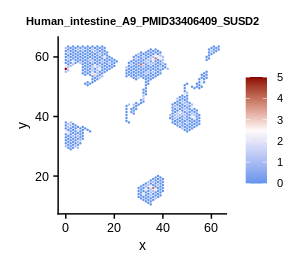
| SUSD2 | GOBP_Cell_Cycle | Human | Intestine | A3 | 2.7e-11 |
| SUSD2 | GOBP_Cell_Cycle_Phase_Transition | Human | Intestine | A3 | 3.5e-07 |
| SUSD2 | GOBP_Cell_Cycle_Process | Human | Intestine | A3 | 2.7e-14 |
| SUSD2 | GOBP_Cell_Division | Human | Intestine | A3 | 2.7e-10 |
| SUSD2 | GOBP_Regulation_Of_Cell_Cycle | Human | Intestine | A3 | 1.6e-08 |
| SUSD2 | GOBP_Regulation_Of_Cell_Cycle_Phase_Transition | Human | Intestine | A3 | 2.6e-08 |
| SUSD2 | GOBP_Regulation_Of_Cell_Cycle_Process | Human | Intestine | A3 | 1.1e-15 |
| SUSD2 | GOBP_Regulation_Of_Cell_Division | Human | Intestine | A3 | 1.8e-12 |
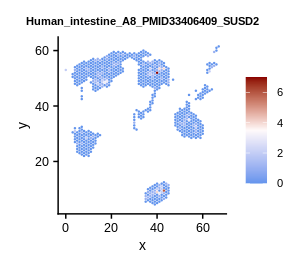
| SUSD2 | GOBP_Cell_Cycle_G1_S_Phase_Transition | Human | Intestine | A8 | 8.5e-07 |
| SUSD2 | GOBP_Negative_Regulation_Of_Cell_Cycle | Human | Intestine | A8 | 3.1e-14 |
| SUSD2 | GOBP_Negative_Regulation_Of_Cell_Cycle_G1_S_Phase_Transition | Human | Intestine | A8 | 2.1e-11 |
| SUSD2 | GOBP_Negative_Regulation_Of_Cell_Cycle_Phase_Transition | Human | Intestine | A8 | 4.4e-08 |
| SUSD2 | GOBP_Negative_Regulation_Of_Cell_Cycle_Process | Human | Intestine | A8 | 6.5e-12 |
| SUSD2 | GOBP_Negative_Regulation_Of_Cell_Division | Human | Intestine | A8 | 1.8e-12 |
| SUSD2 | GOBP_Cell_Division | Human | Pancreas | PDAC-B-st1 | 5.8e-05 |
| SUSD2 | GOBP_Cell_Cycle_Phase_Transition | Human | Uterus | rep_26 | 1.9e-06 |
| SUSD2 | GOBP_Negative_Regulation_Of_Cell_Cycle | Human | Uterus | rep_26 | 1.0e-08 |
| SUSD2 | GOBP_Negative_Regulation_Of_Cell_Cycle_Phase_Transition | Human | Uterus | rep_26 | 8.1e-09 |
| SUSD2 | GOBP_Negative_Regulation_Of_Cell_Cycle_Process | Human | Uterus | rep_26 | 2.4e-12 |
| SUSD2 | GOBP_Negative_Regulation_Of_Cell_Division | Human | Uterus | rep_26 | 4.3e-14 |
| SUSD2 | GOBP_Regulation_Of_Cell_Cycle_Phase_Transition | Human | Uterus | rep_26 | 9.3e-07 |
| SUSD2 | GOBP_Regulation_Of_Cell_Division | Human | Uterus | rep_26 | 1.3e-14 |
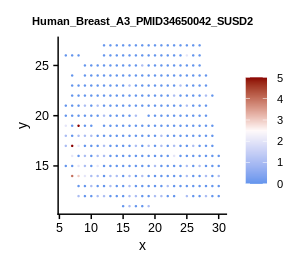
| SUSD2 | GOBP_Regulation_Of_Cell_Cycle | Human | Breast | rep_5 | 3.7e-04 |
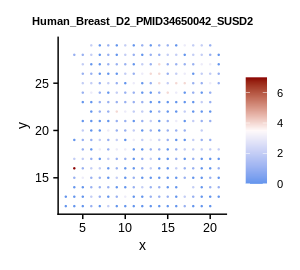
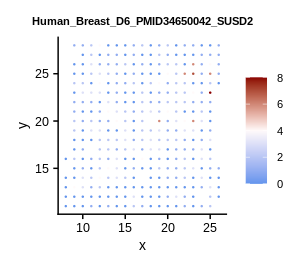
| SUSD2 | GOBP_Cell_Cycle | Human | Breast | rep_6 | 3.4e-09 |
| SUSD2 | GOBP_Cell_Cycle_G1_S_Phase_Transition | Human | Breast | rep_6 | 3.5e-11 |
| SUSD2 | GOBP_Cell_Cycle_Phase_Transition | Human | Breast | rep_6 | 4.9e-09 |
| SUSD2 | GOBP_Cell_Cycle_Process | Human | Breast | rep_6 | 6.7e-09 |
| SUSD2 | GOBP_Cell_Division | Human | Breast | rep_6 | 8.2e-07 |
| SUSD2 | GOBP_Negative_Regulation_Of_Cell_Cycle | Human | Breast | rep_6 | 5.3e-11 |
| SUSD2 | GOBP_Negative_Regulation_Of_Cell_Cycle_G1_S_Phase_Transition | Human | Breast | rep_6 | 1.1e-11 |
| SUSD2 | GOBP_Negative_Regulation_Of_Cell_Cycle_Phase_Transition | Human | Breast | rep_6 | 9.1e-12 |
| SUSD2 | GOBP_Negative_Regulation_Of_Cell_Cycle_Process | Human | Breast | rep_6 | 2.3e-13 |
| SUSD2 | GOBP_Negative_Regulation_Of_Cell_Division | Human | Breast | rep_6 | 5.3e-05 |
| SUSD2 | GOBP_Regulation_Of_Cell_Cycle_G1_S_Phase_Transition | Human | Breast | rep_6 | 2.8e-06 |
| SUSD2 | GOBP_Regulation_Of_Cell_Cycle_Phase_Transition | Human | Breast | rep_6 | 2.7e-07 |
| SUSD2 | GOBP_Regulation_Of_Cell_Cycle_Process | Human | Breast | rep_6 | 6.1e-08 |
| SUSD2 | GOBP_Regulation_Of_Cell_Division | Human | Breast | rep_6 | 9.8e-09 |
| SUSD2 | GOBP_Negative_Regulation_Of_Cell_Cycle_Process | Human | Skin | P5_rep3 | 1.1e-11 |
| SUSD2 | GOBP_Regulation_Of_Cell_Division | Human | Skin | P5_rep3 | 1.3e-09 |
| SUSD2 | GOBP_Negative_Regulation_Of_Cell_Division | Human | Skin | P10_rep2 | 1.3e-13 |
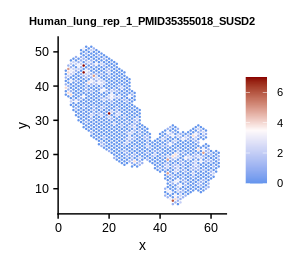
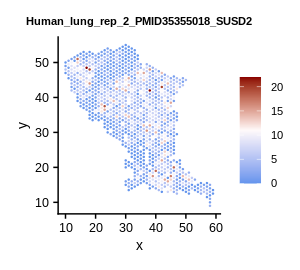
| SUSD2 | GOBP_Negative_Regulation_Of_Cell_Division | Human | Lung | rep_1 | 5.8e-07 |


 Gene summary