
|
||||||
|
 | |
| |
| |
| |
| |
| |
| |
|
Spatial pattern gene: TRMU (spascer ID:55687) |
Gene summary for TRMU |
 Gene summary |
| Gene information | |
| Species | Human | Gene symbol | TRMU | Gene ID | 55687 |
| Gene name | tRNA mitochondrial 2-thiouridylase |
| Synonyms | LCAL3|MTO2|MTU1|TRMT|TRMT1 |
| Cytomap | 22q13.31 |
| Type of gene | protein-coding |
| Description | mitochondrial tRNA-specific 2-thiouridylase 1MTO2 homologlung cancer associated lncRNA 3mitochondrial 5-methylaminomethyl-2-thiouridylate-methyltransferasetRNA 5-methylaminomethyl-2-thiouridylate methyltransferase |
| Modification date | 20220513 |
| UniProtAcc | O75648 |
| Gene ontology with evidence Inferred from Direct Assay (IDA) and Biological aspect of Ancestor (IBA). |
| Gene | GO ID | GO term | PubMed ID | Category |
| TRMU | GO:0002143 | tRNA wobble position uridine thiolation | 21873635 | Process |
| TRMU | GO:0005739 | mitochondrion | 21873635 | Component |
Top |
Spatial pattern events for TRMU |
| spatial pattern gene list. |
| Gene symbol | Species | Tissue | Replication | PMID | Adj p-value |
| TRMU | Human | Liver | rep_liver1 | 34417225 | 1.08e-15 |
| TRMU | Human | Liver | rep_liver2 | 34417225 | 6.98e-16 |
| TRMU | Human | Intestine | A2 | 33406409 | 1.15e-12 |
| TRMU | Human | Uterus | rep_3 | 34857954 | 1.66e-15 |
| TRMU | Human | Breast | A3 | 34650042 | 5.52e-07 |
| TRMU | Human | Breast | 1160920F | 34493872 | 2.01e-14 |
| spatial pattern gene map.(click to enlarge the image in a new window) |
| H&E staining (if available) | Singel gene map |
Liver_rep_liver1_H&E  | 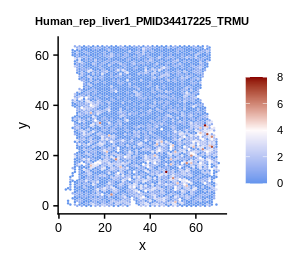 |
Liver_rep_liver2_H&E  | 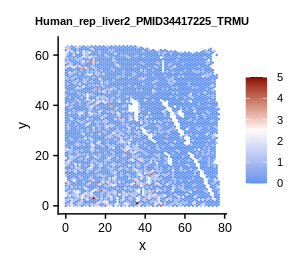 |
Intestine_A2_H&E  | 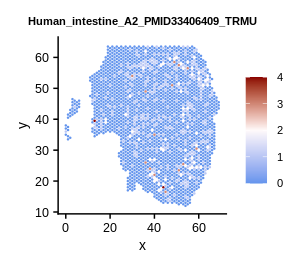 |
Uterus_rep_3_H&E  | 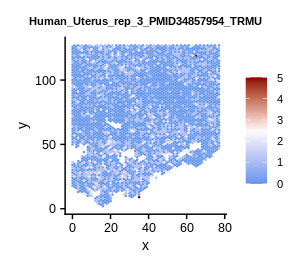 |
Breast_A3_H&E  | 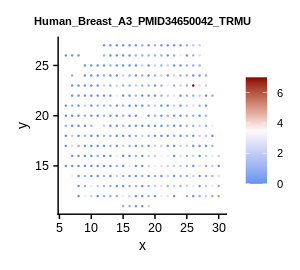 |
Breast_1160920F_H&E  | 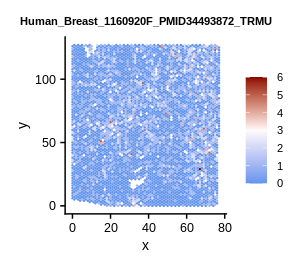 |
Top |
Spatial pattern pathway has TRMU envolved |
| Symbol | Pathway | Species | Tissue type | Replication | P-value |
| TRMU | GOBP_Ncrna_Metabolic_Process | Human | Intestine | A3 | 8.6e-07 |
| TRMU | GOBP_Rna_Modification | Human | Intestine | A3 | 4.5e-10 |
| TRMU | GOBP_Rna_Processing | Human | Intestine | A3 | 3.9e-09 |
| TRMU | GOBP_Trna_Metabolic_Process | Human | Intestine | A3 | 2.5e-12 |
| TRMU | GOBP_Trna_Processing | Human | Intestine | A3 | 1.6e-08 |
| TRMU | GOBP_Trna_Thio_Modification | Human | Intestine | A8 | 8.5e-10 |
| TRMU | GOBP_Trna_Wobble_Base_Modification | Human | Intestine | A8 | 4.3e-16 |
| TRMU | GOBP_Ncrna_Processing | Human | Uterus | rep_1 | 4.5e-06 |
| TRMU | GOBP_Trna_Thio_Modification | Human | Uterus | rep_1 | 6.0e-14 |
| TRMU | GOBP_Trna_Metabolic_Process | Human | Uterus | rep_26 | 9.4e-08 |
| TRMU | GOBP_Trna_Wobble_Base_Modification | Human | Uterus | rep_26 | 1.9e-07 |
| TRMU | GOBP_Trna_Wobble_Base_Modification | Human | Breast | rep_1 | 3.8e-14 |
| TRMU | GOBP_Ncrna_Metabolic_Process | Human | Breast | rep_6 | 1.9e-04 |
| TRMU | GOBP_Ncrna_Processing | Human | Breast | rep_6 | 1.3e-05 |
| TRMU | GOBP_Rna_Modification | Human | Breast | rep_6 | 1.0e-04 |
| TRMU | GOBP_Rna_Processing | Human | Breast | rep_6 | 3.5e-06 |
| TRMU | GOBP_Trna_Metabolic_Process | Human | Breast | rep_6 | 3.9e-05 |
| TRMU | GOBP_Trna_Processing | Human | Breast | rep_6 | 3.5e-08 |
| TRMU | GOBP_Trna_Modification | Human | Skin | P5_rep1 | 4.1e-14 |
| TRMU | GOBP_Trna_Wobble_Base_Modification | Human | Skin | P10_rep2 | 6.0e-11 |
Top |
TRMU function as liang/receptor in single cell data |
| Tissue | Source | SourceCell | Target | TargetCell | PMID | Group |