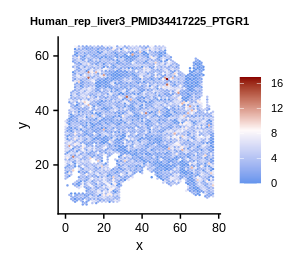
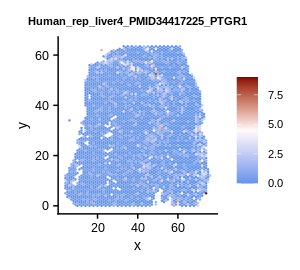
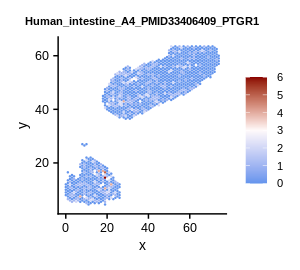
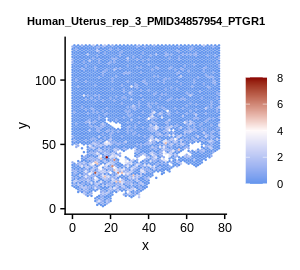
| Symbol | Pathway | Species | Tissue type | Replication | P-value |
| PTGR1 | GOBP_Lipid_Metabolic_Process | Human | Brain | rep_1 | 2.8e-23 |
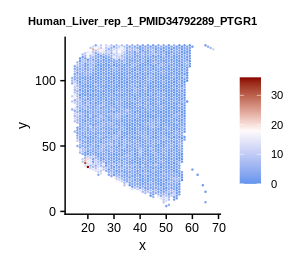
| PTGR1 | GOBP_Lipid_Metabolic_Process | Human | Liver | rep_1 | 1.0e-70 |
| PTGR1 | GOBP_Cellular_Lipid_Metabolic_Process | Human | Intestine | A8 | 3.8e-13 |
| PTGR1 | GOBP_Fatty_Acid_Derivative_Metabolic_Process | Human | Intestine | A8 | 1.5e-08 |
| PTGR1 | GOBP_Fatty_Acid_Metabolic_Process | Human | Intestine | A8 | 7.3e-13 |
| PTGR1 | GOBP_Icosanoid_Metabolic_Process | Human | Intestine | A8 | 9.6e-13 |
| PTGR1 | GOBP_Leukotriene_B4_Metabolic_Process | Human | Intestine | A8 | 2.2e-12 |
| PTGR1 | GOBP_Leukotriene_Metabolic_Process | Human | Intestine | A8 | 2.3e-23 |
| PTGR1 | GOBP_Lipid_Metabolic_Process | Human | Intestine | A8 | 1.1e-11 |
| PTGR1 | GOBP_Lipoxin_Metabolic_Process | Human | Intestine | A8 | 2.8e-30 |
| PTGR1 | GOBP_Monocarboxylic_Acid_Metabolic_Process | Human | Intestine | A8 | 7.3e-16 |
| PTGR1 | GOBP_Organic_Acid_Metabolic_Process | Human | Intestine | A8 | 2.5e-18 |
| PTGR1 | GOBP_Organic_Hydroxy_Compound_Metabolic_Process | Human | Intestine | A8 | 6.4e-10 |
| PTGR1 | GOBP_Prostanoid_Metabolic_Process | Human | Intestine | A8 | 2.1e-10 |
| PTGR1 | GOBP_Small_Molecule_Metabolic_Process | Human | Intestine | A8 | 2.1e-15 |
| PTGR1 | GOBP_Unsaturated_Fatty_Acid_Metabolic_Process | Human | Intestine | A8 | 1.4e-12 |
| PTGR1 | GOBP_Fatty_Acid_Derivative_Metabolic_Process | Human | Uterus | rep_26 | 8.9e-08 |
| PTGR1 | GOBP_Fatty_Acid_Metabolic_Process | Human | Uterus | rep_26 | 1.3e-06 |
| PTGR1 | GOBP_Organic_Acid_Metabolic_Process | Human | Uterus | rep_26 | 4.9e-06 |
| PTGR1 | GOBP_Organic_Hydroxy_Compound_Metabolic_Process | Human | Uterus | rep_26 | 2.5e-08 |
| PTGR1 | GOBP_Prostanoid_Metabolic_Process | Human | Uterus | rep_26 | 1.8e-10 |
| PTGR1 | GOBP_Unsaturated_Fatty_Acid_Metabolic_Process | Human | Uterus | rep_26 | 3.3e-07 |
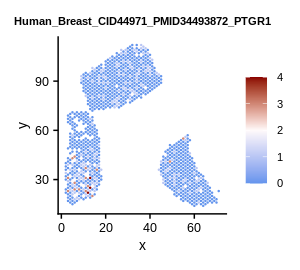
| PTGR1 | GOBP_Fatty_Acid_Derivative_Metabolic_Process | Human | Breast | rep_1 | 1.4e-09 |
| PTGR1 | GOBP_Leukotriene_B4_Metabolic_Process | Human | Breast | rep_1 | 1.1e-27 |
| PTGR1 | GOBP_Organic_Hydroxy_Compound_Metabolic_Process | Human | Breast | rep_1 | 7.3e-16 |
| PTGR1 | GOBP_Cellular_Lipid_Metabolic_Process | Human | Breast | rep_5 | 2.6e-07 |
| PTGR1 | GOBP_Fatty_Acid_Metabolic_Process | Human | Breast | rep_5 | 1.2e-06 |
| PTGR1 | GOBP_Icosanoid_Metabolic_Process | Human | Breast | rep_5 | 2.9e-07 |
| PTGR1 | GOBP_Leukotriene_Metabolic_Process | Human | Breast | rep_5 | 2.4e-05 |
| PTGR1 | GOBP_Lipid_Metabolic_Process | Human | Breast | rep_5 | 2.9e-06 |
| PTGR1 | GOBP_Unsaturated_Fatty_Acid_Metabolic_Process | Human | Breast | rep_5 | 3.8e-09 |
| PTGR1 | GOBP_Monocarboxylic_Acid_Metabolic_Process | Human | Breast | rep_6 | 6.1e-07 |
| PTGR1 | GOBP_Organic_Acid_Metabolic_Process | Human | Breast | rep_6 | 6.7e-05 |
| PTGR1 | GOBP_Small_Molecule_Metabolic_Process | Human | Breast | rep_6 | 5.5e-09 |
| PTGR1 | GOBP_Leukotriene_B4_Metabolic_Process | Human | Skin | P2_rep2 | 6.8e-09 |
| PTGR1 | GOBP_Leukotriene_Metabolic_Process | Human | Skin | P2_rep2 | 1.9e-09 |
| PTGR1 | GOBP_Unsaturated_Fatty_Acid_Metabolic_Process | Human | Skin | P2_rep3 | 8.1e-08 |
| PTGR1 | GOBP_Icosanoid_Metabolic_Process | Human | Lung | rep_2 | 4.6e-07 |


 Gene summary