| Symbol | Pathway | Species | Tissue type | Replication | P-value |
| IMMT | GOBP_Homeostatic_Process | Human | Intestine | A3 | 8.7e-10 |
| IMMT | GOBP_Membrane_Organization | Human | Intestine | A3 | 2.7e-18 |
| IMMT | GOBP_Mitochondrial_Membrane_Organization | Human | Intestine | A3 | 1.0e-17 |
| IMMT | GOBP_Mitochondrion_Organization | Human | Intestine | A3 | 2.3e-19 |
| IMMT | GOBP_Cellular_Homeostasis | Human | Intestine | A8 | 2.1e-11 |
| IMMT | GOBP_Cellular_Ion_Homeostasis | Human | Intestine | A8 | 4.3e-12 |
| IMMT | GOBP_Chemical_Homeostasis | Human | Intestine | A8 | 1.3e-12 |
| IMMT | GOBP_Cristae_Formation | Human | Intestine | A8 | 6.7e-08 |
| IMMT | GOBP_Divalent_Inorganic_Cation_Homeostasis | Human | Intestine | A8 | 1.0e-12 |
| IMMT | GOBP_Inner_Mitochondrial_Membrane_Organization | Human | Intestine | A8 | 9.3e-08 |
| IMMT | GOBP_Ion_Homeostasis | Human | Intestine | A8 | 6.1e-15 |
| IMMT | GOBP_Metal_Ion_Homeostasis | Human | Intestine | A8 | 2.2e-10 |
| IMMT | GOBP_Mitochondrial_Calcium_Ion_Homeostasis | Human | Intestine | A8 | 1.5e-16 |
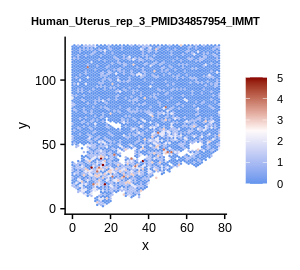
| IMMT | GOBP_Cristae_Formation | Human | Uterus | rep_25 | 9.5e-06 |
| IMMT | GOBP_Homeostatic_Process | Human | Uterus | rep_26 | 1.9e-07 |
| IMMT | GOBP_Inner_Mitochondrial_Membrane_Organization | Human | Uterus | rep_26 | 5.9e-07 |
| IMMT | GOBP_Mitochondrial_Membrane_Organization | Human | Uterus | rep_26 | 1.5e-06 |
| IMMT | GOBP_Mitochondrial_Calcium_Ion_Homeostasis | Human | Uterus | rep_29 | 2.4e-13 |
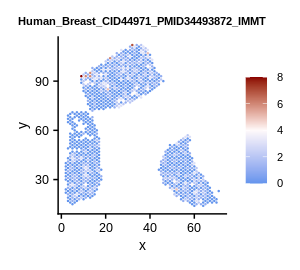
| IMMT | GOBP_Cellular_Homeostasis | Human | Breast | rep_1 | 2.8e-10 |
| IMMT | GOBP_Cellular_Ion_Homeostasis | Human | Breast | rep_1 | 7.6e-24 |
| IMMT | GOBP_Chemical_Homeostasis | Human | Breast | rep_1 | 4.8e-18 |
| IMMT | GOBP_Divalent_Inorganic_Cation_Homeostasis | Human | Breast | rep_1 | 1.2e-25 |
| IMMT | GOBP_Homeostatic_Process | Human | Breast | rep_1 | 9.0e-53 |
| IMMT | GOBP_Ion_Homeostasis | Human | Breast | rep_1 | 1.4e-53 |
| IMMT | GOBP_Metal_Ion_Homeostasis | Human | Breast | rep_1 | 6.8e-70 |
| IMMT | GOBP_Cristae_Formation | Human | Breast | rep_6 | 1.9e-11 |
| IMMT | GOBP_Inner_Mitochondrial_Membrane_Organization | Human | Breast | rep_6 | 1.2e-08 |
| IMMT | GOBP_Mitochondrial_Calcium_Ion_Homeostasis | Human | Breast | rep_6 | 1.6e-11 |
| IMMT | GOBP_Mitochondrial_Membrane_Organization | Human | Breast | rep_6 | 3.7e-05 |
| IMMT | GOBP_Mitochondrion_Organization | Human | Breast | rep_6 | 2.0e-05 |
| IMMT | GOBP_Divalent_Inorganic_Cation_Homeostasis | Human | Skin | P2_rep3 | 1.3e-08 |
| IMMT | GOBP_Mitochondrial_Membrane_Organization | Human | Skin | P5_rep3 | 2.4e-11 |
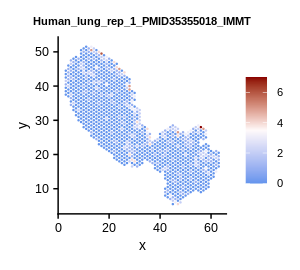
| IMMT | GOBP_Ion_Homeostasis | Human | Lung | rep_1 | 6.1e-07 |
| IMMT | GOBP_Cellular_Homeostasis | Human | Lung | rep_2 | 7.3e-07 |


 Gene summary